
The slides from my presentation at the Vancouver Hockey Analytics Conference can be found here.
Initial predictions for the 2016 Free Agent Class (based on data up to April 6, 2016) can be found here. Note that all RFA salaries are listed assuming RFA-UFA deals (i.e. not bridge contracts). Remember that these are the model’s predictions and not mine, and that the model uses raw counting stats not rate stats so injured players may be discounted (in other words, don’t yell at me about the Stamkos contract).
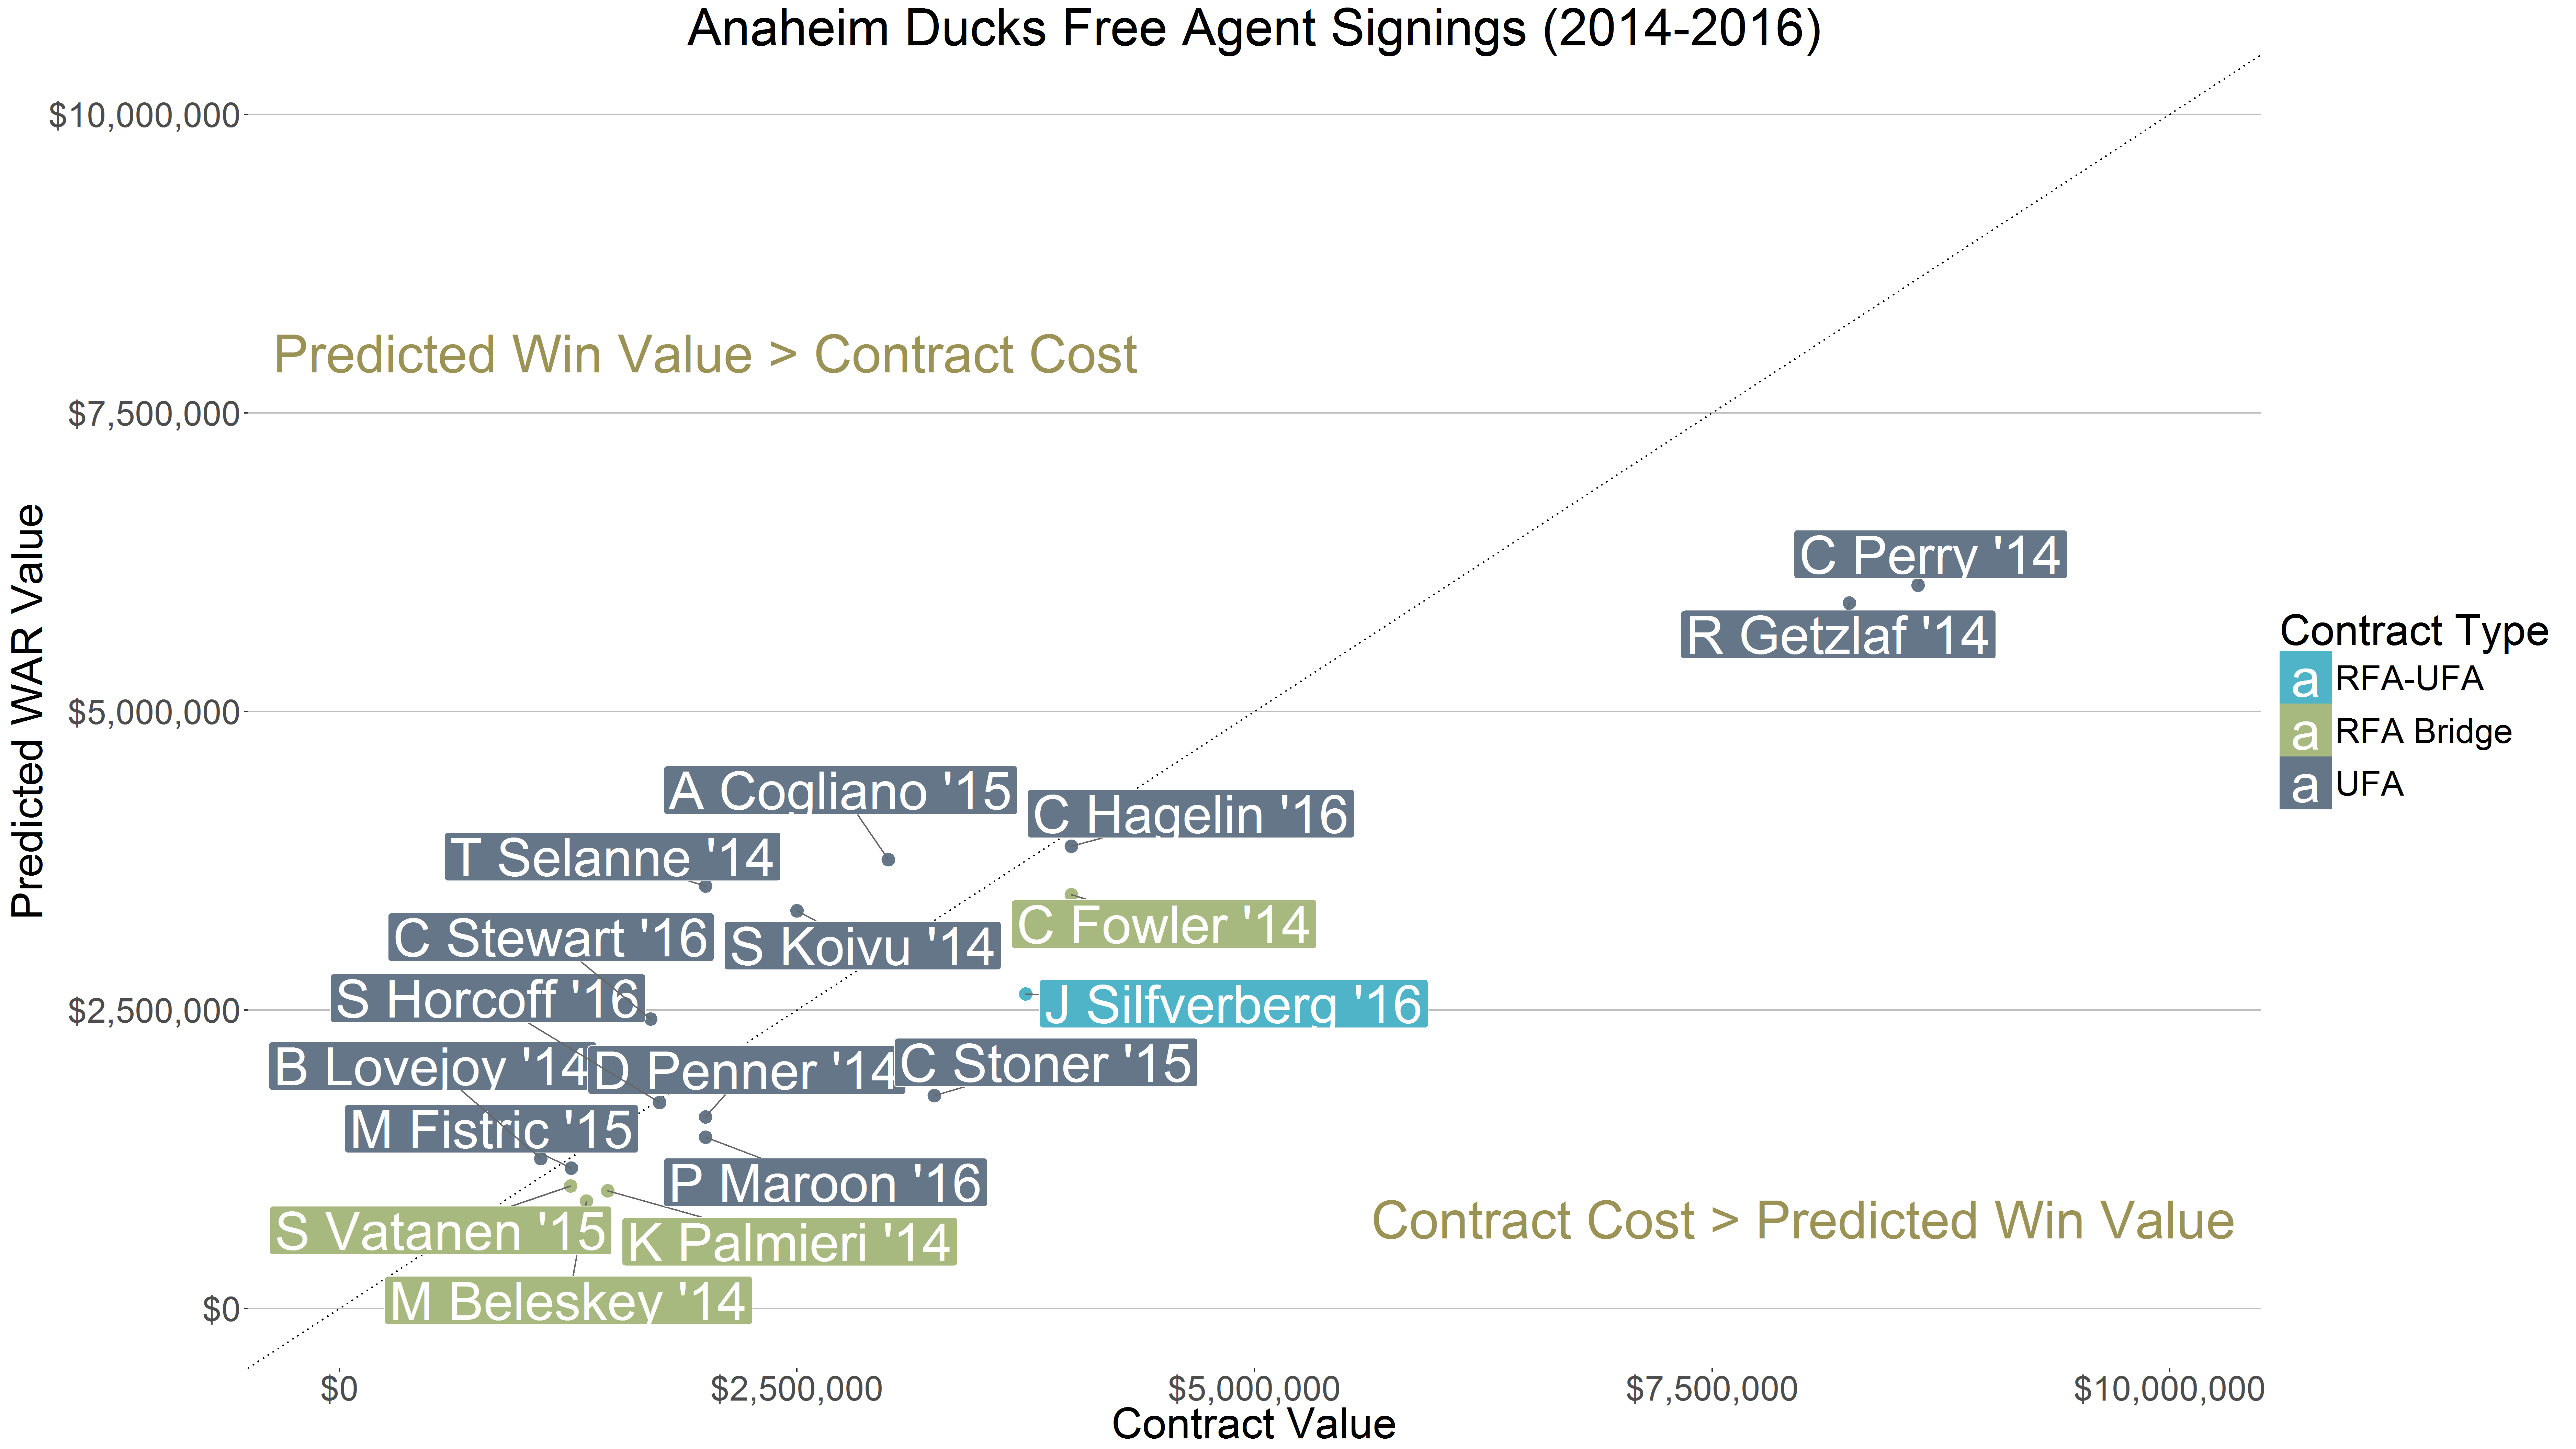
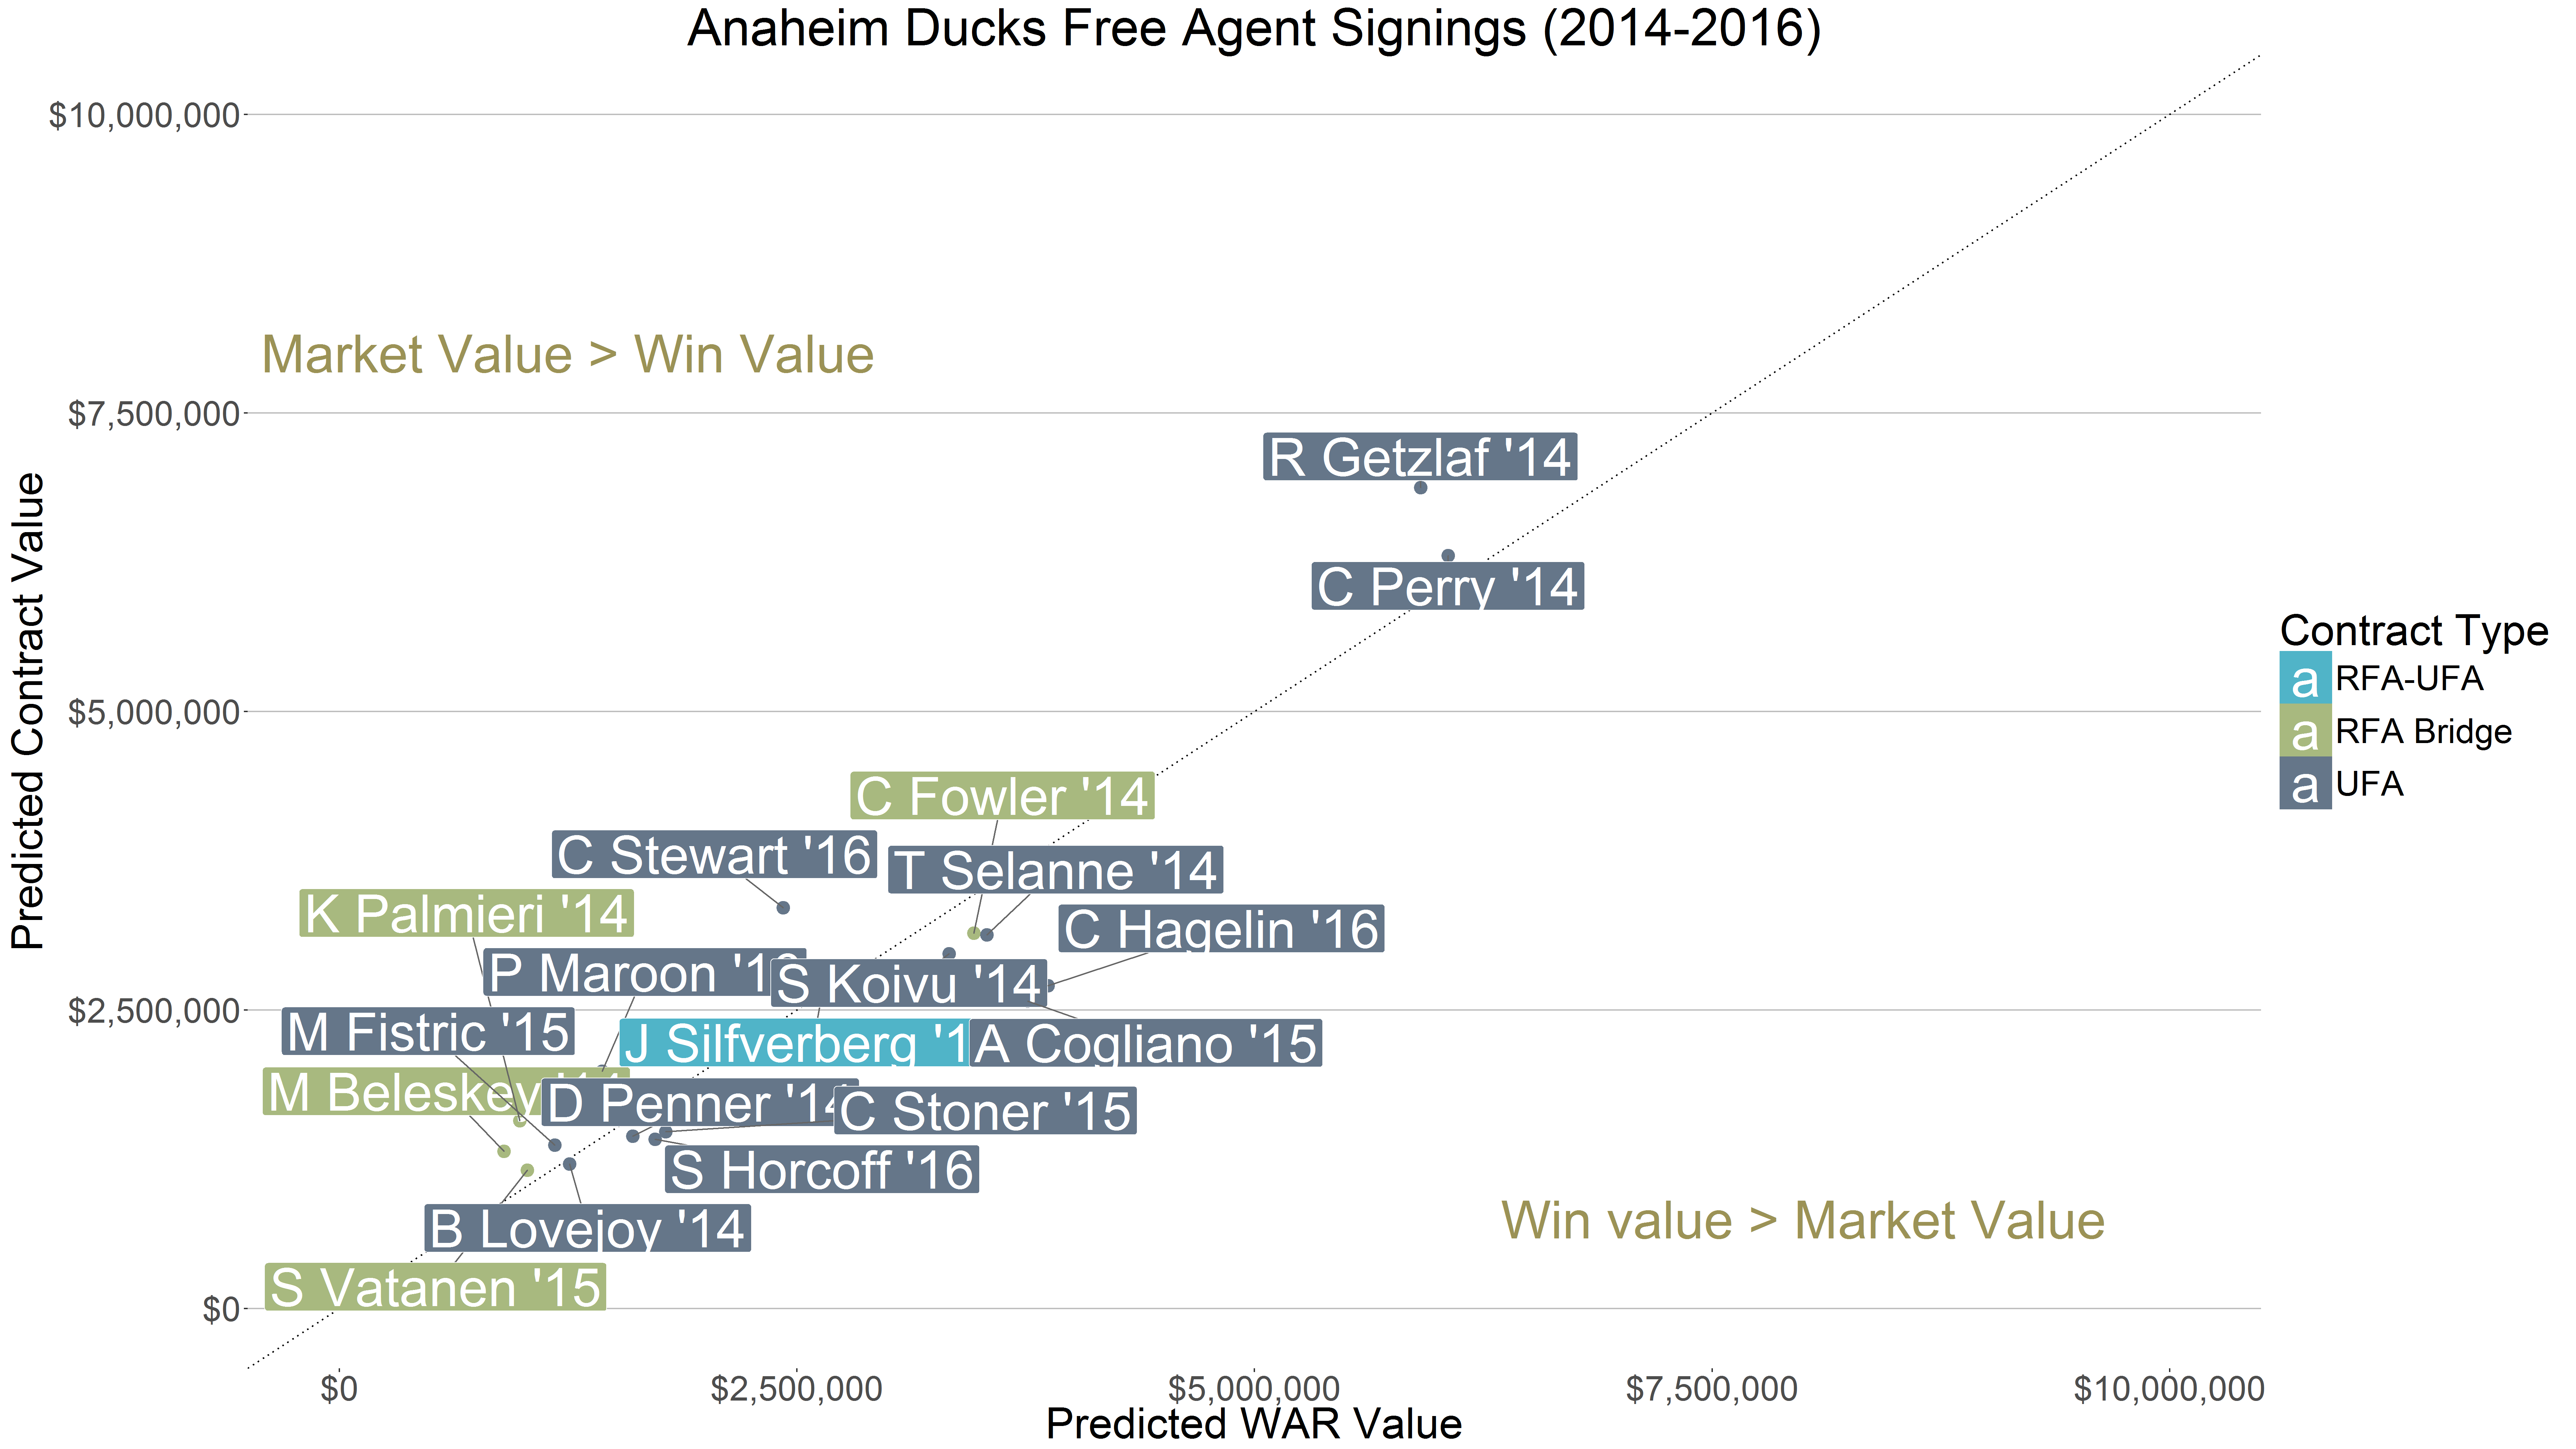
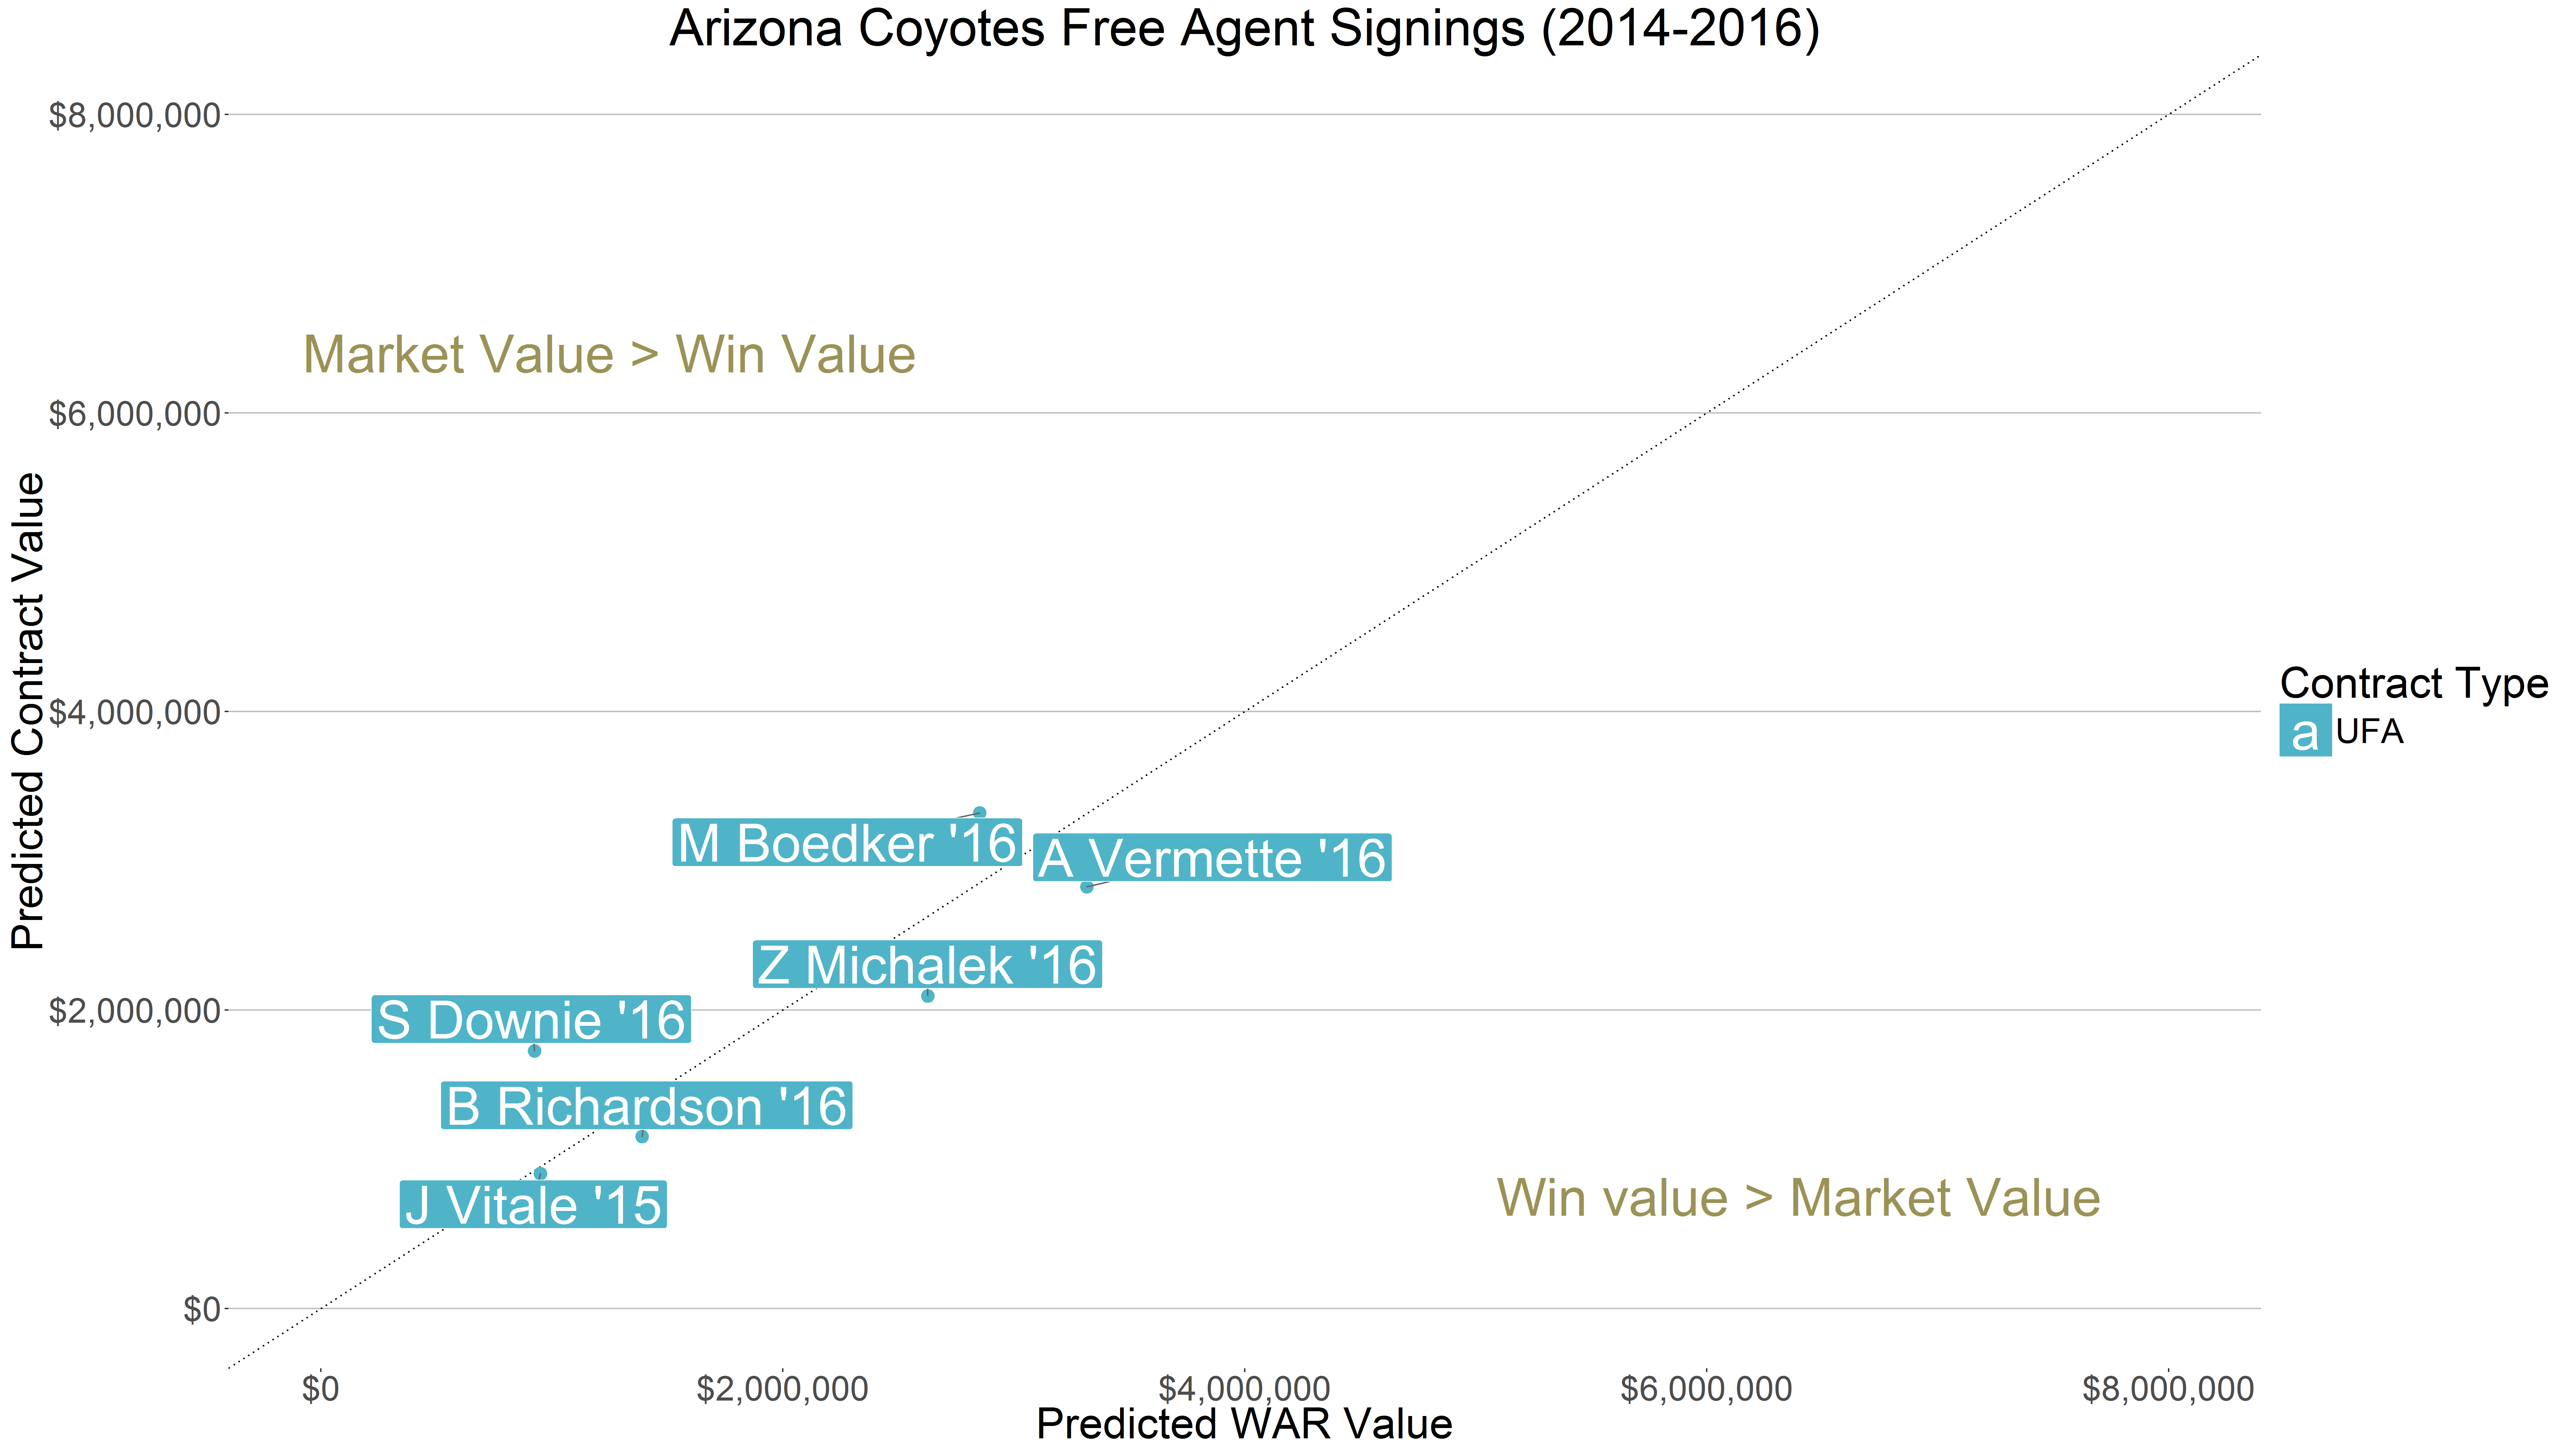
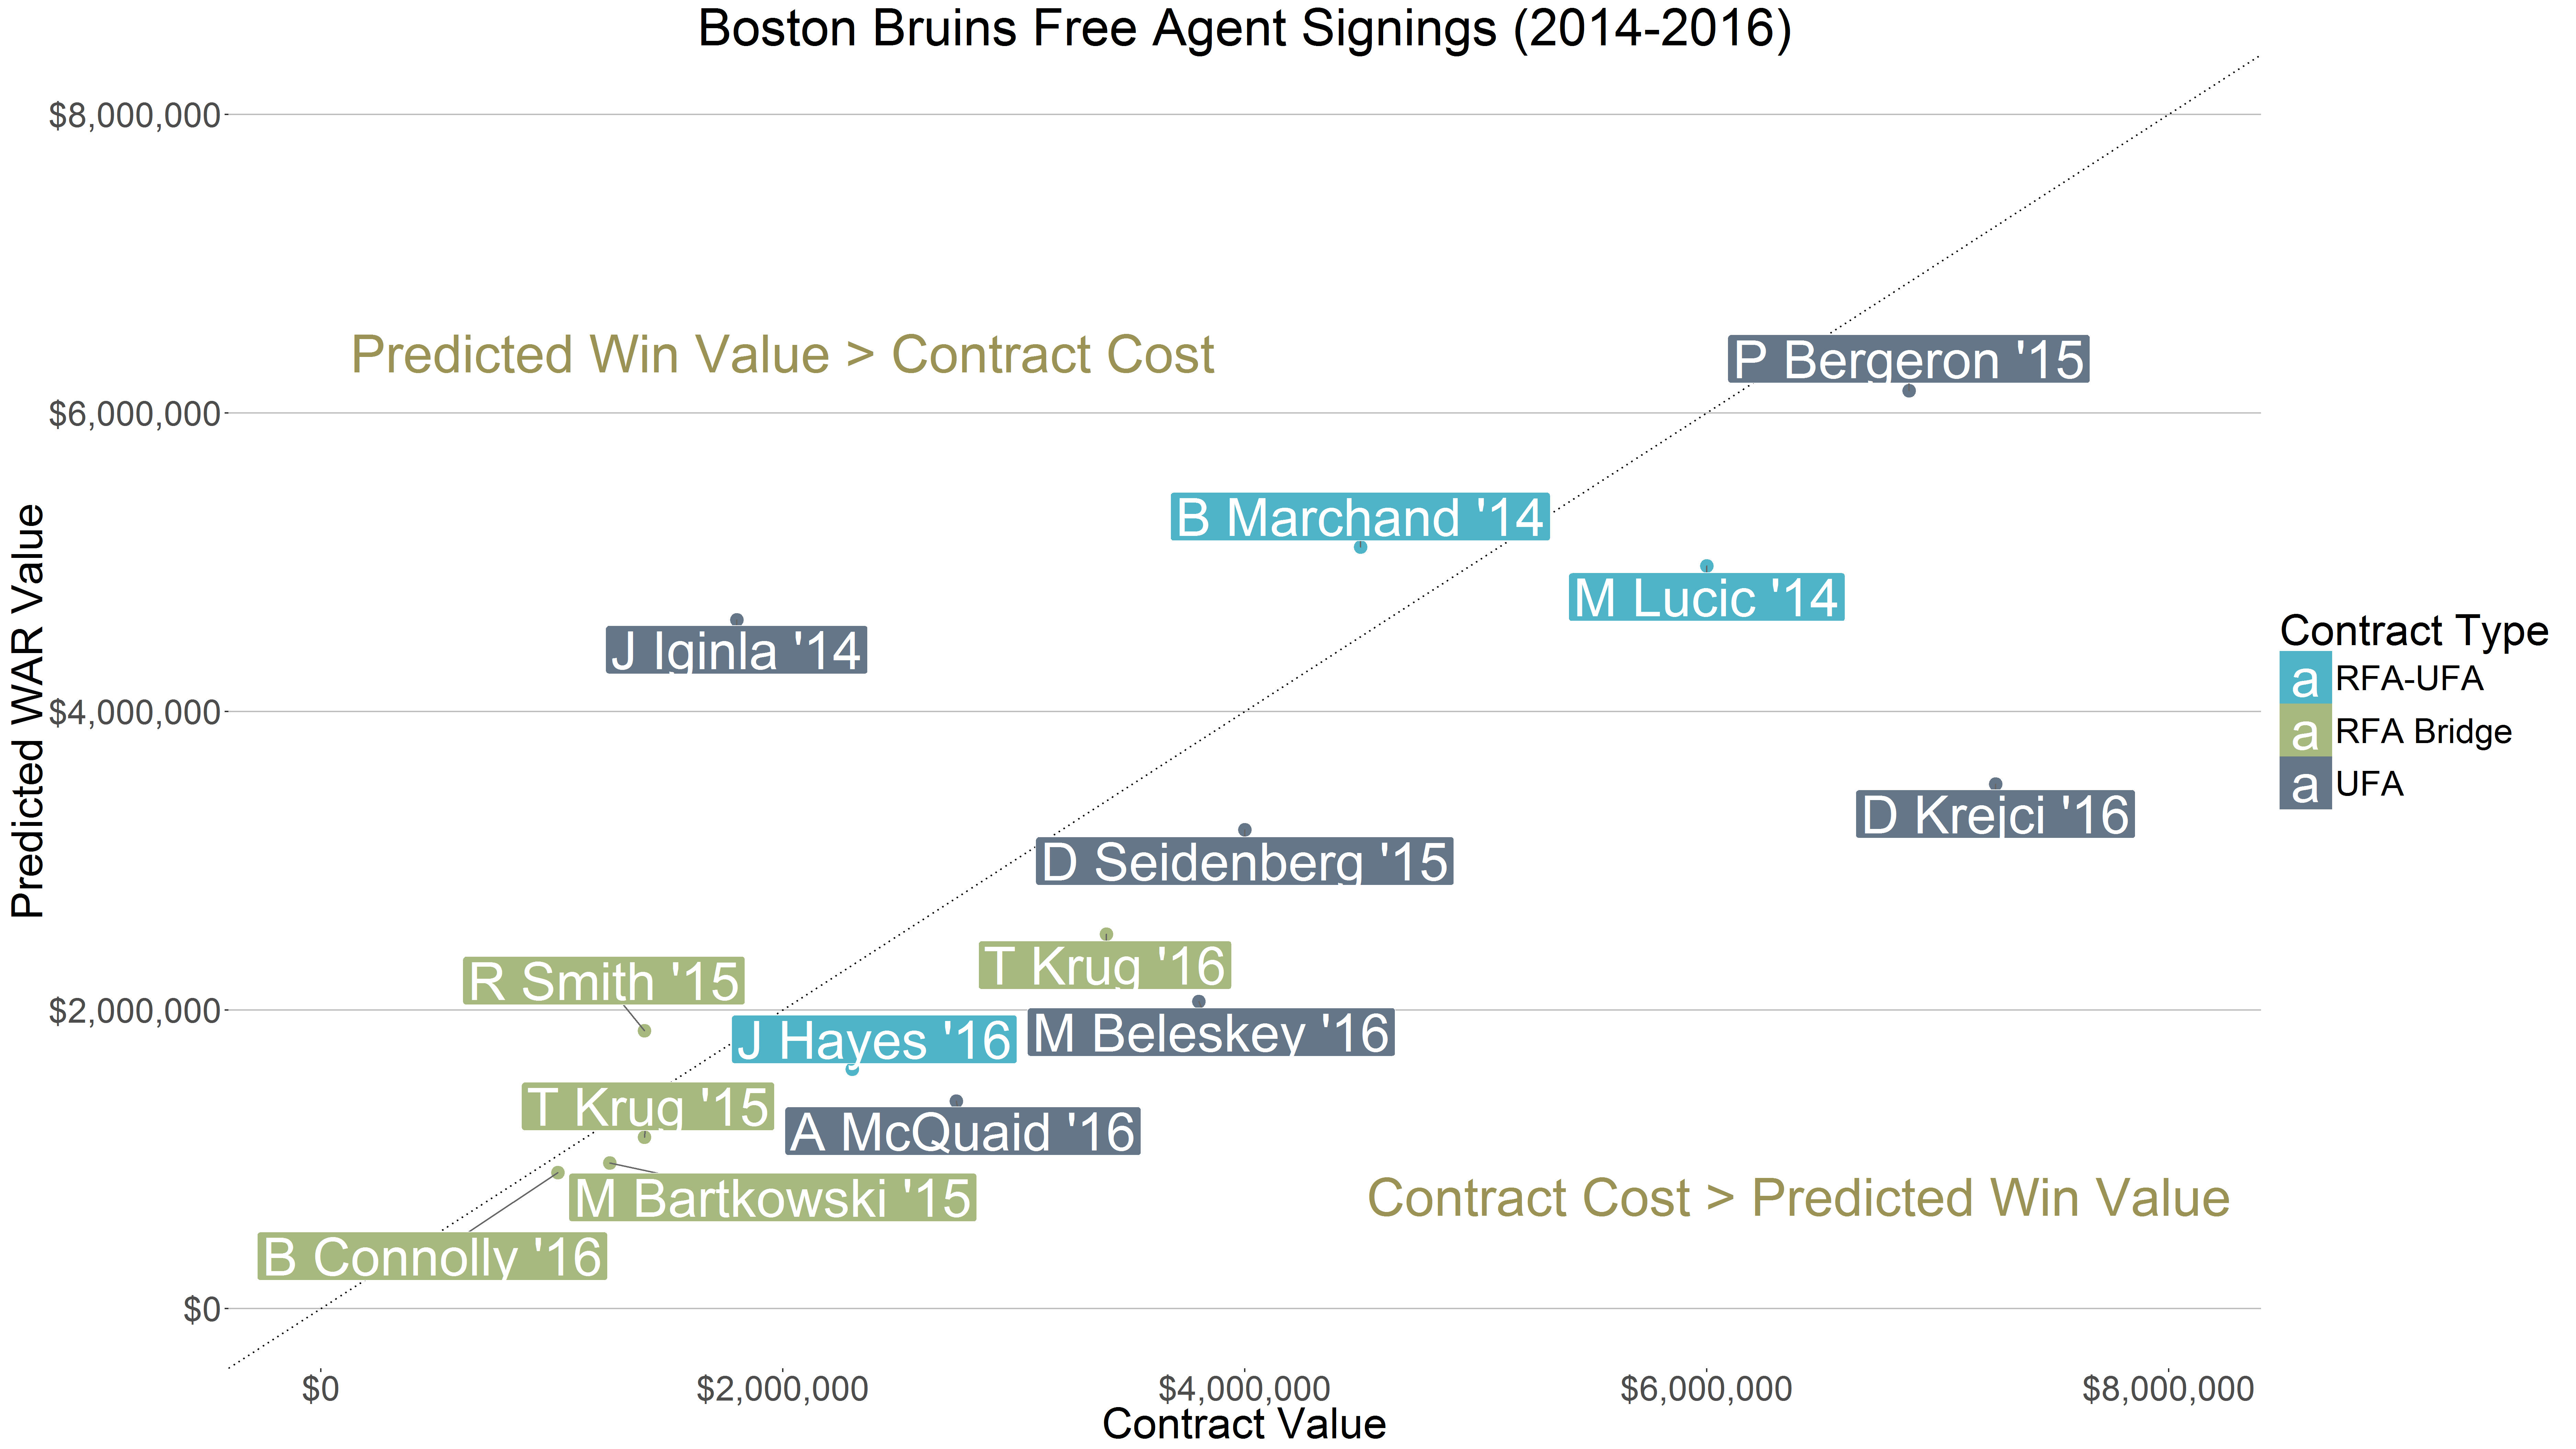
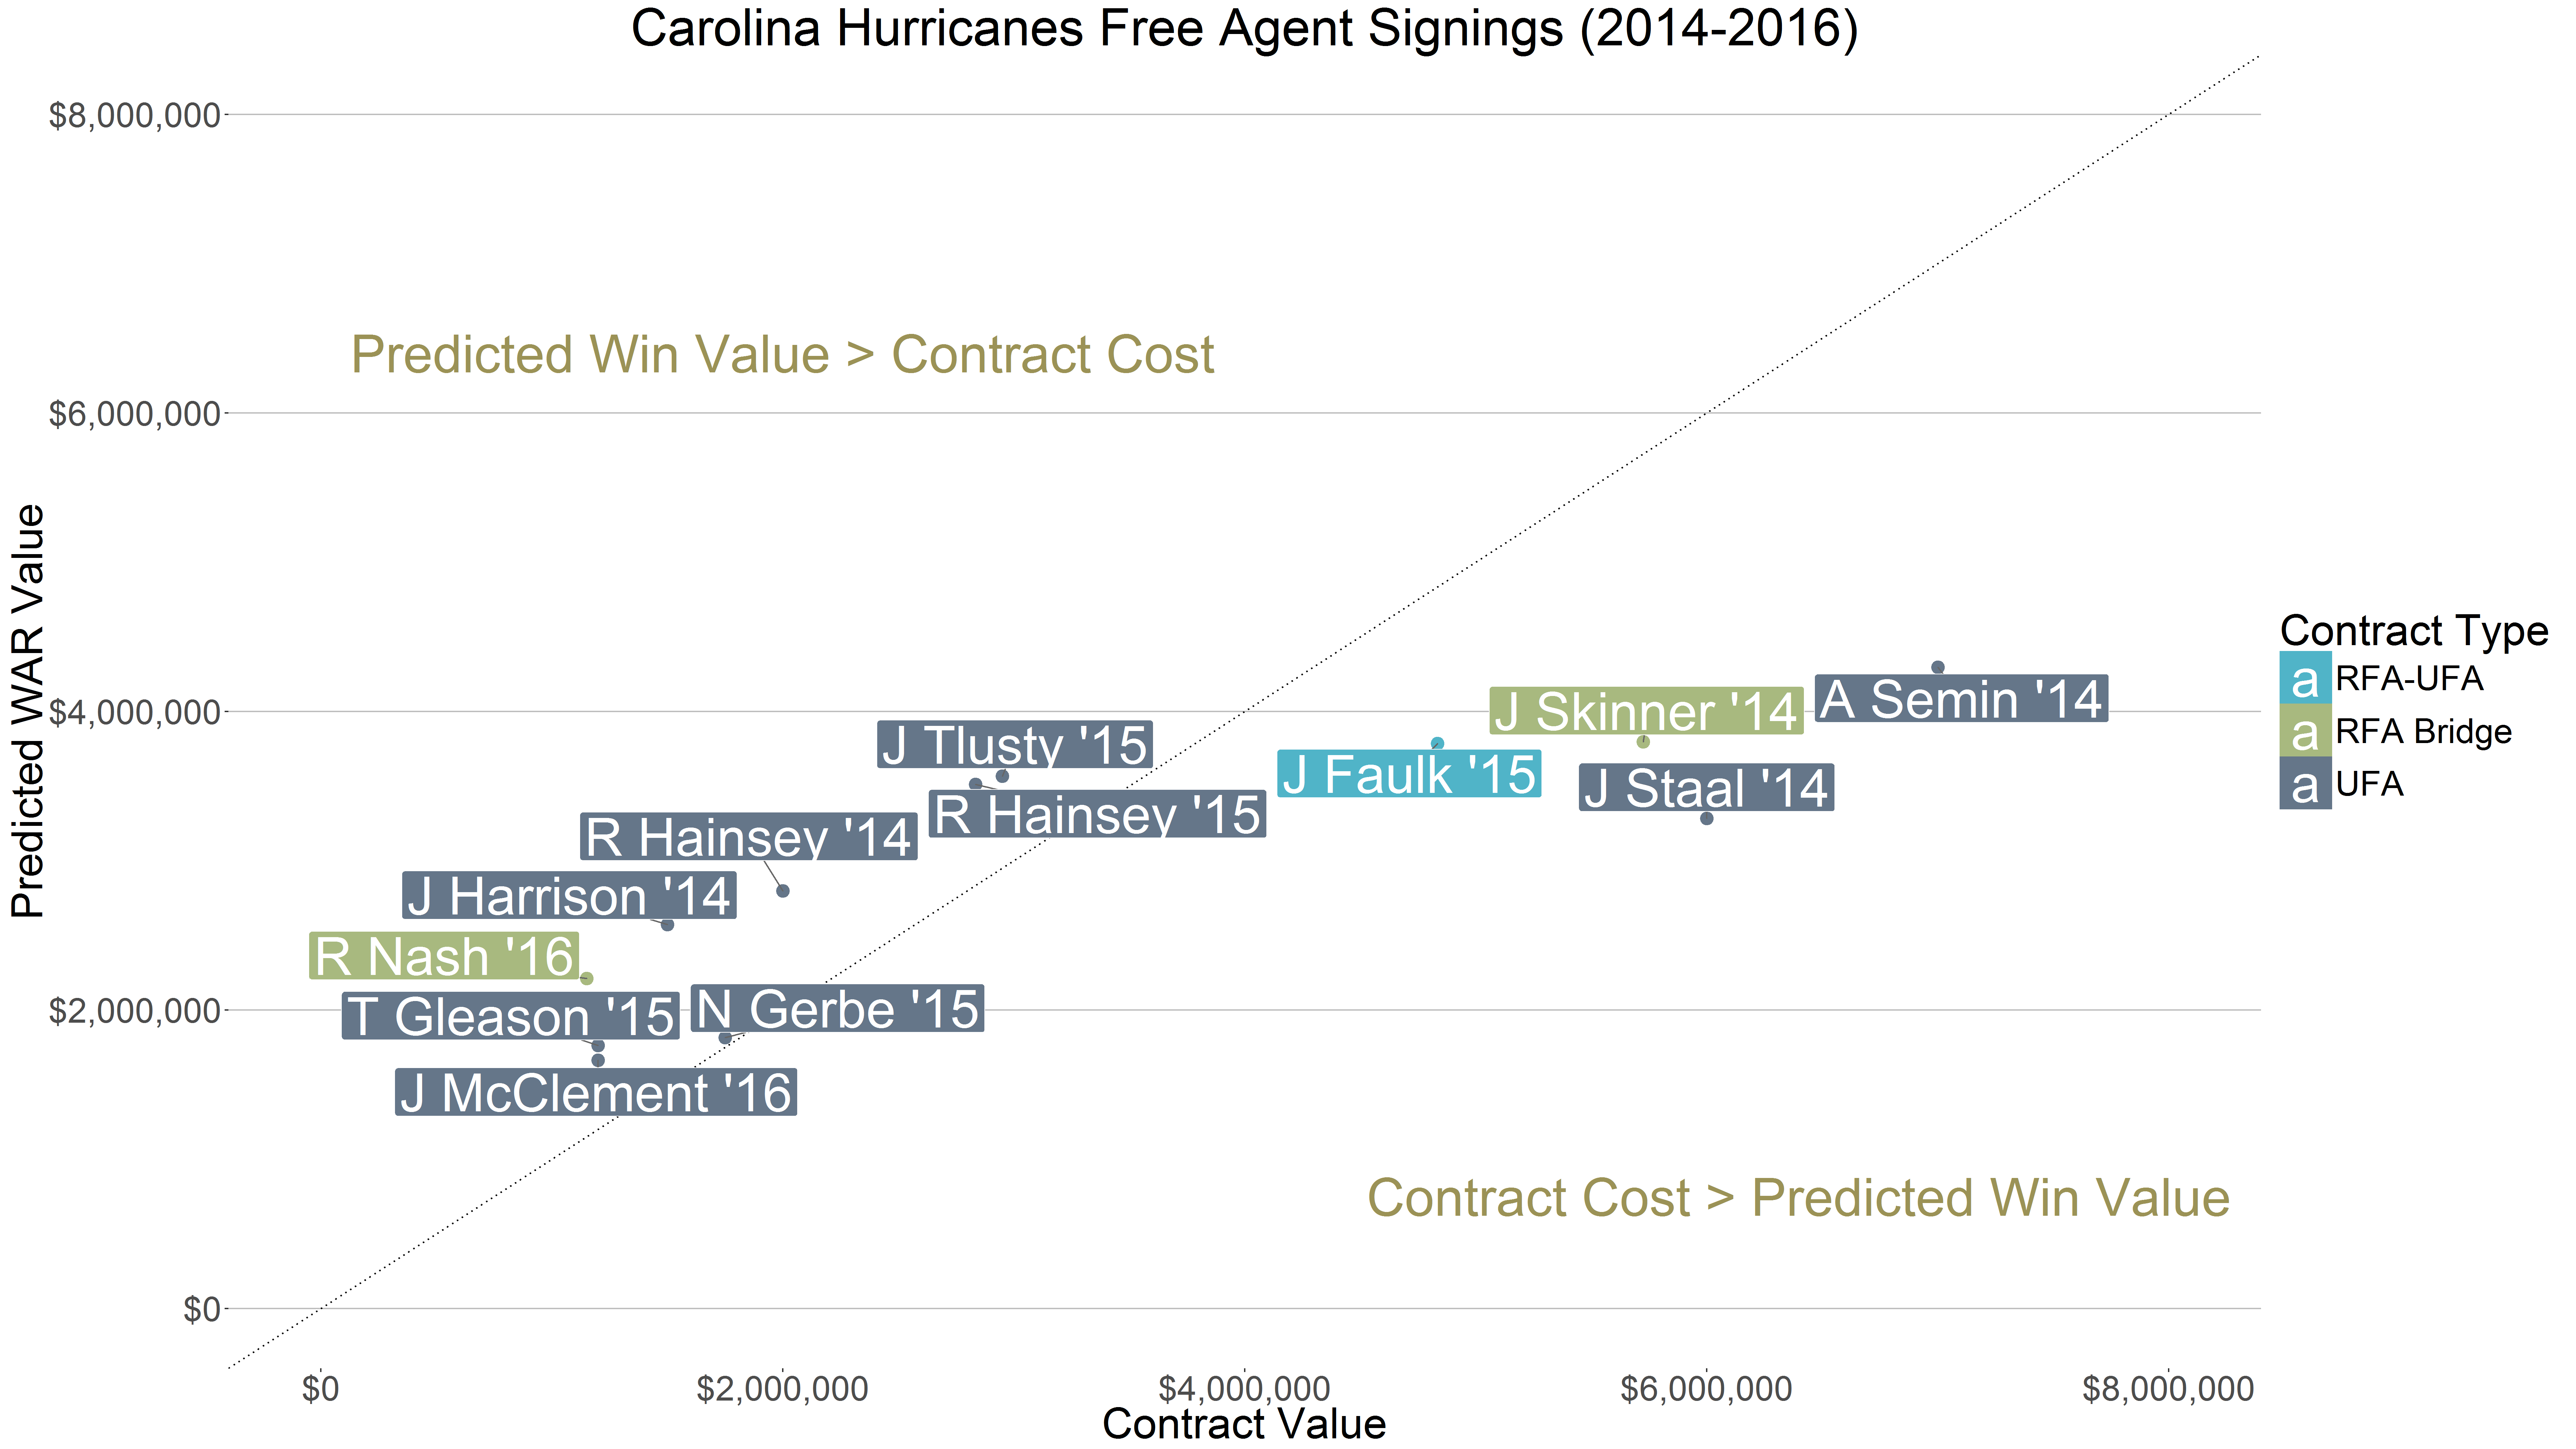
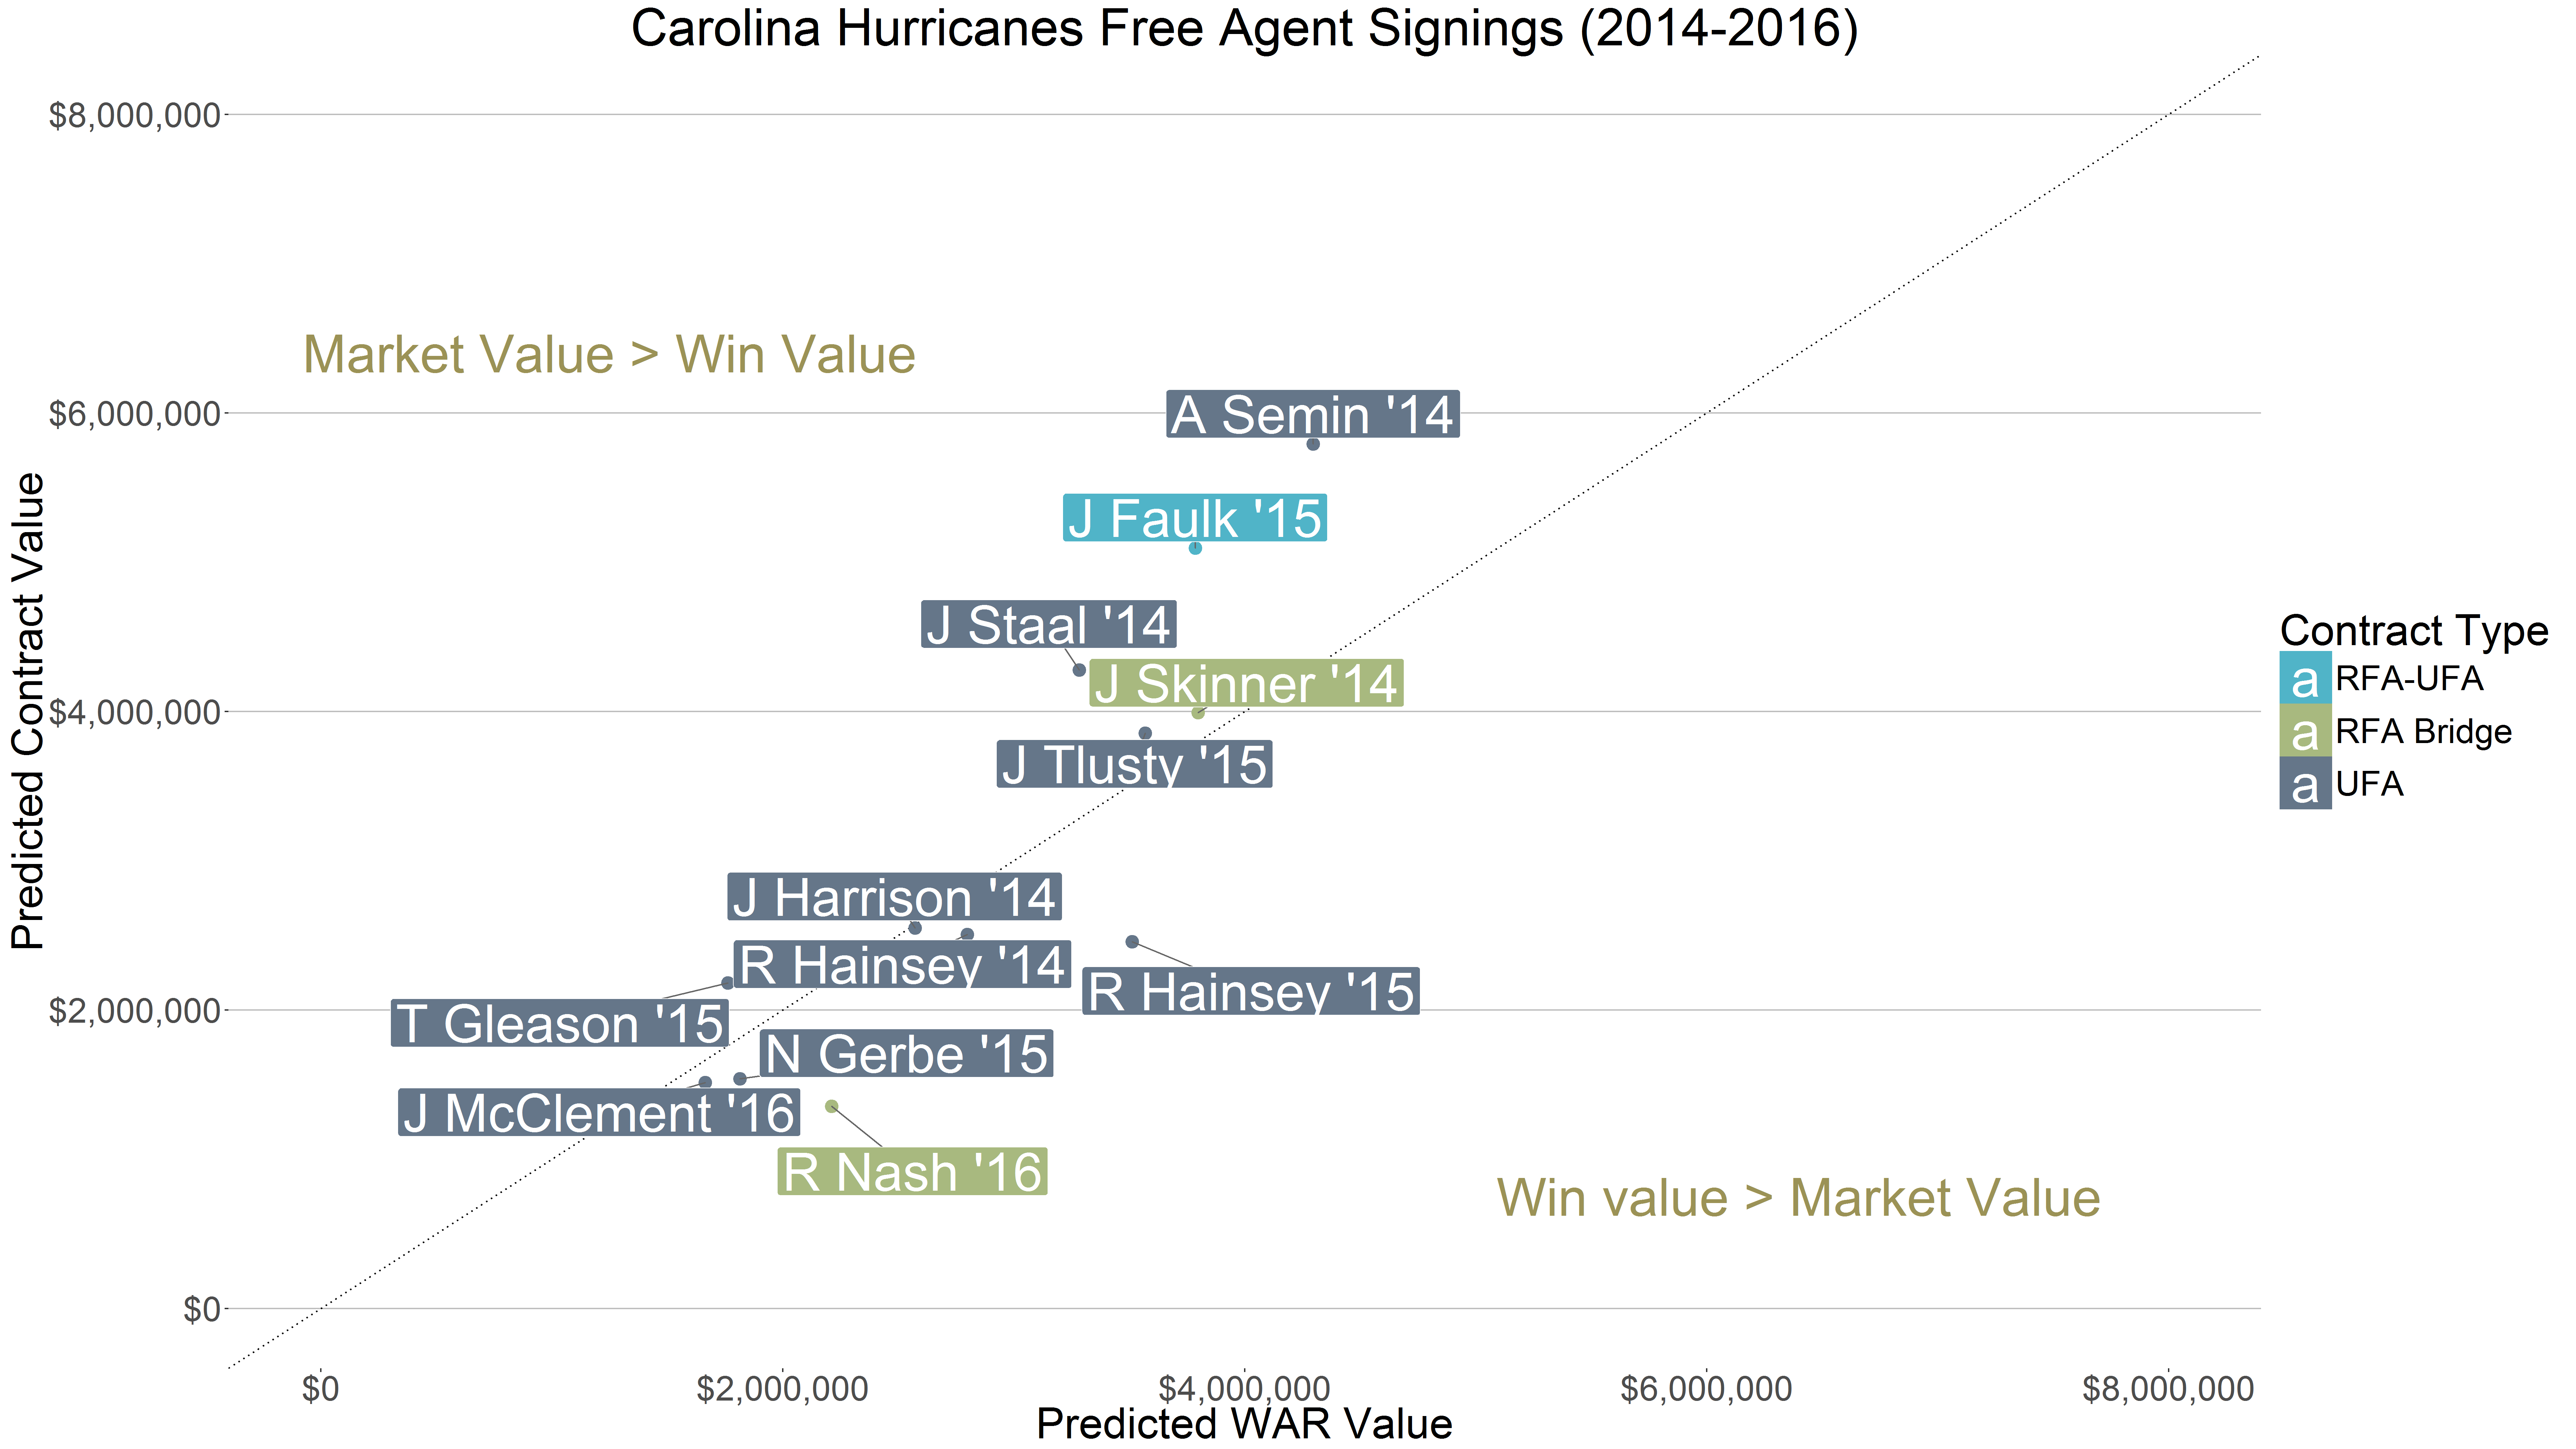
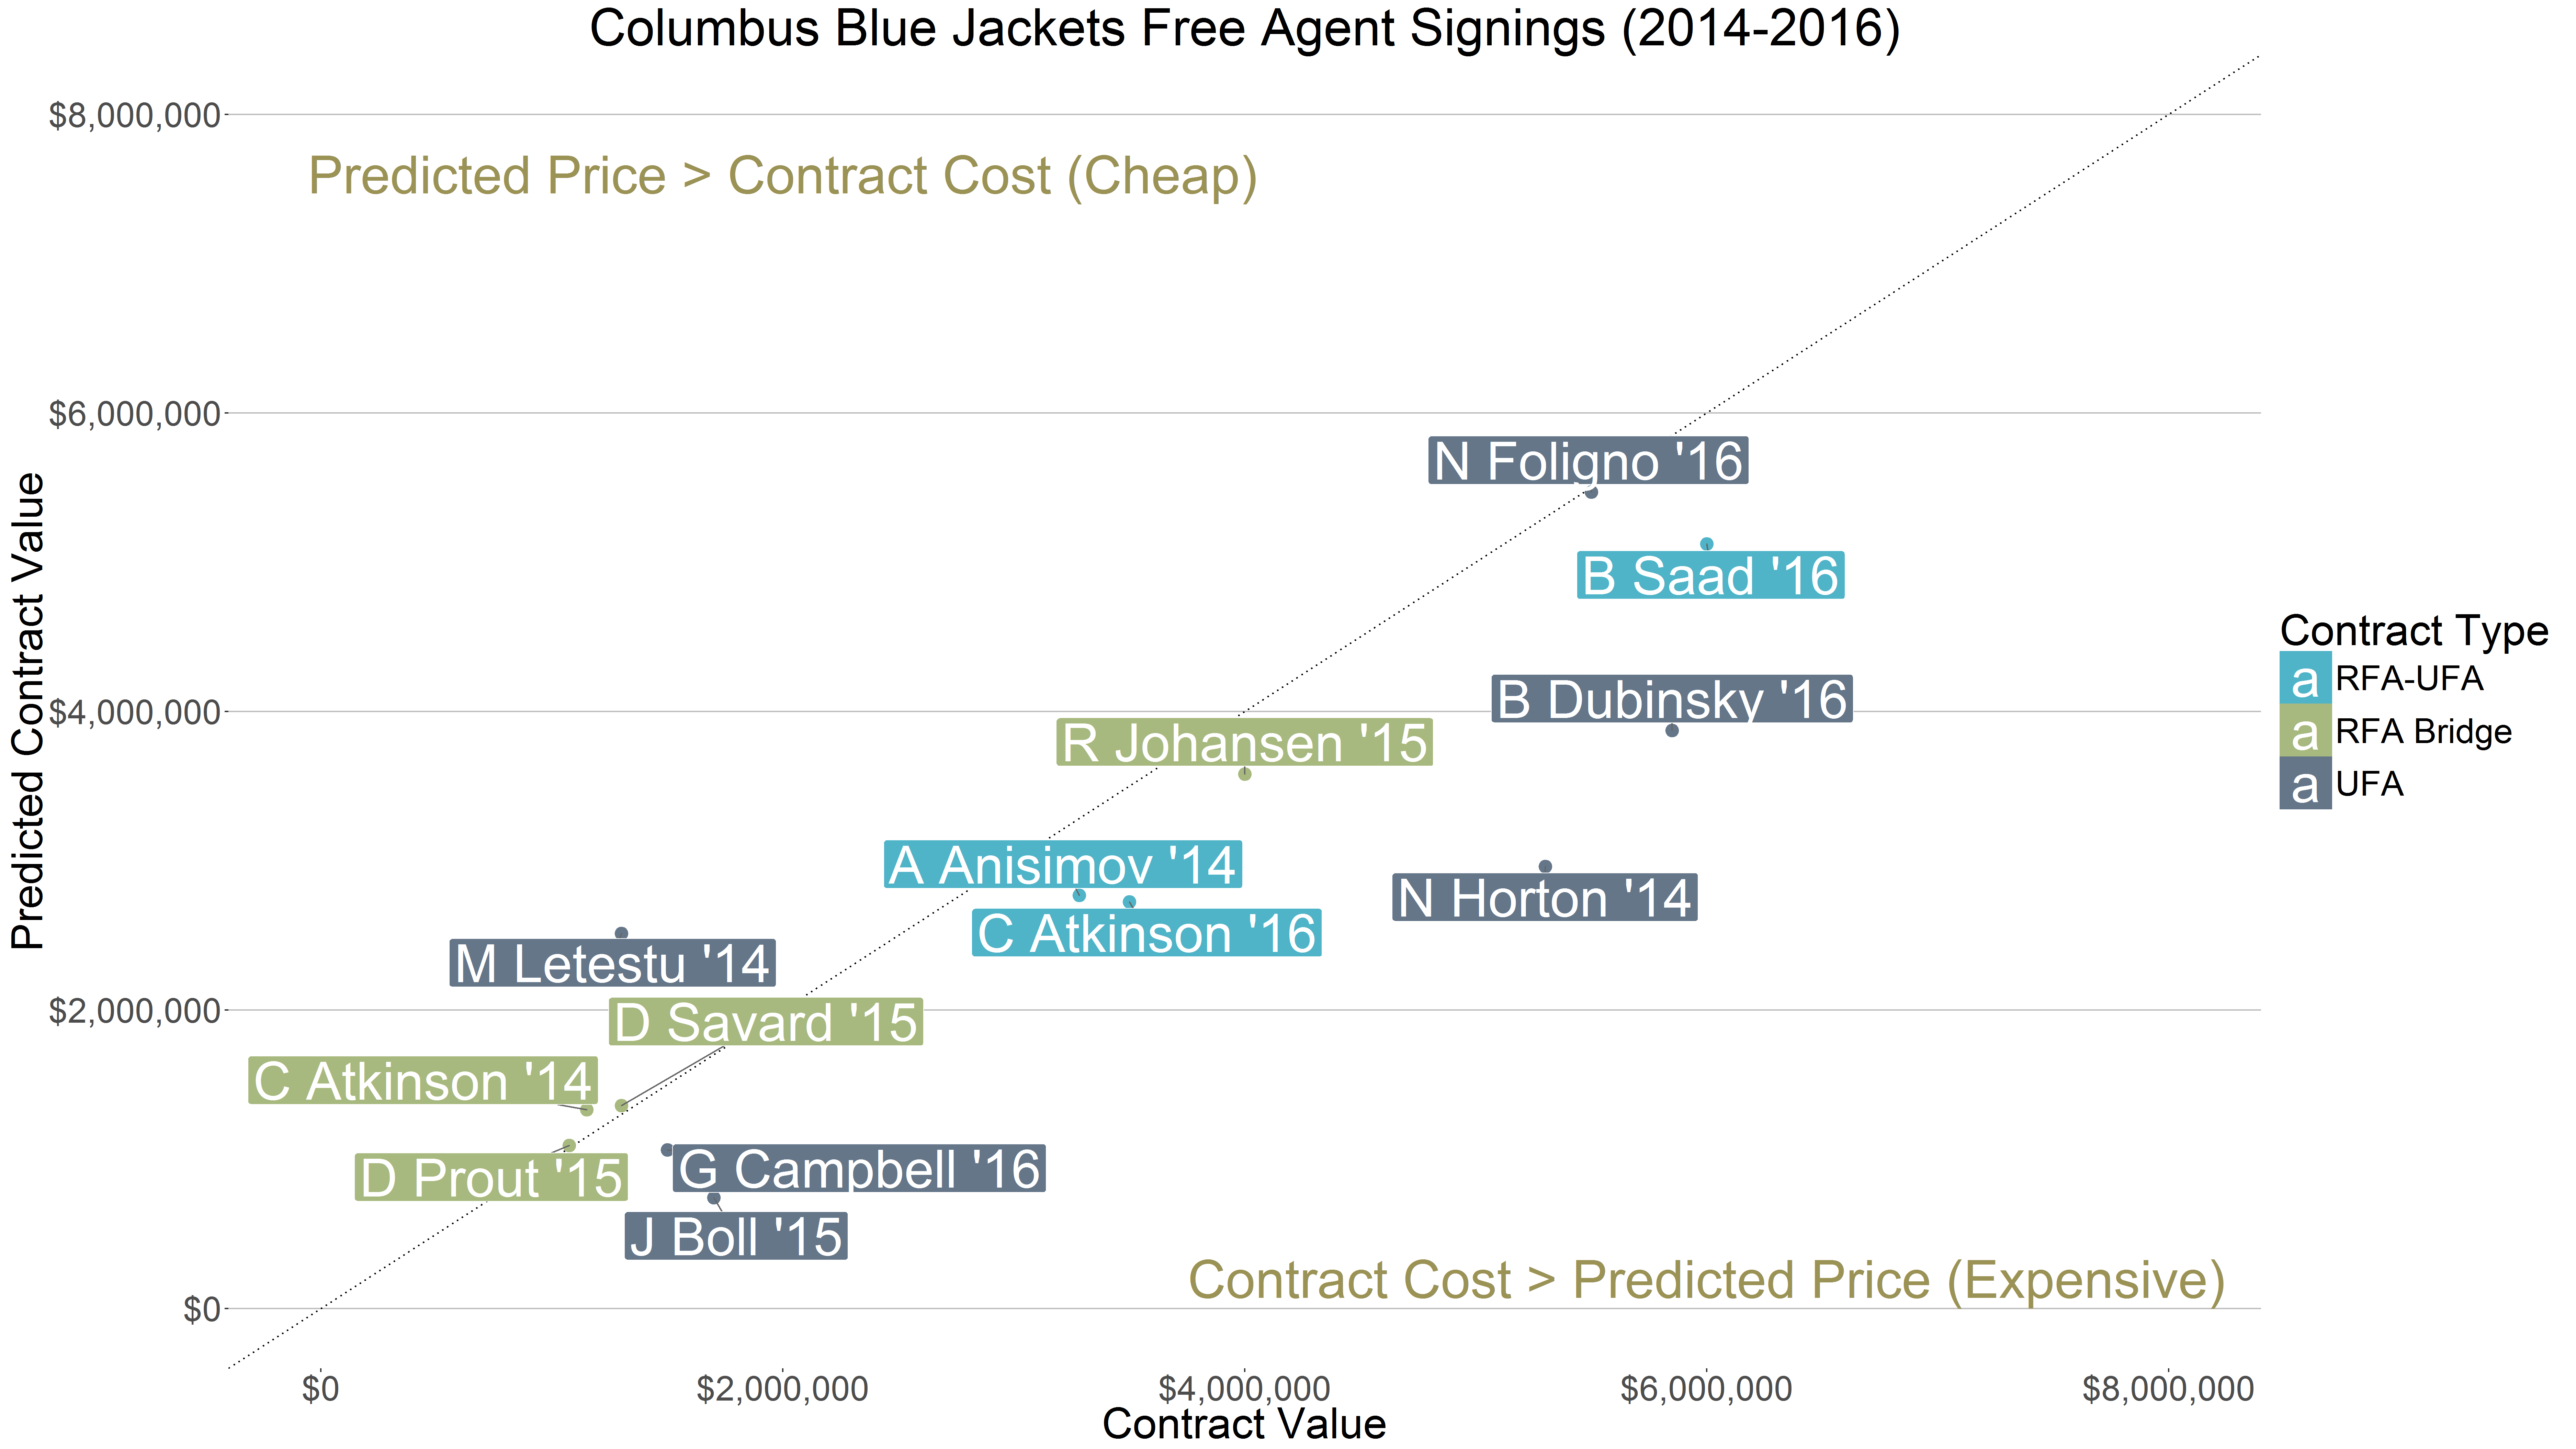
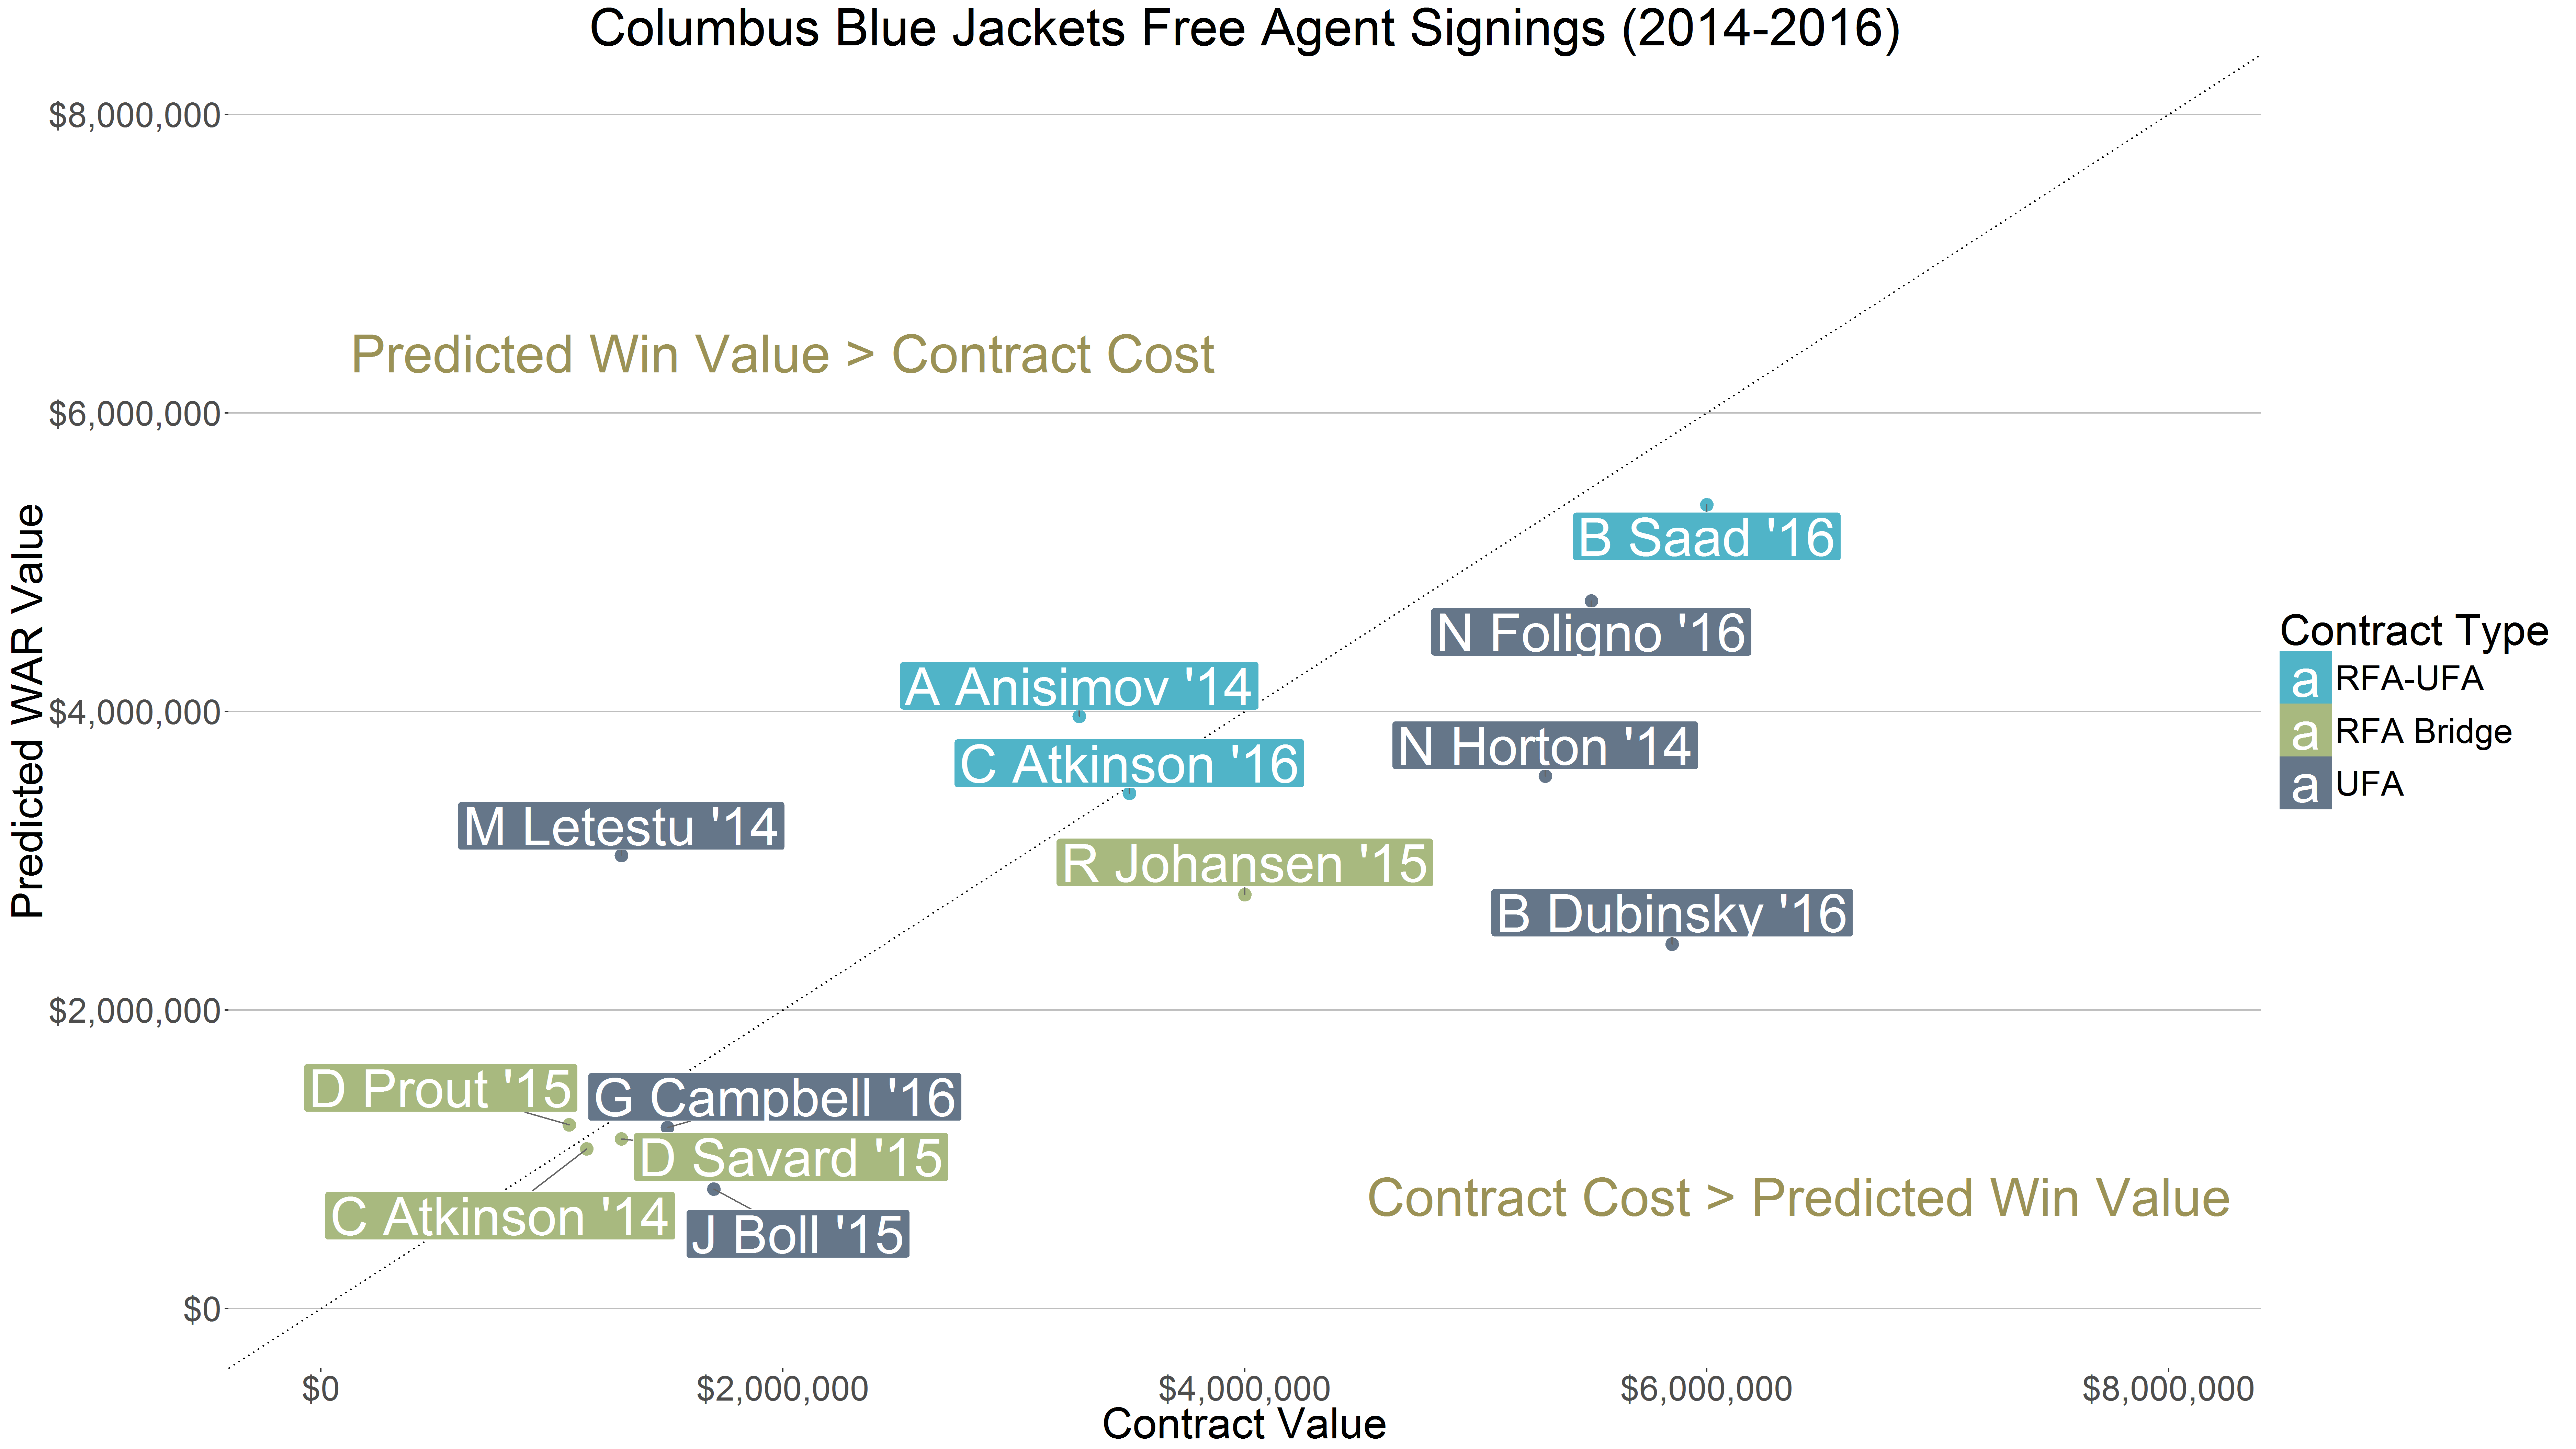
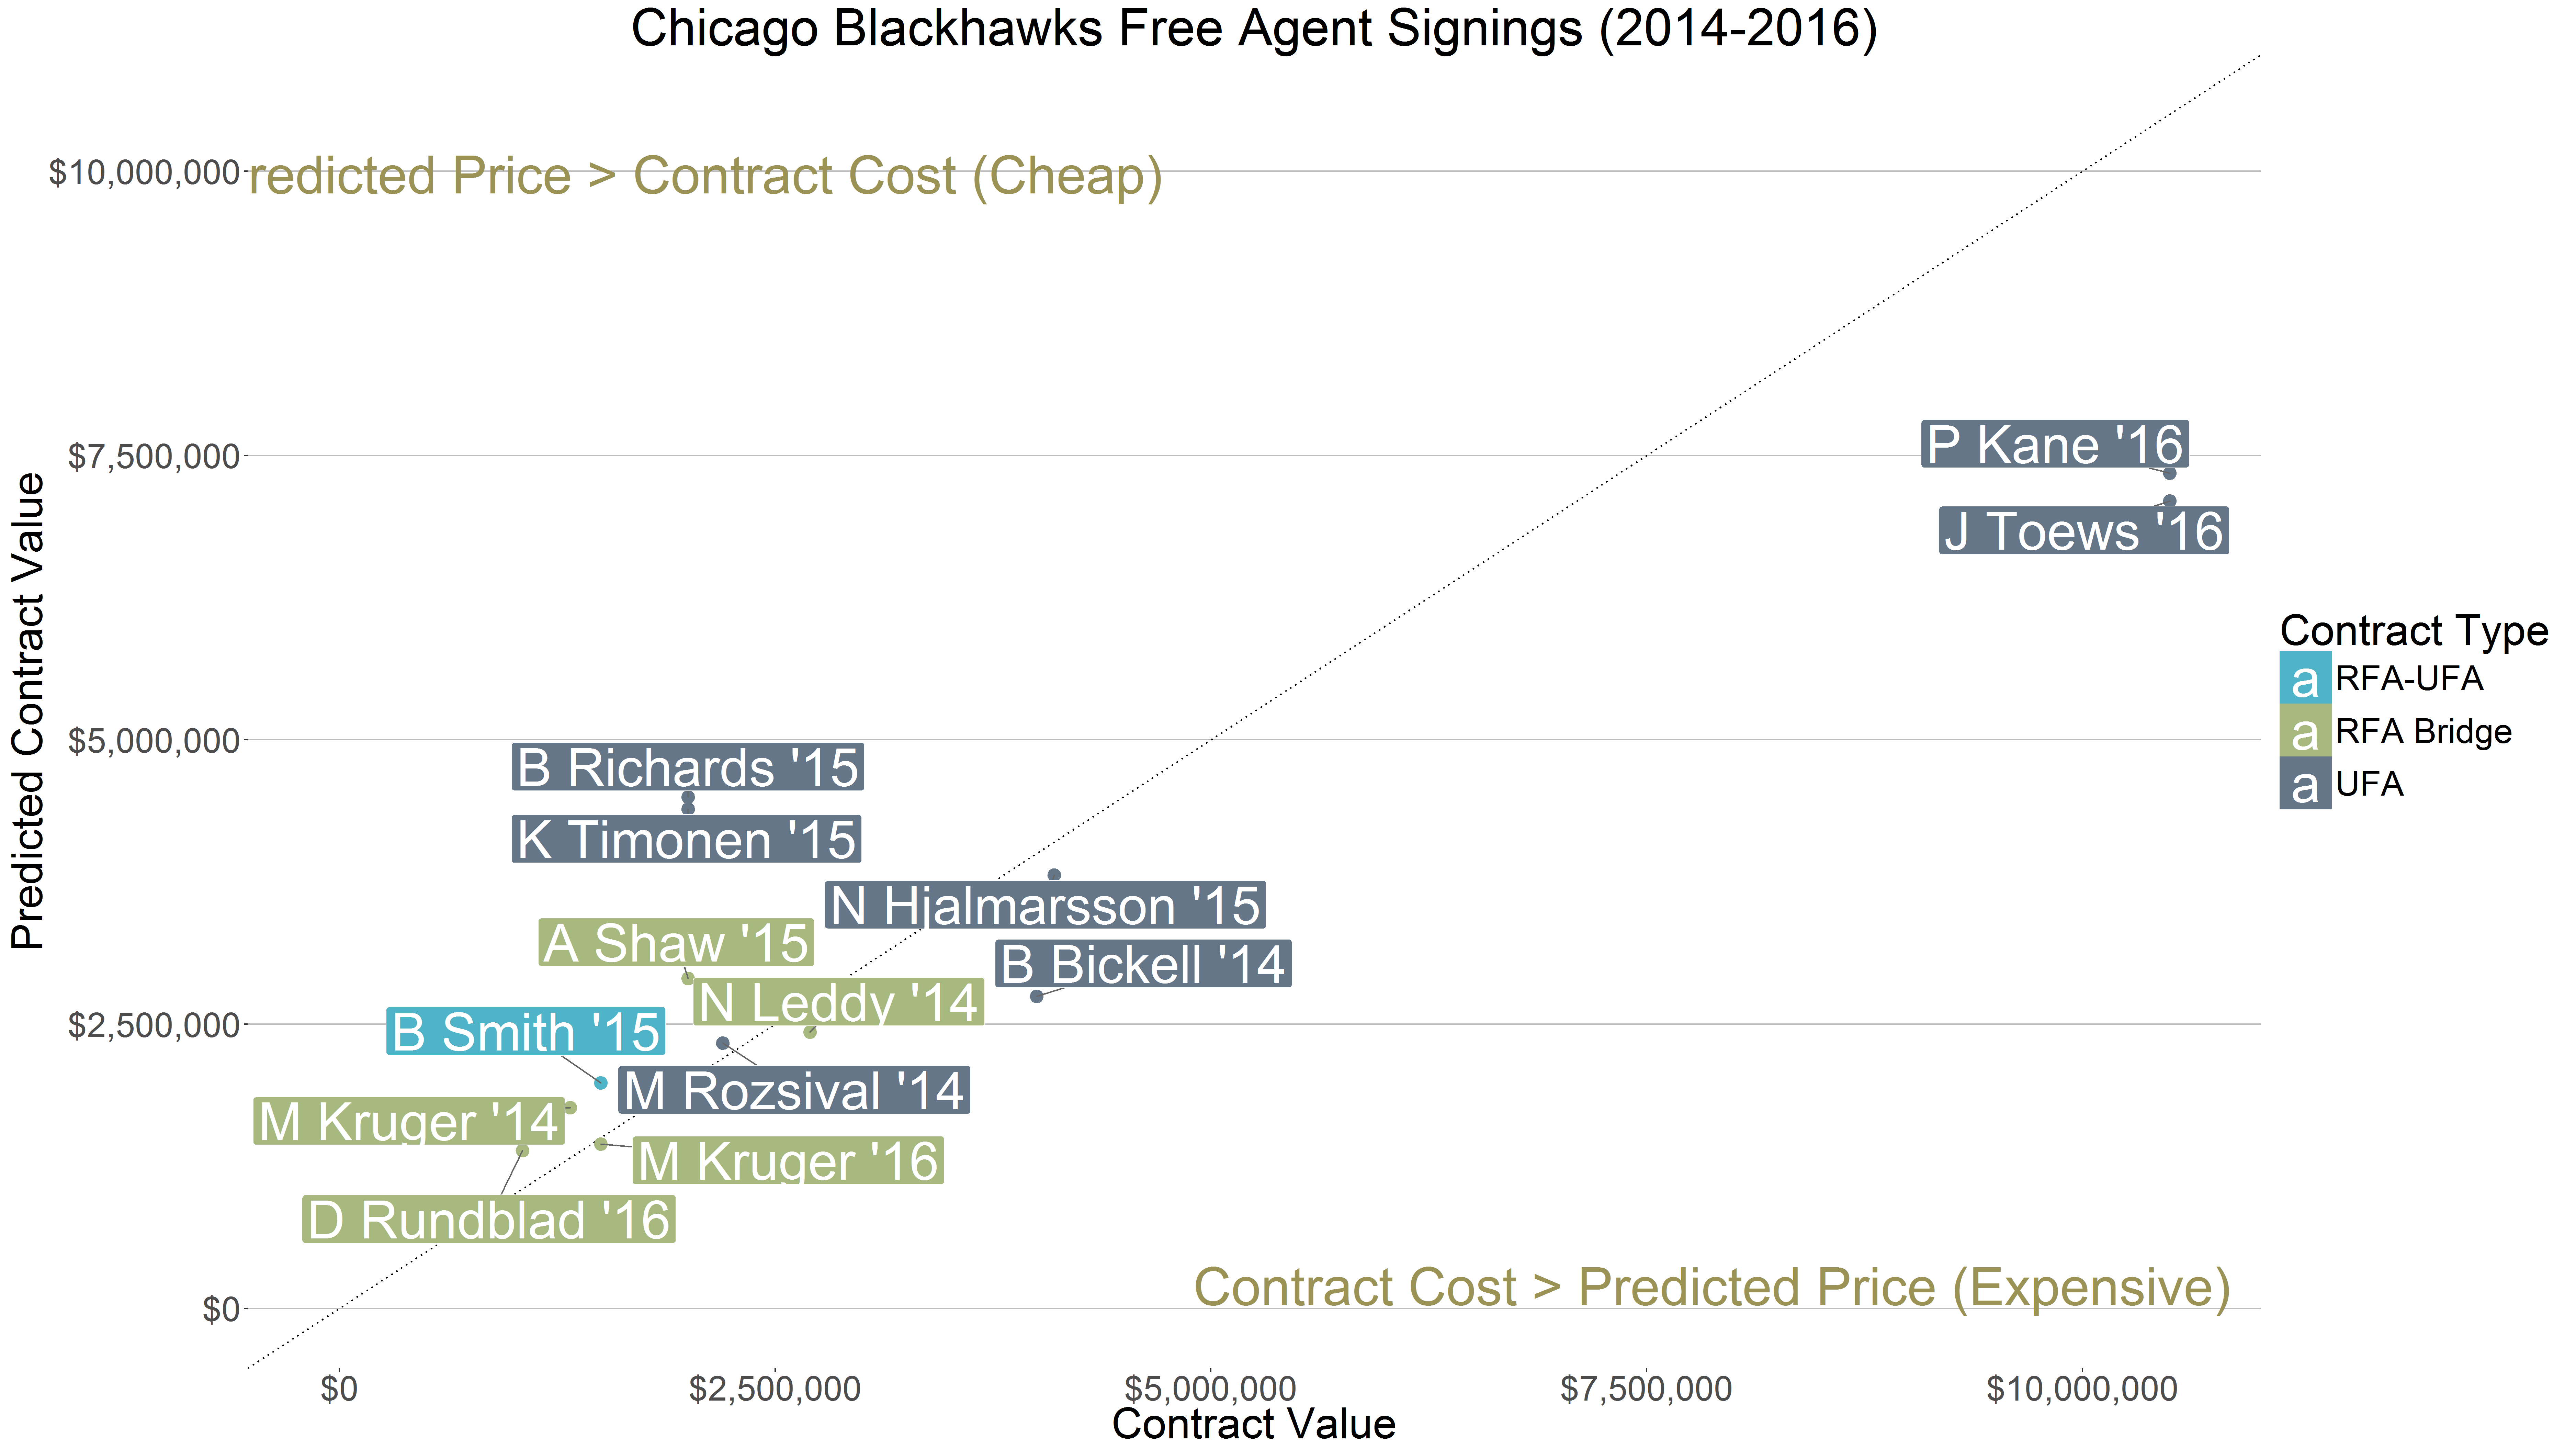
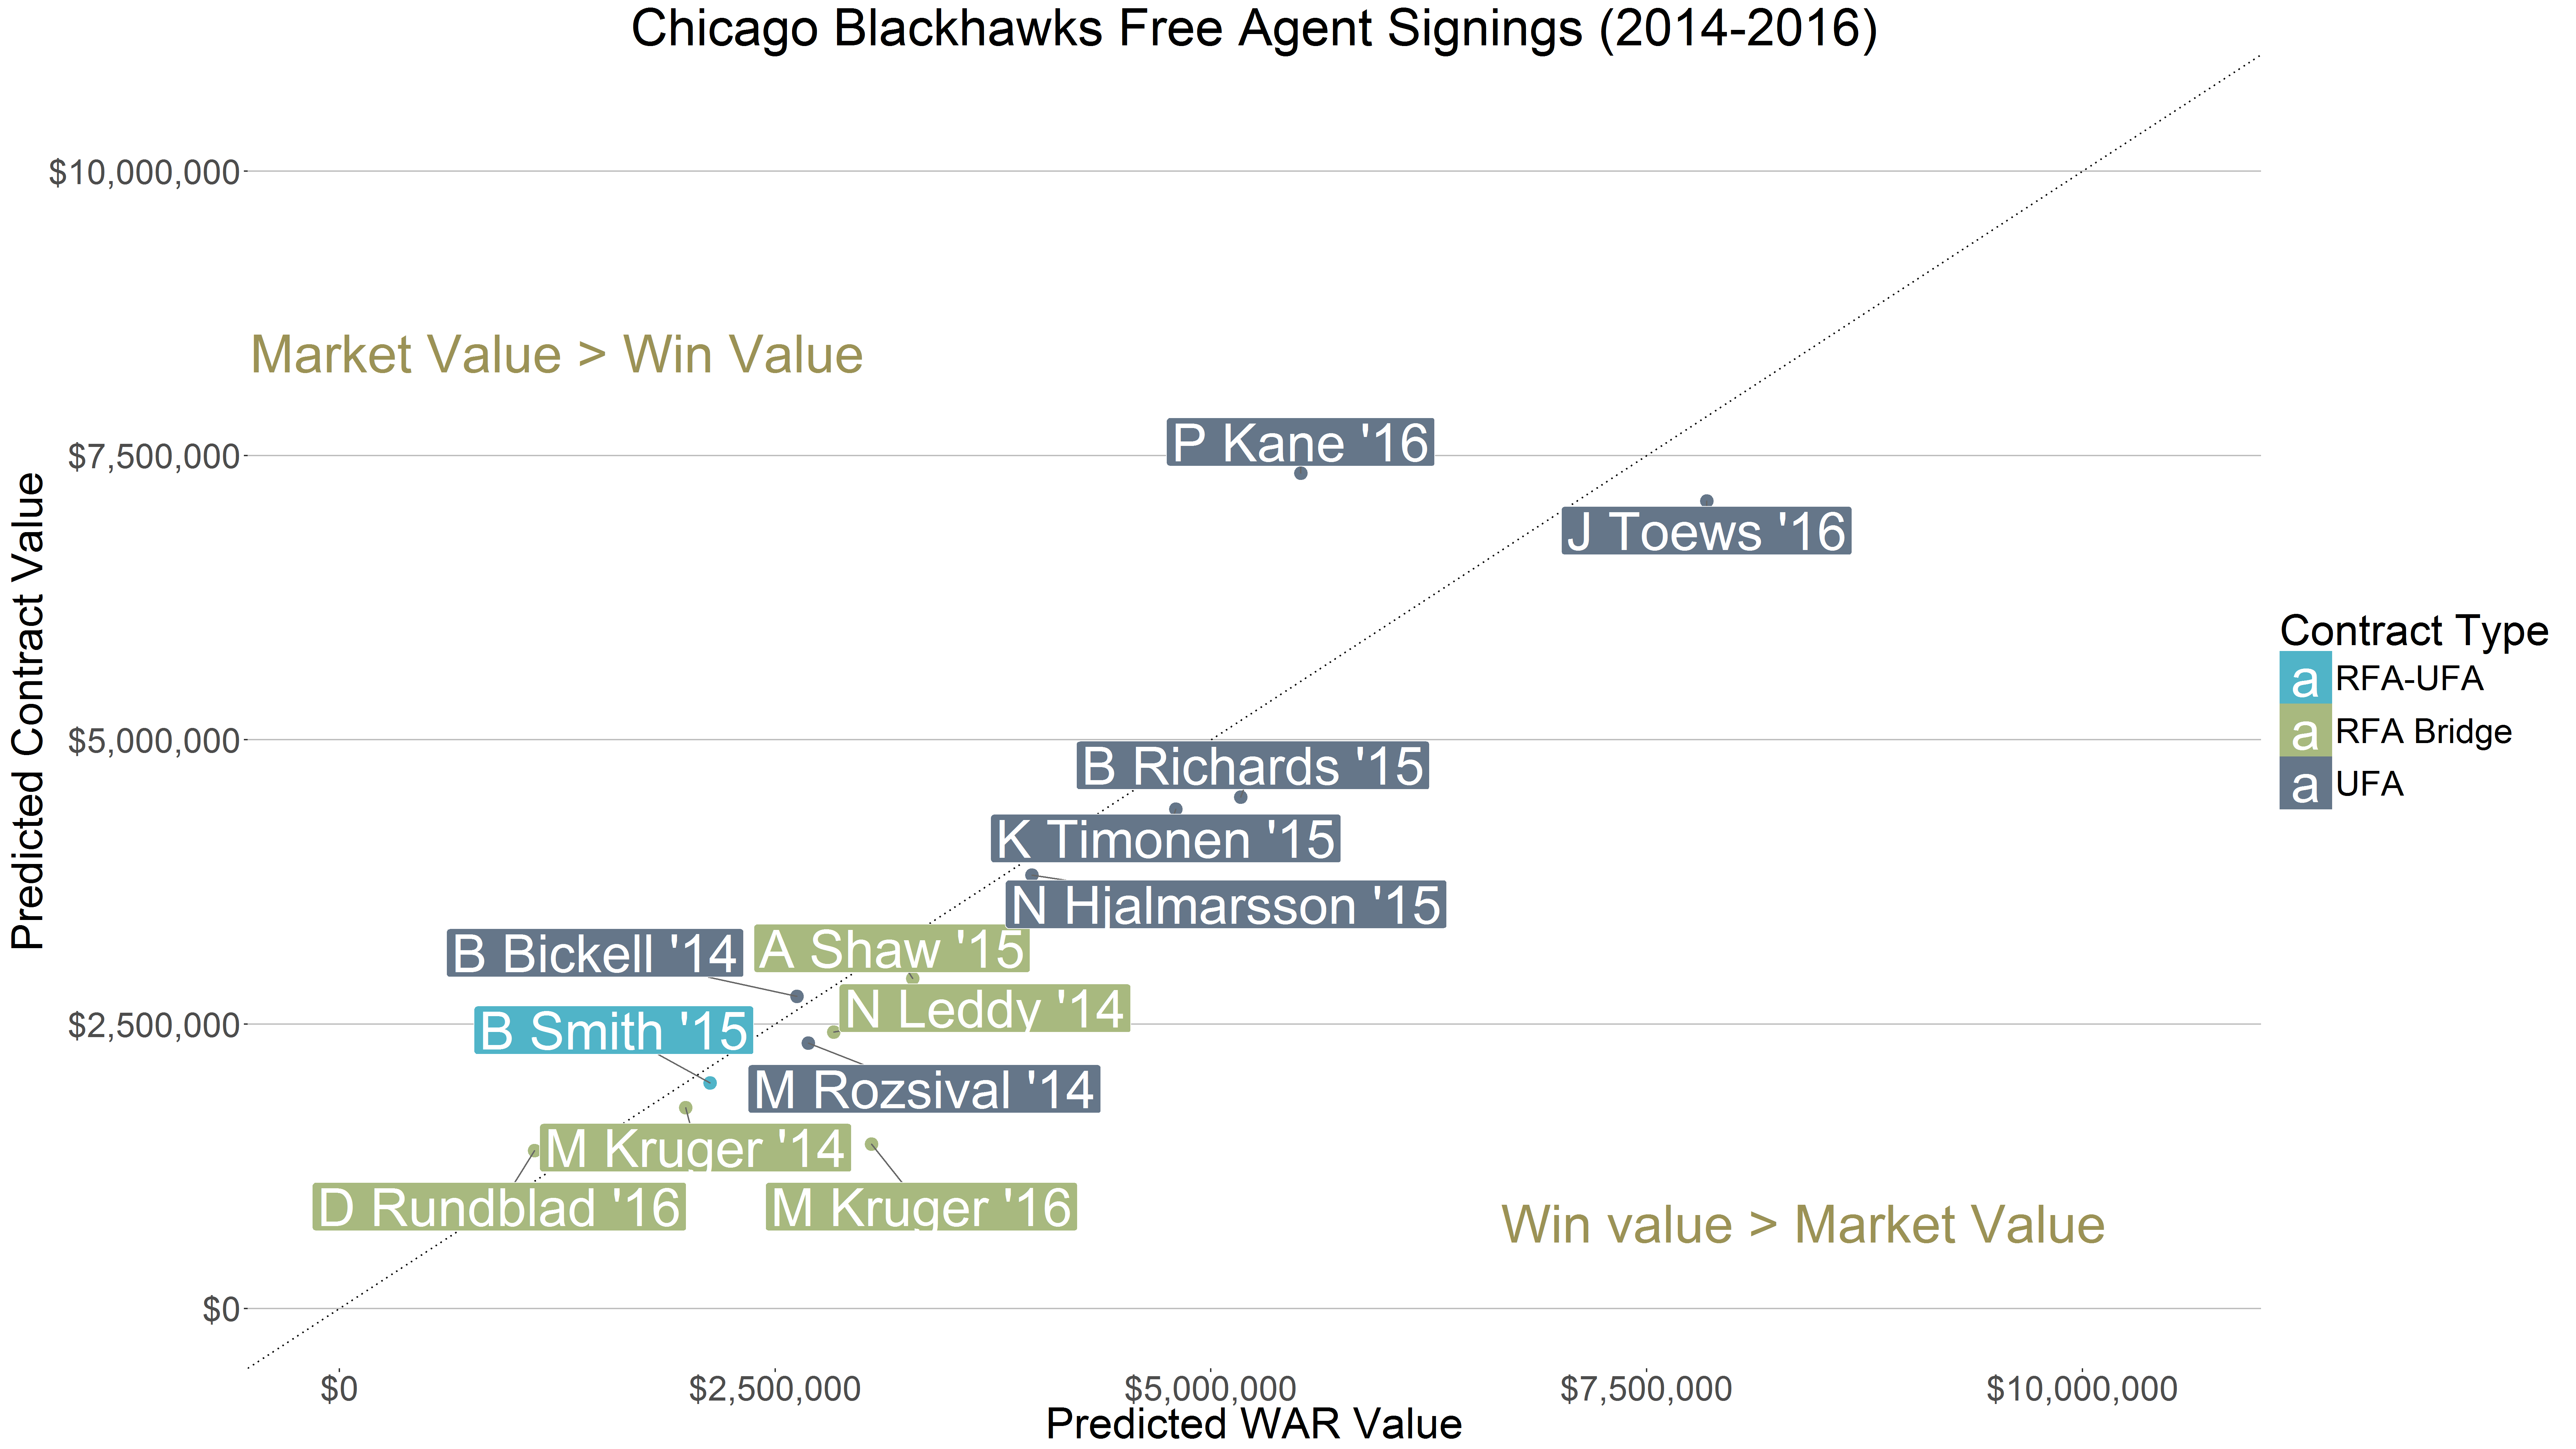
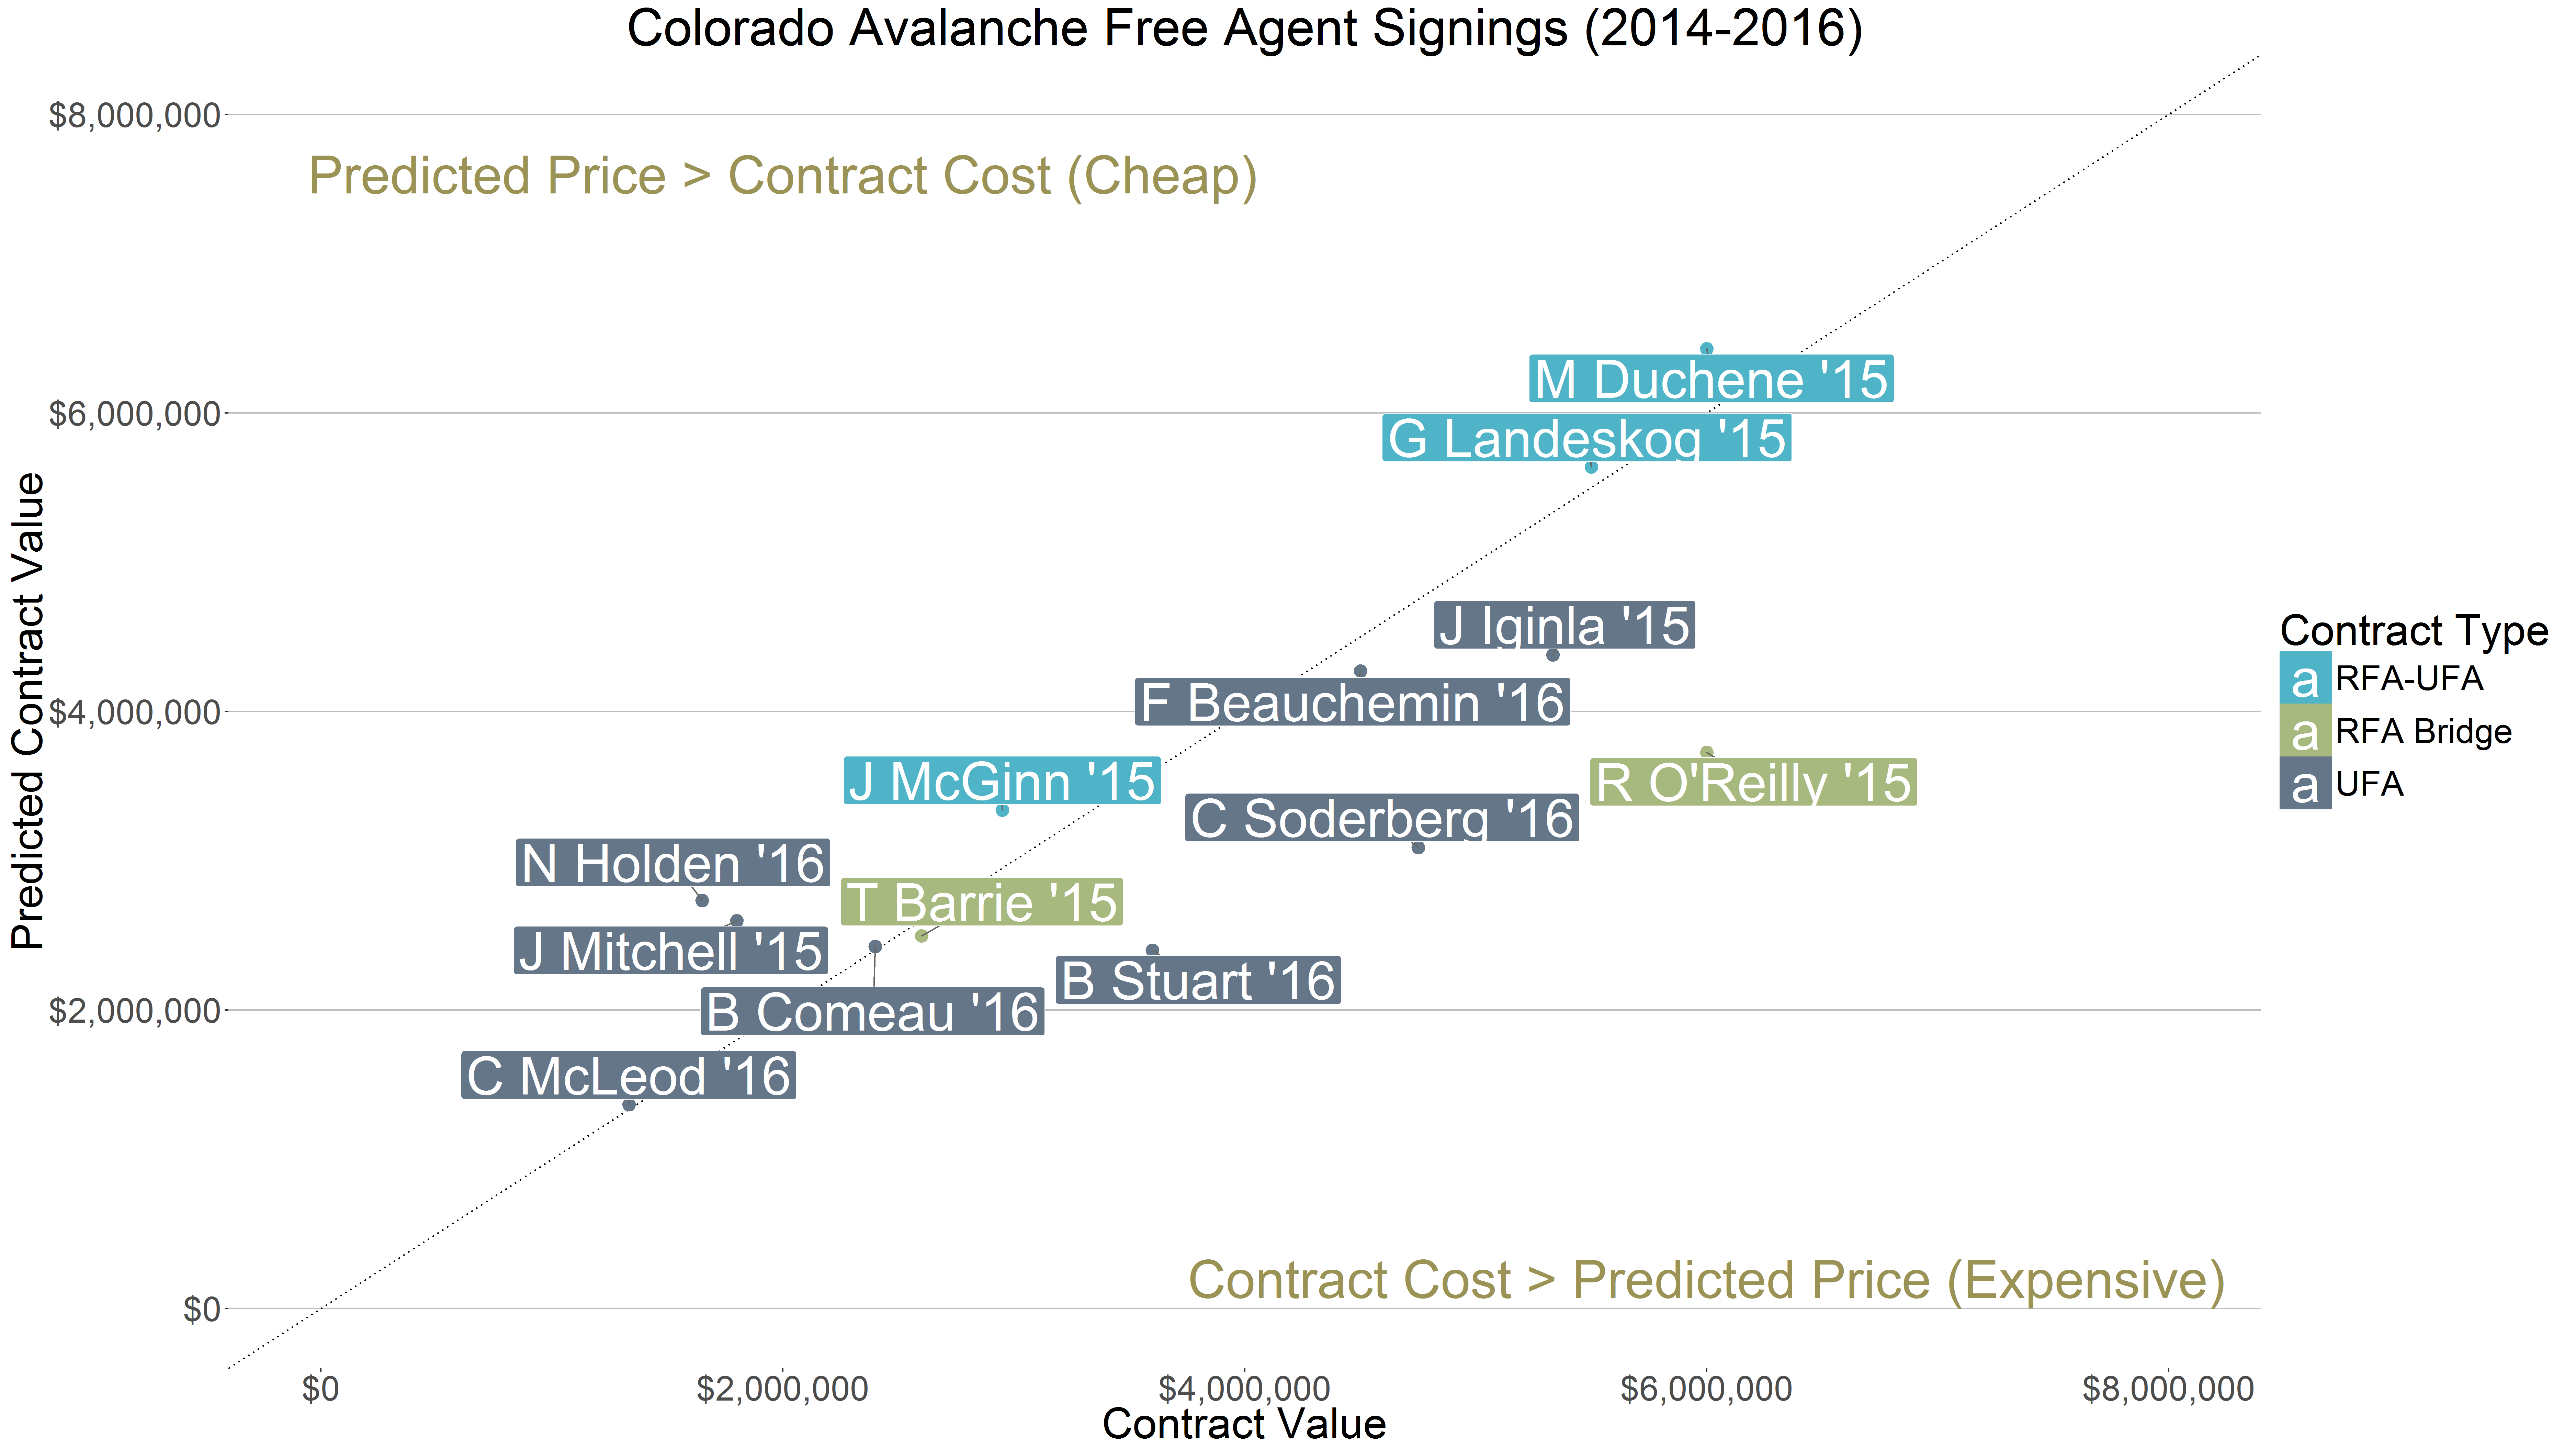
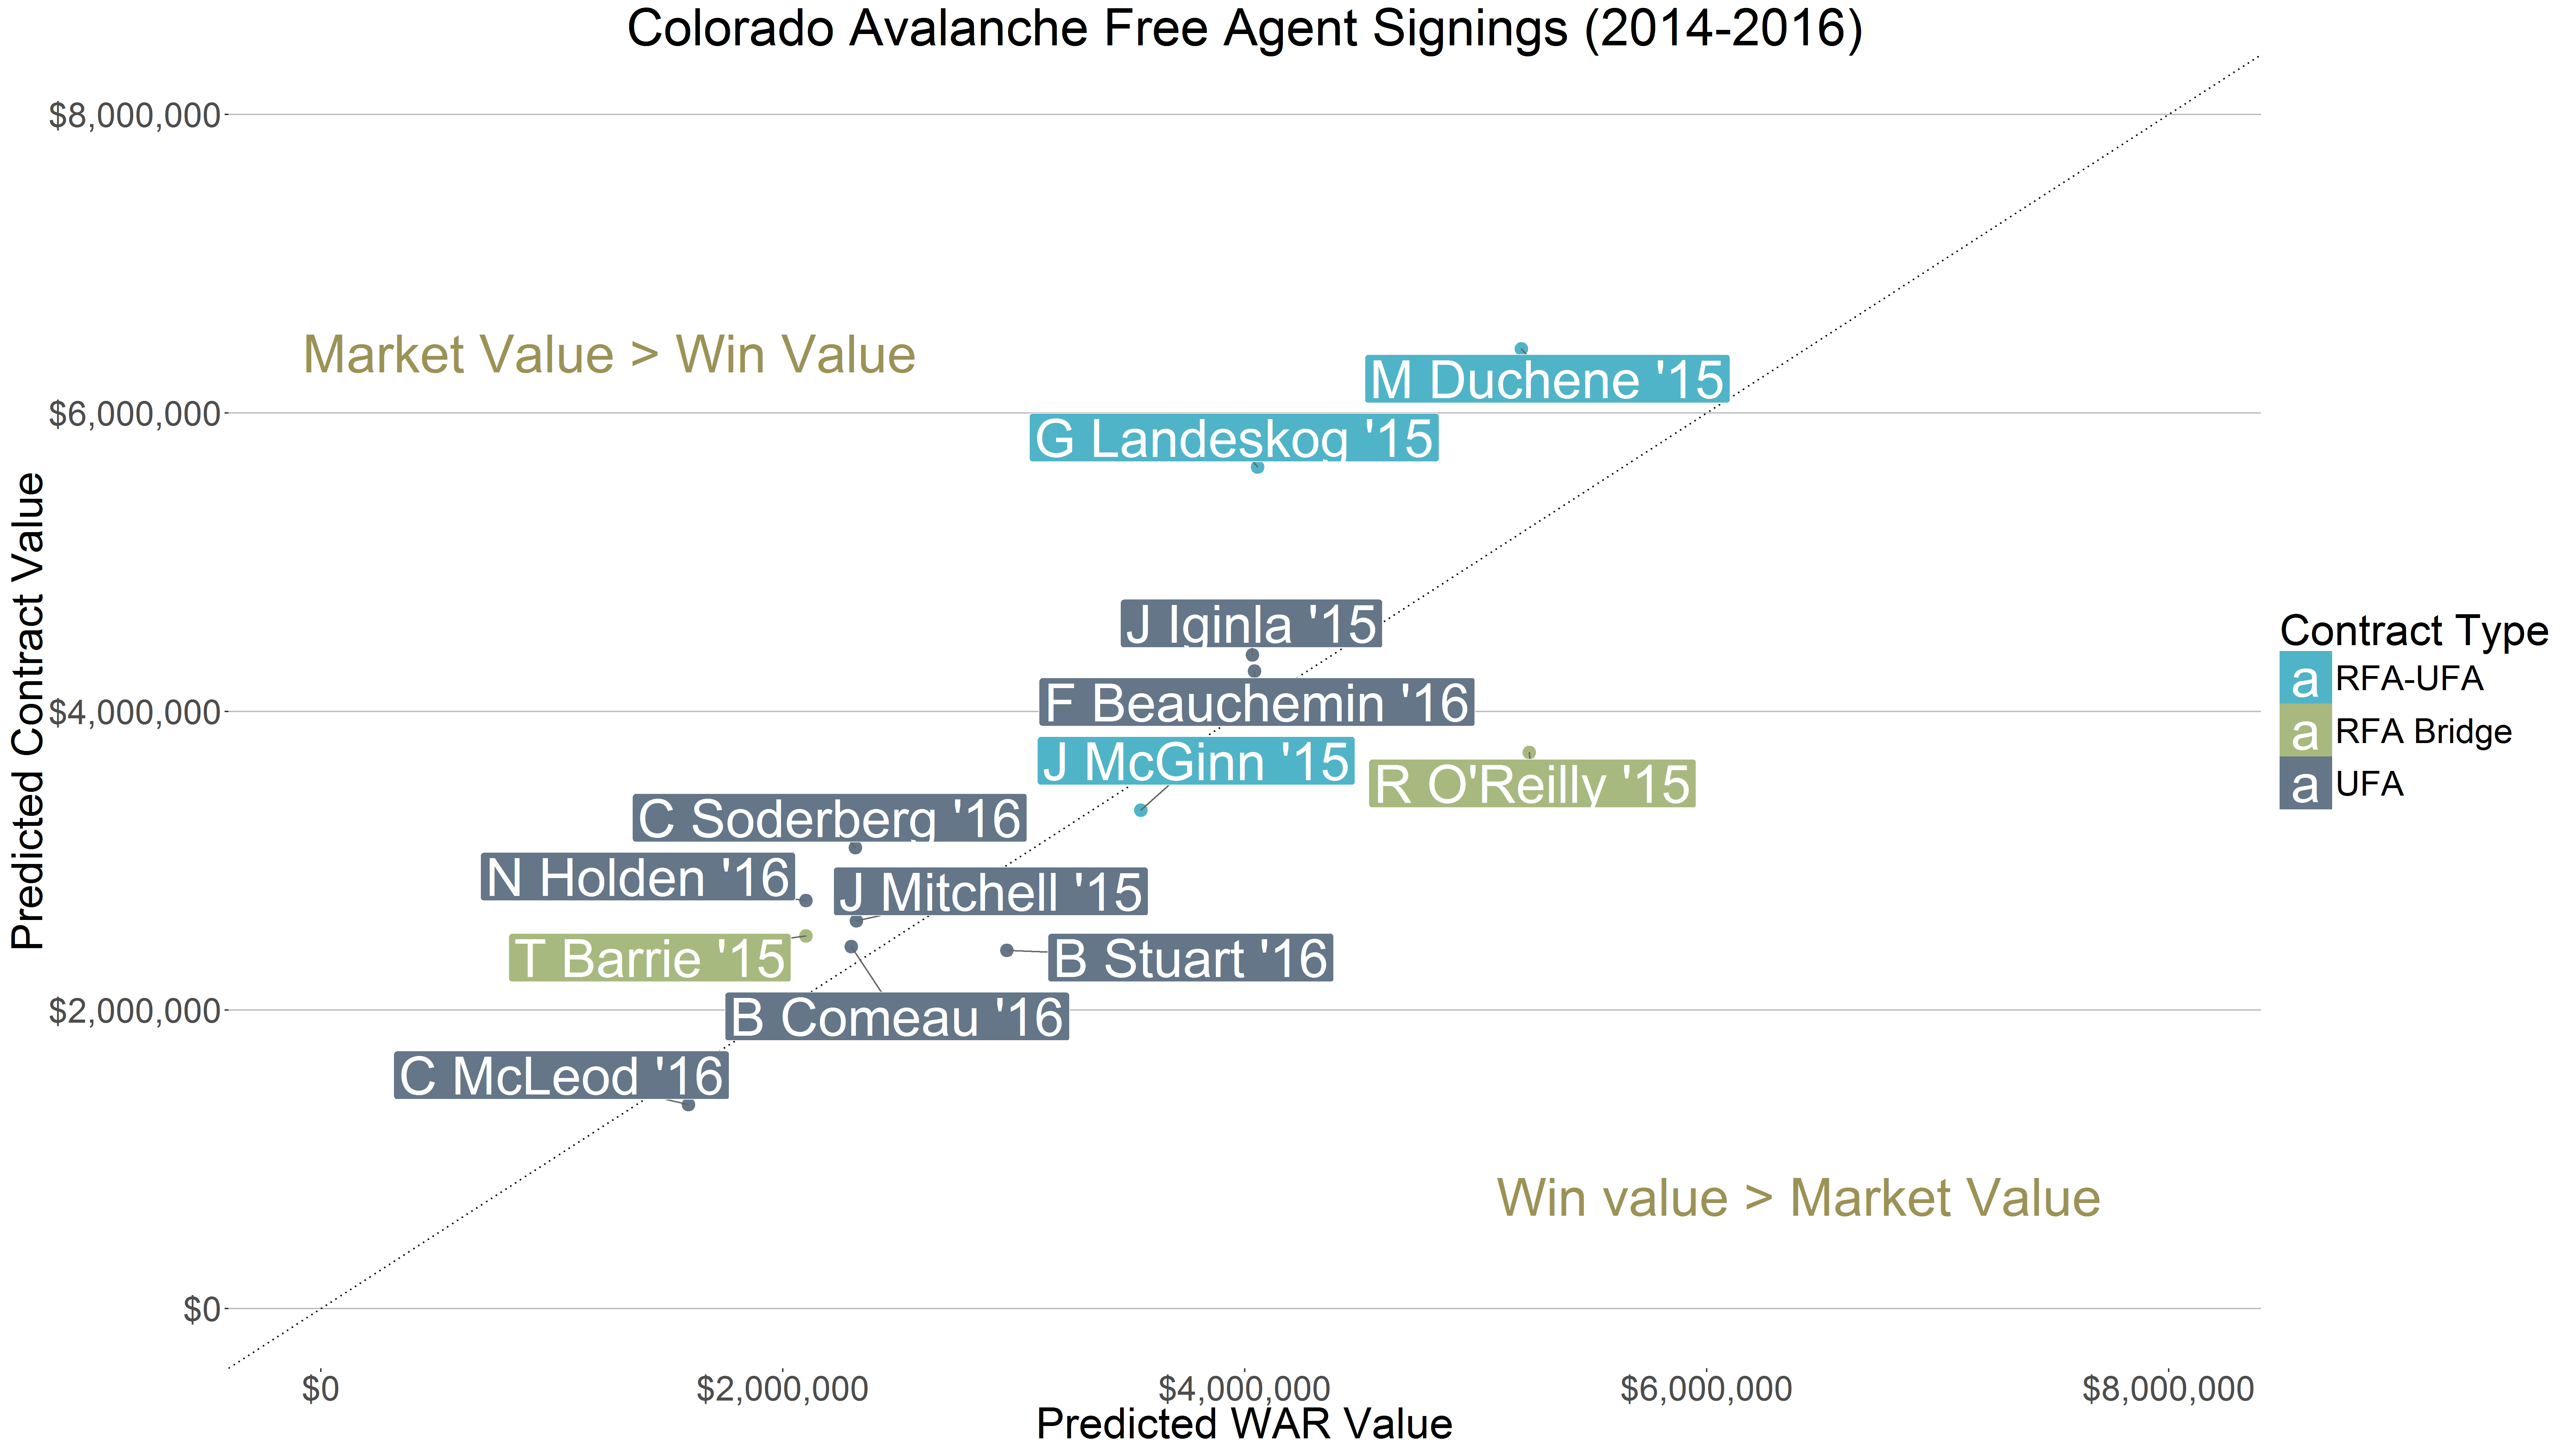
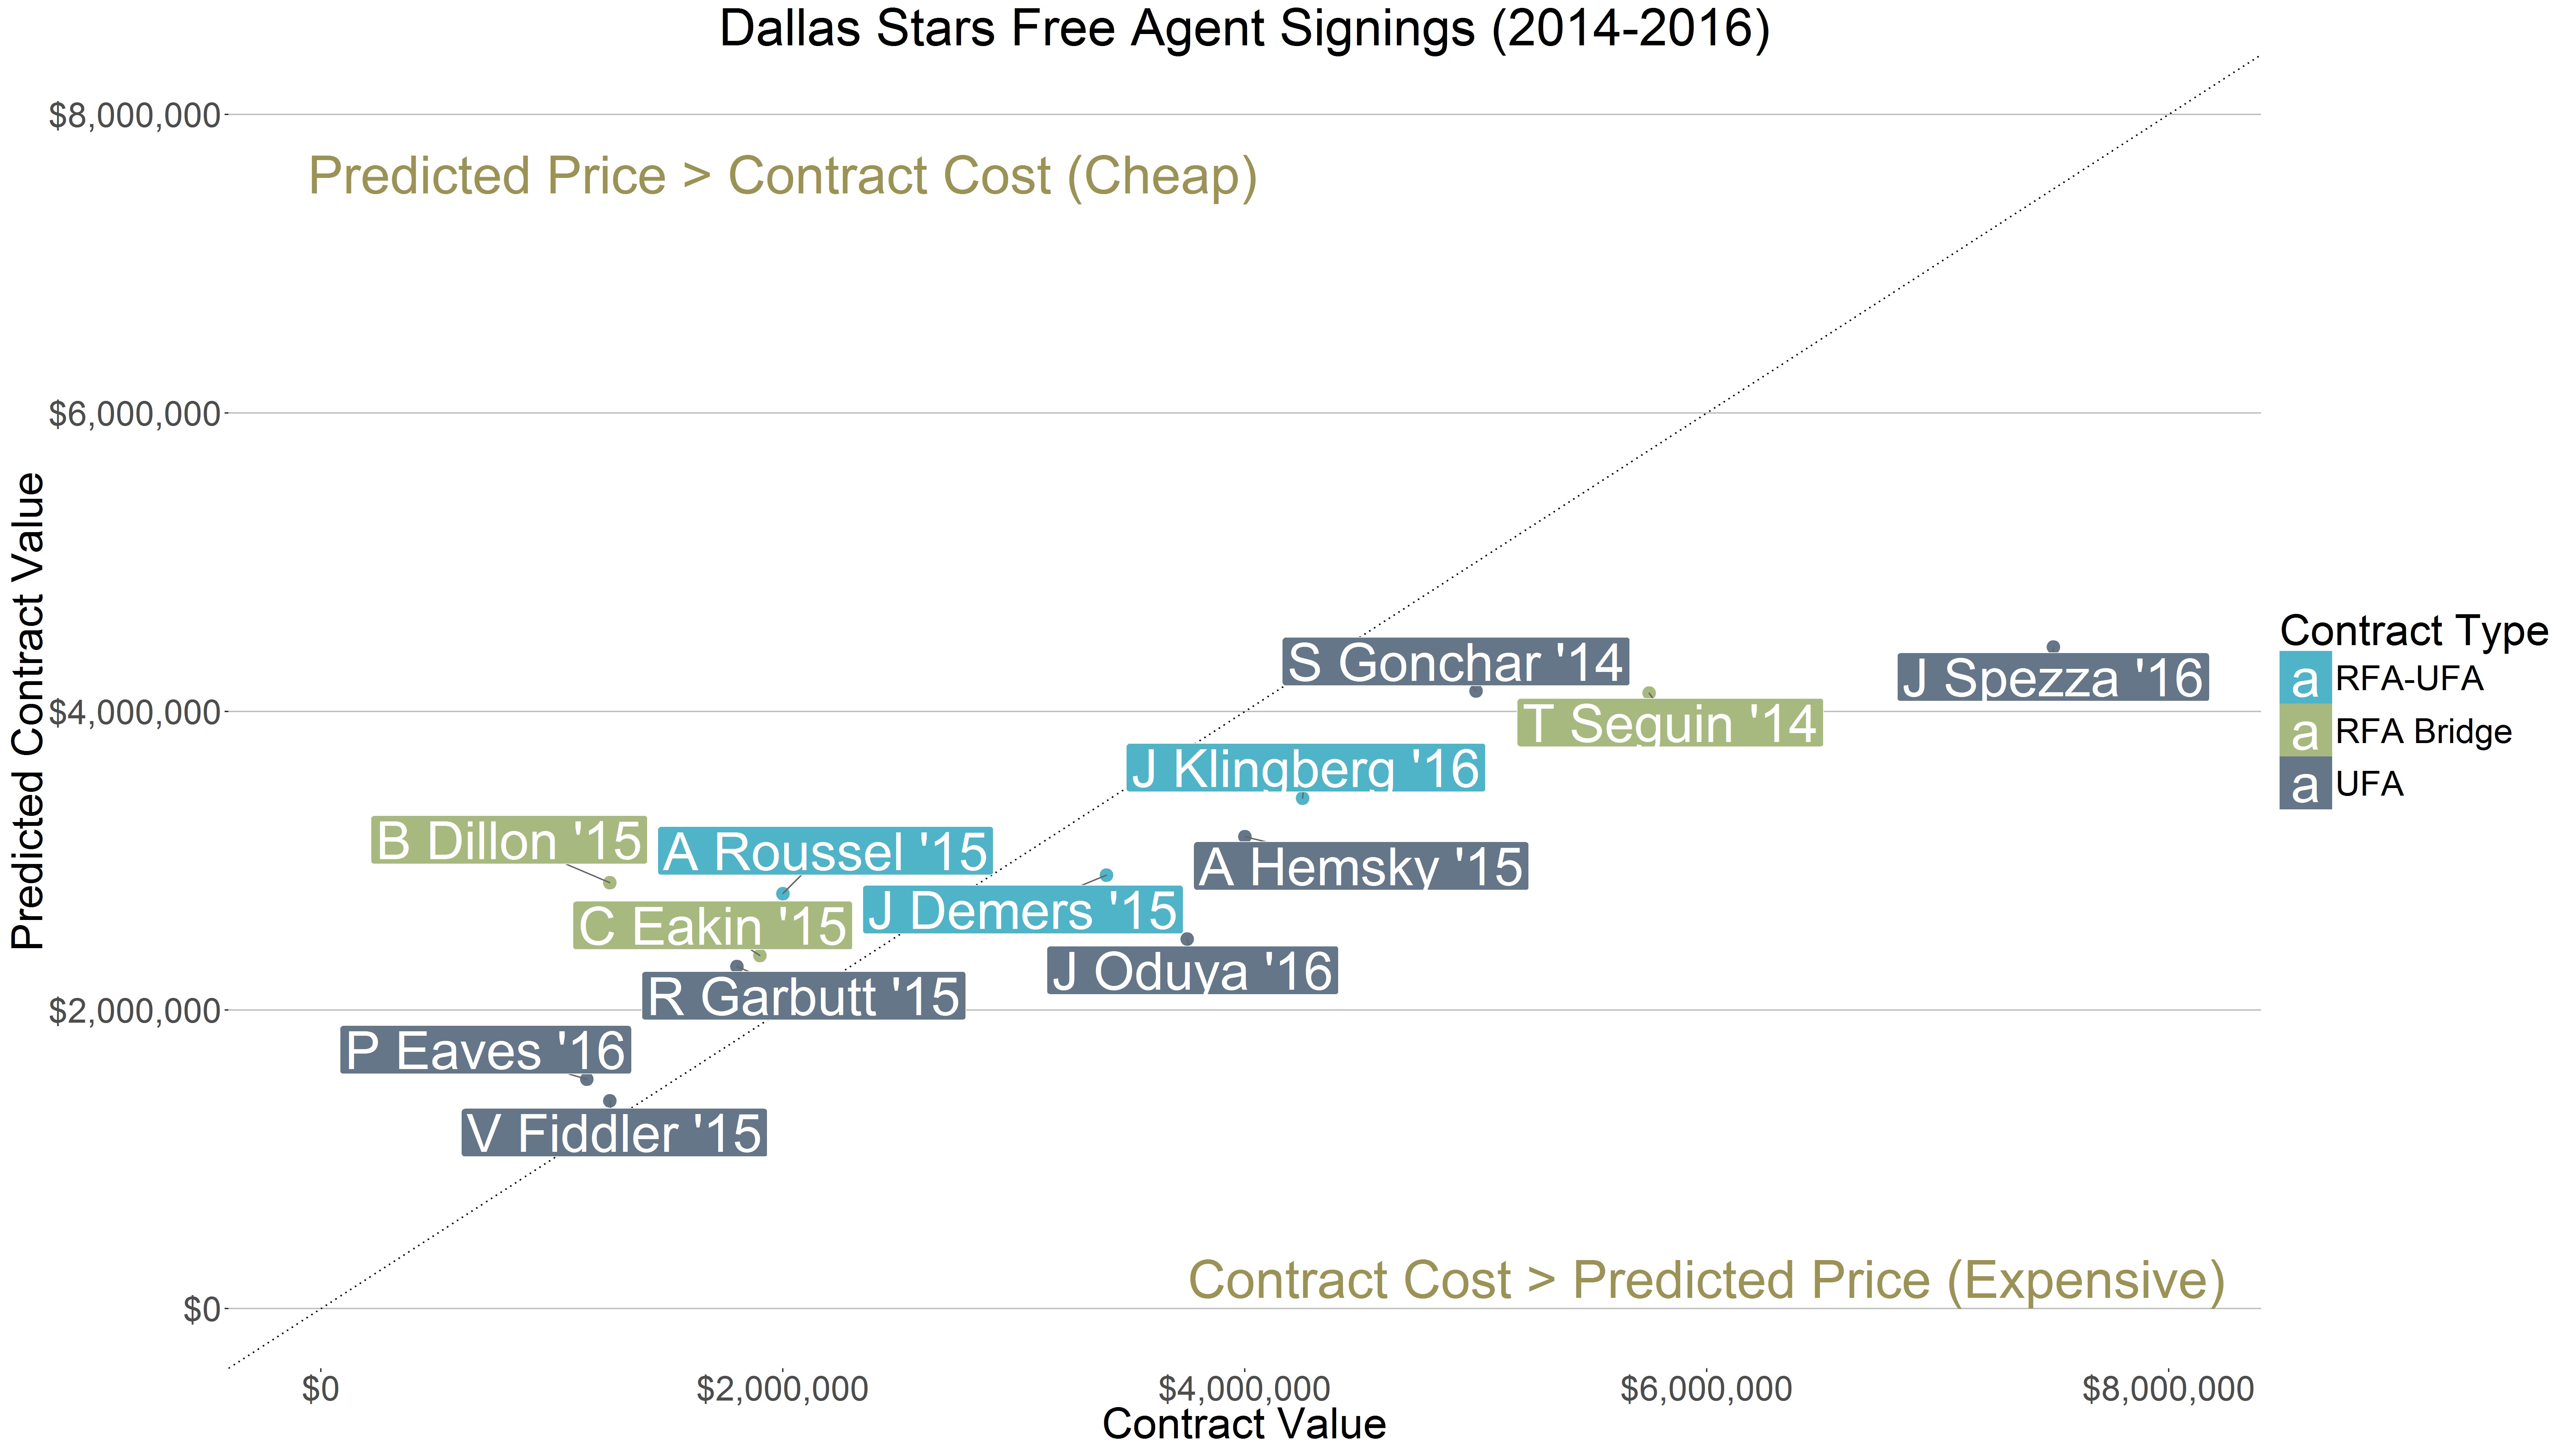
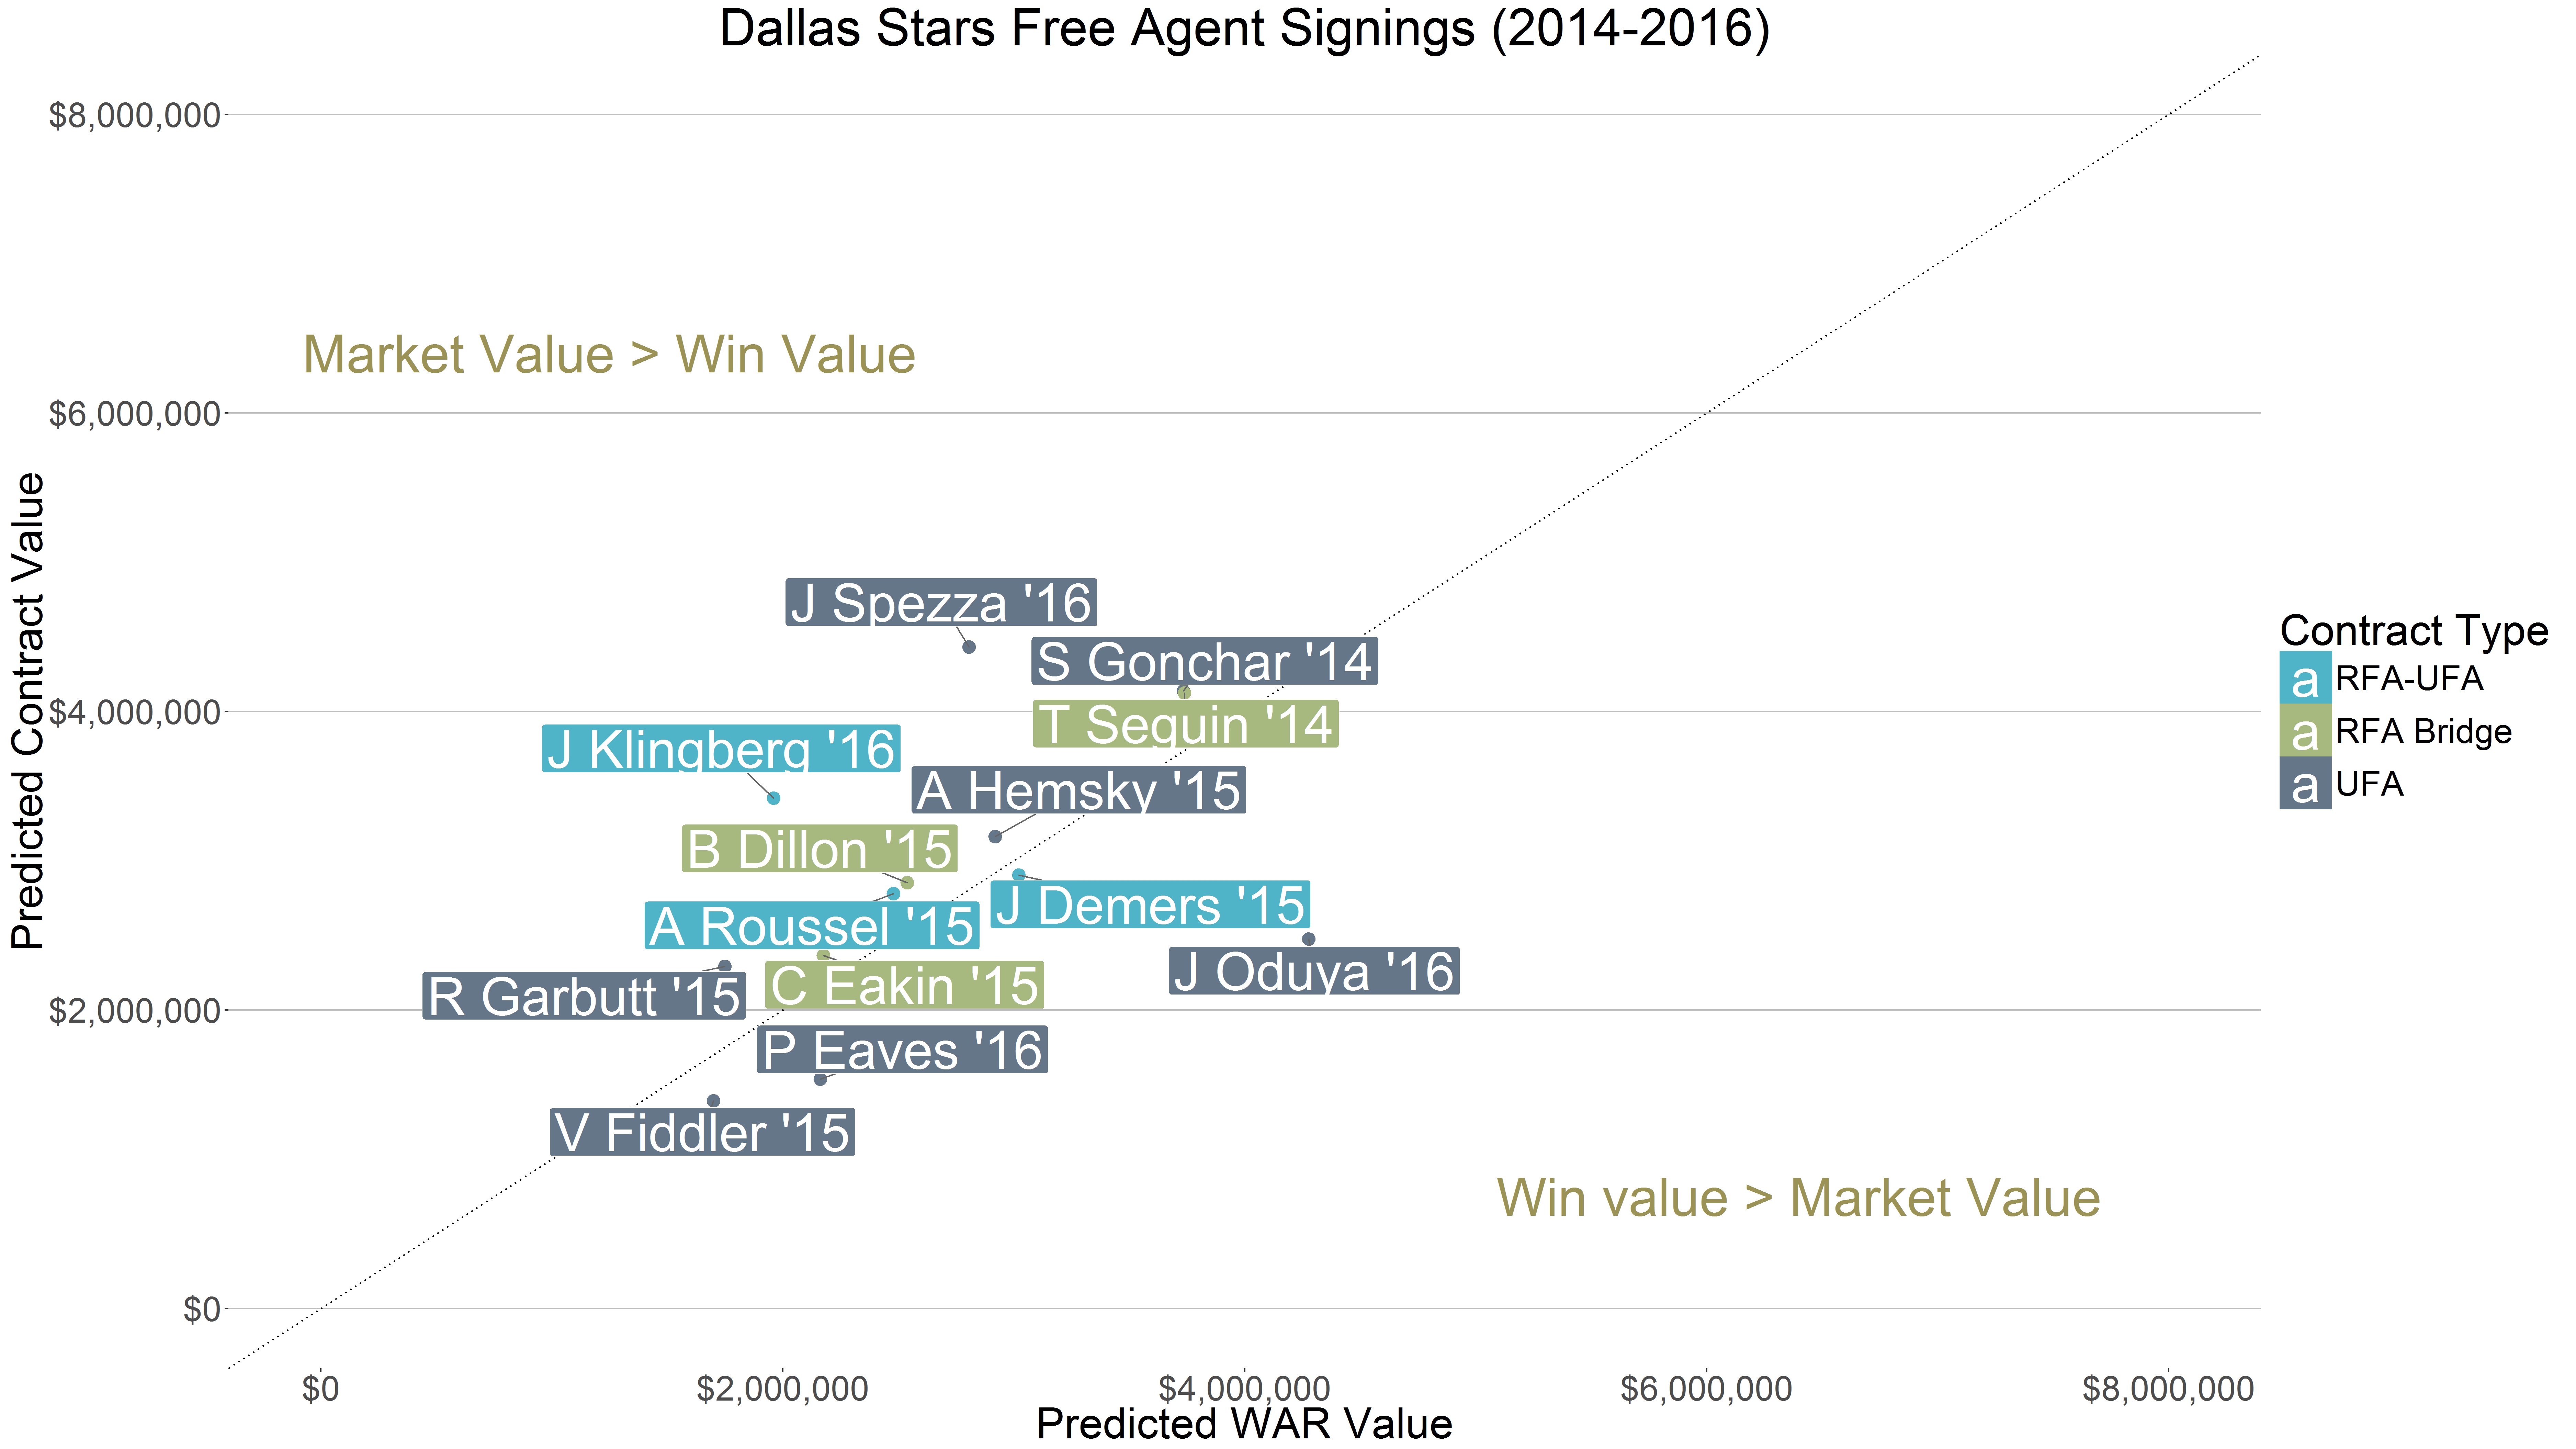
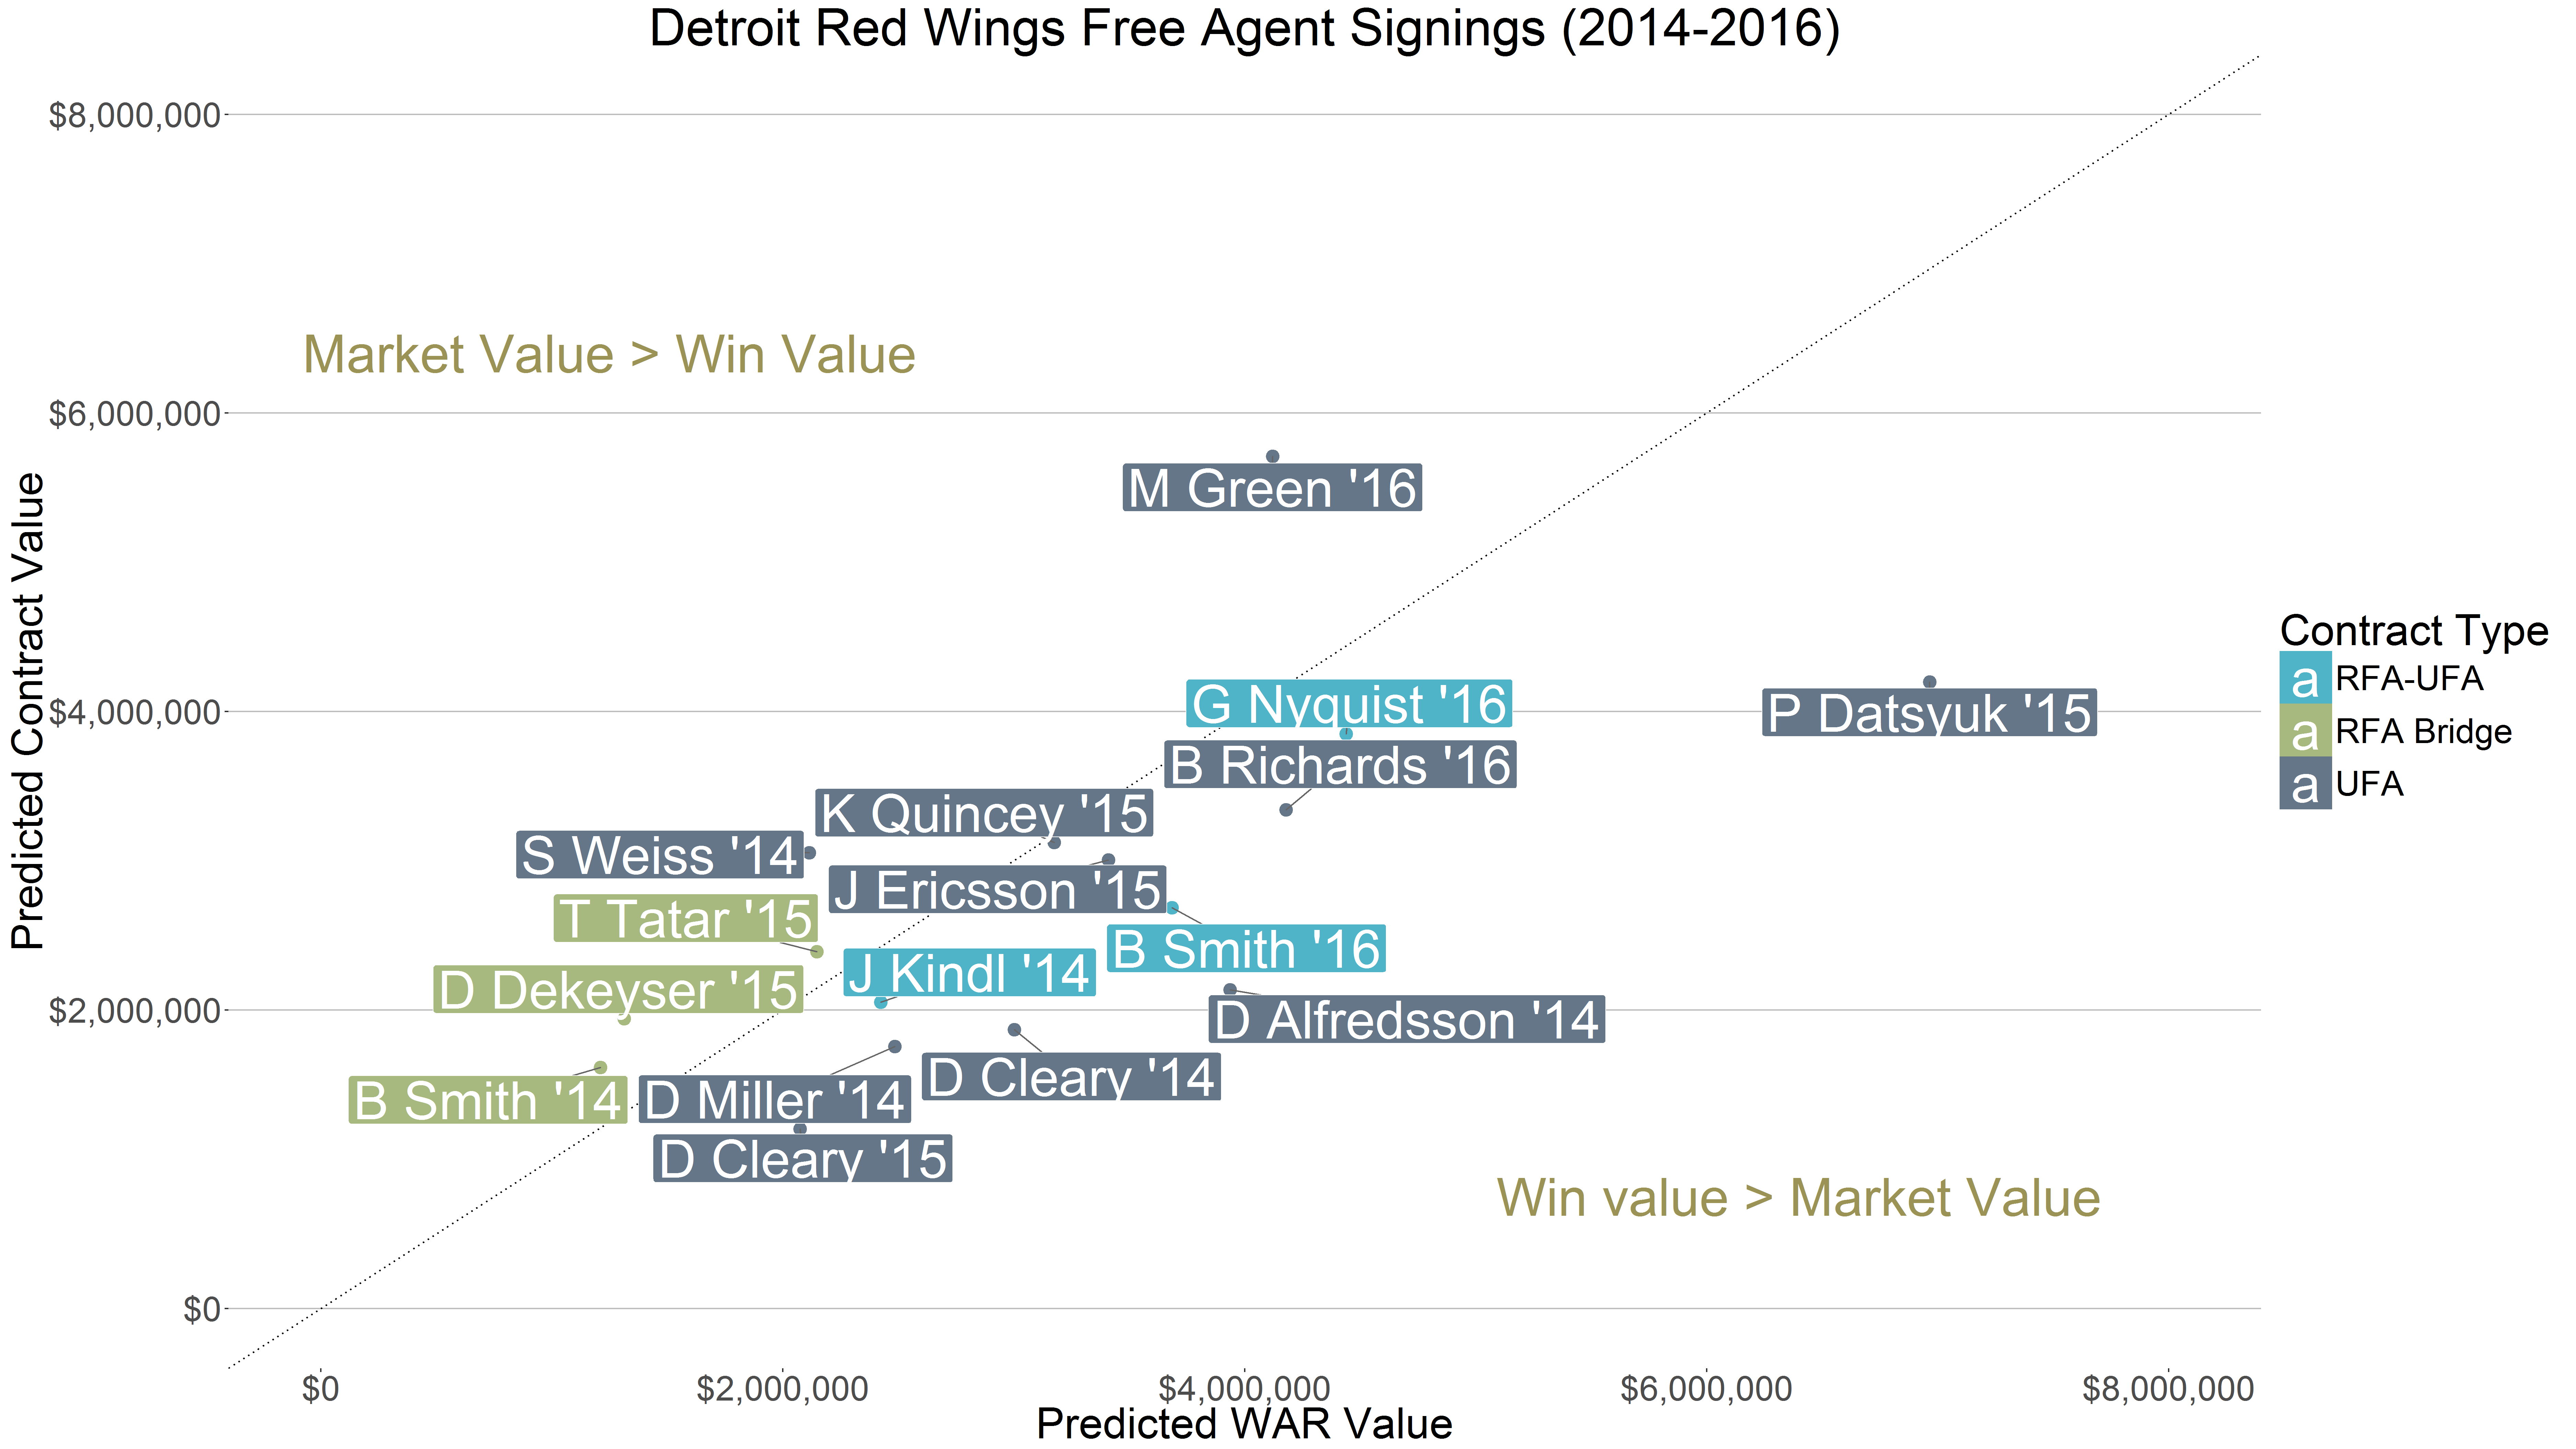
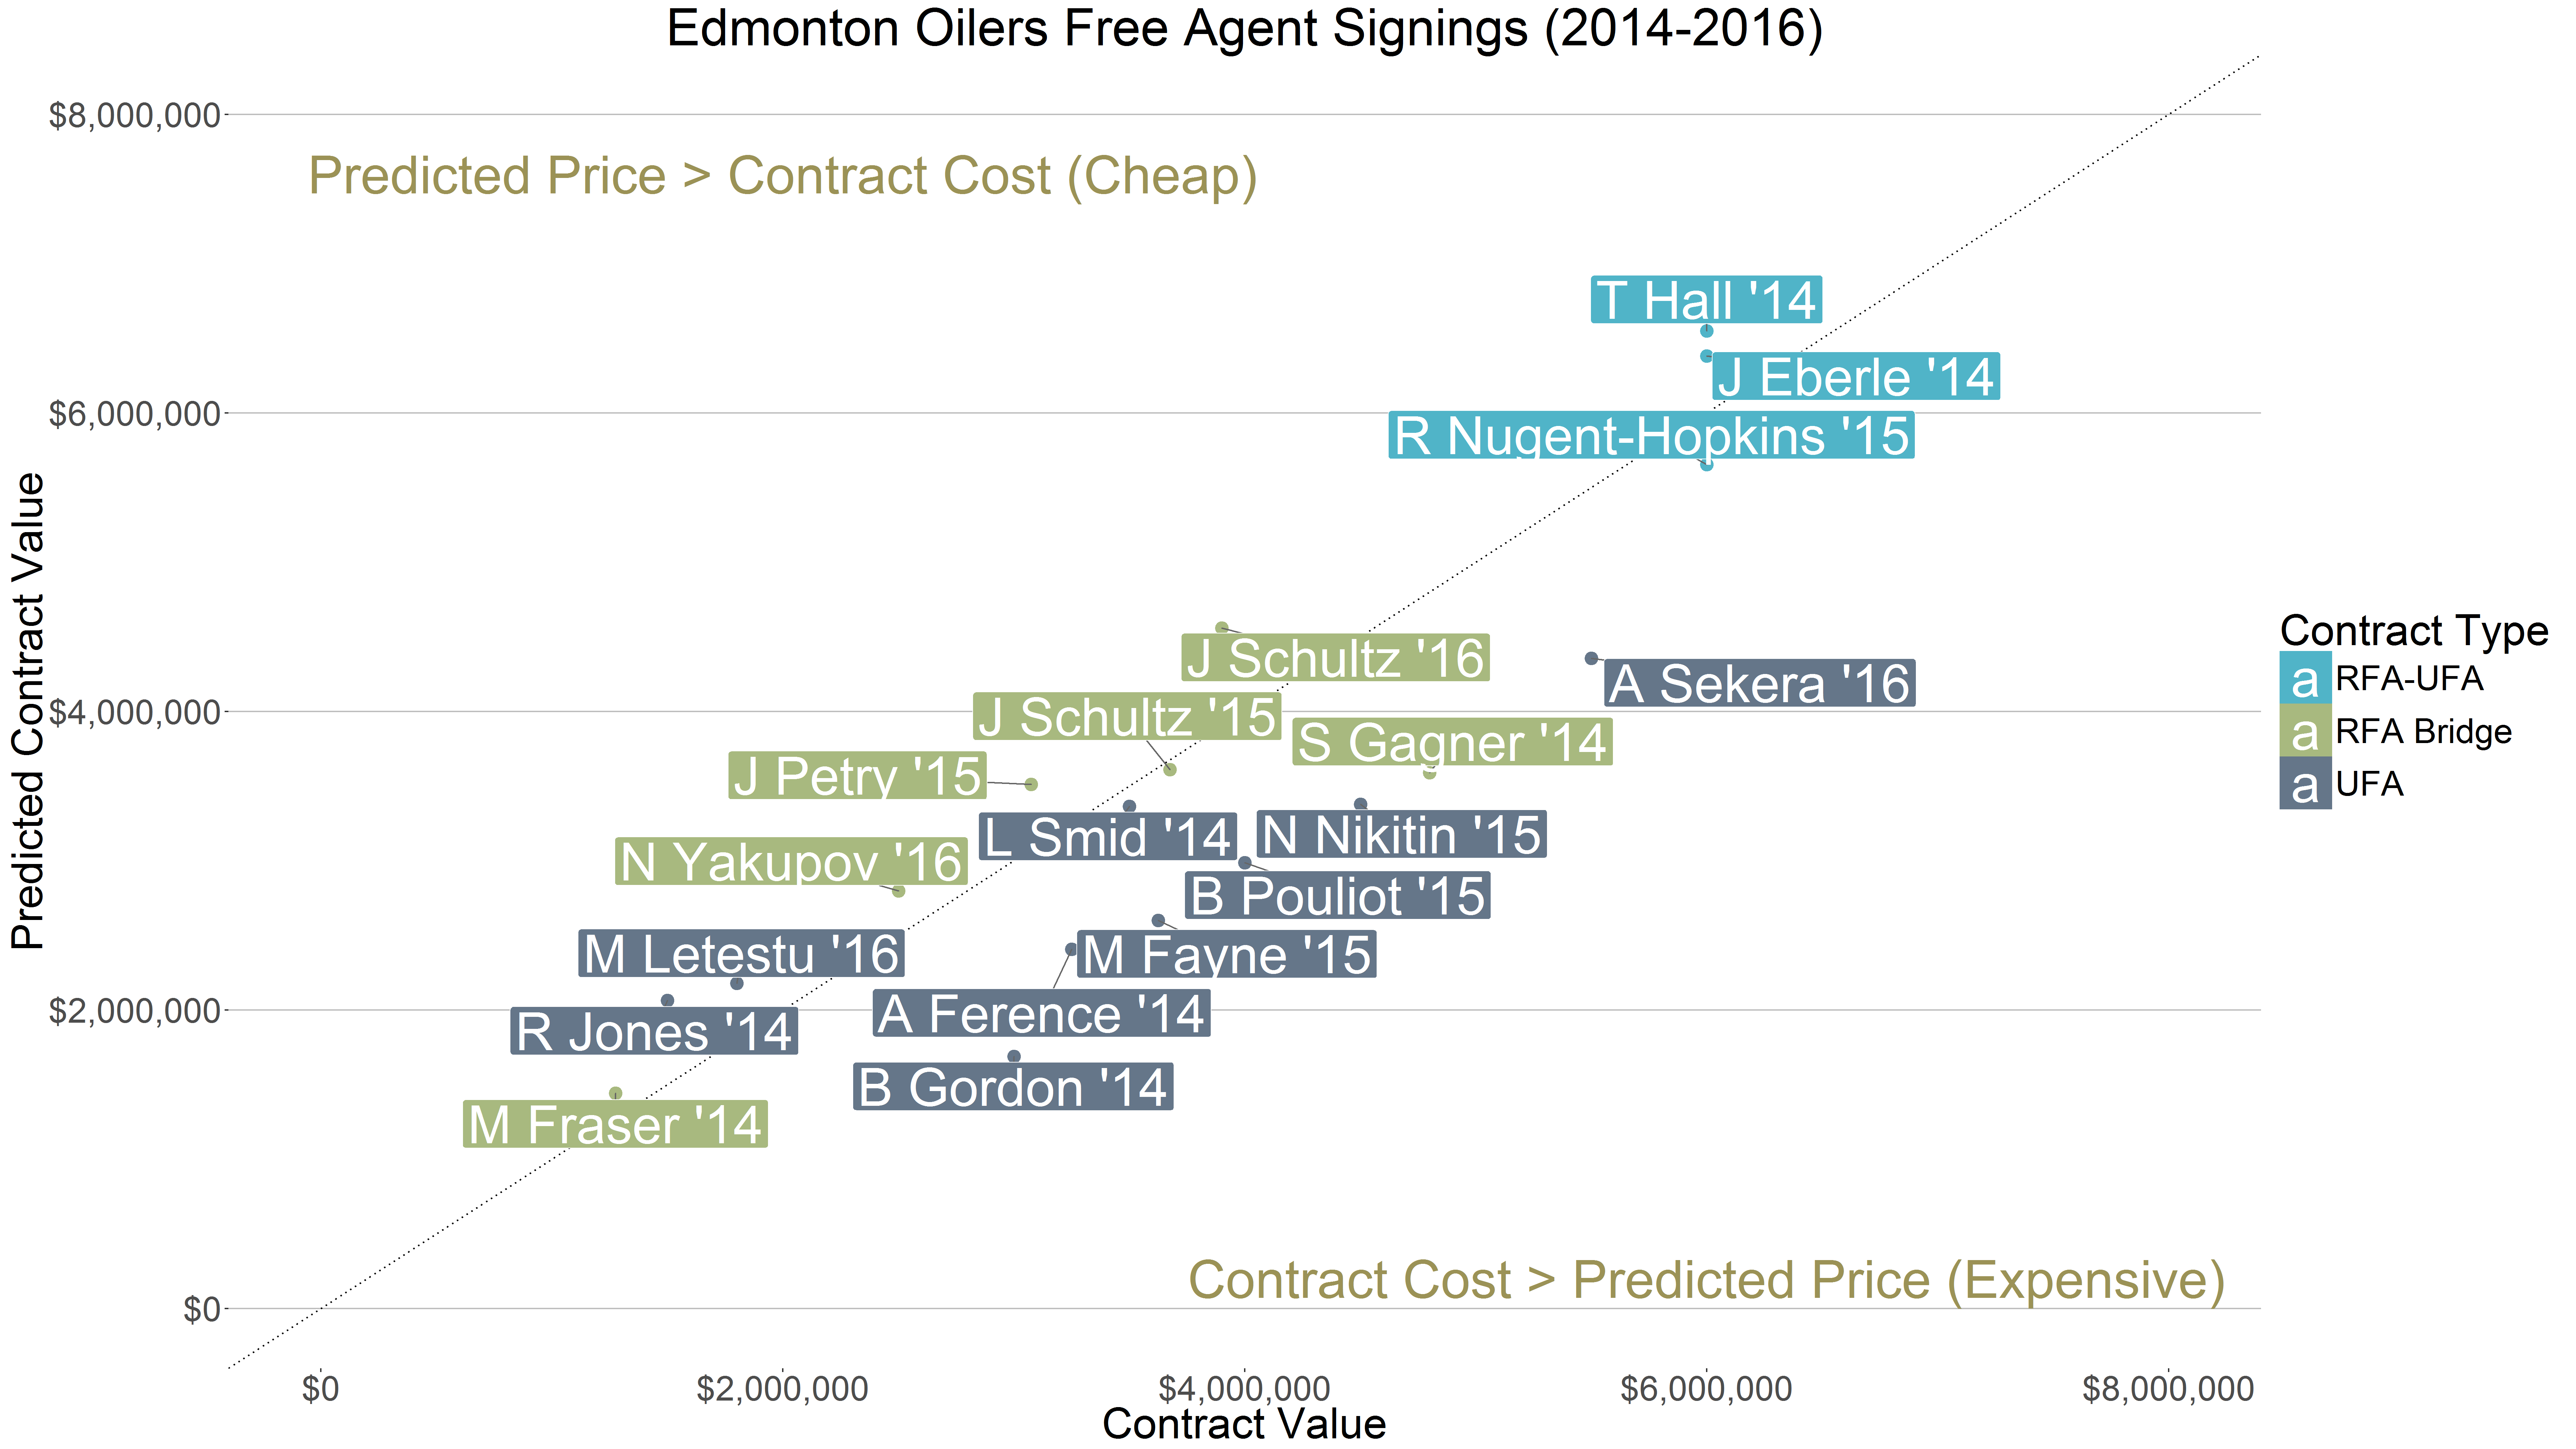
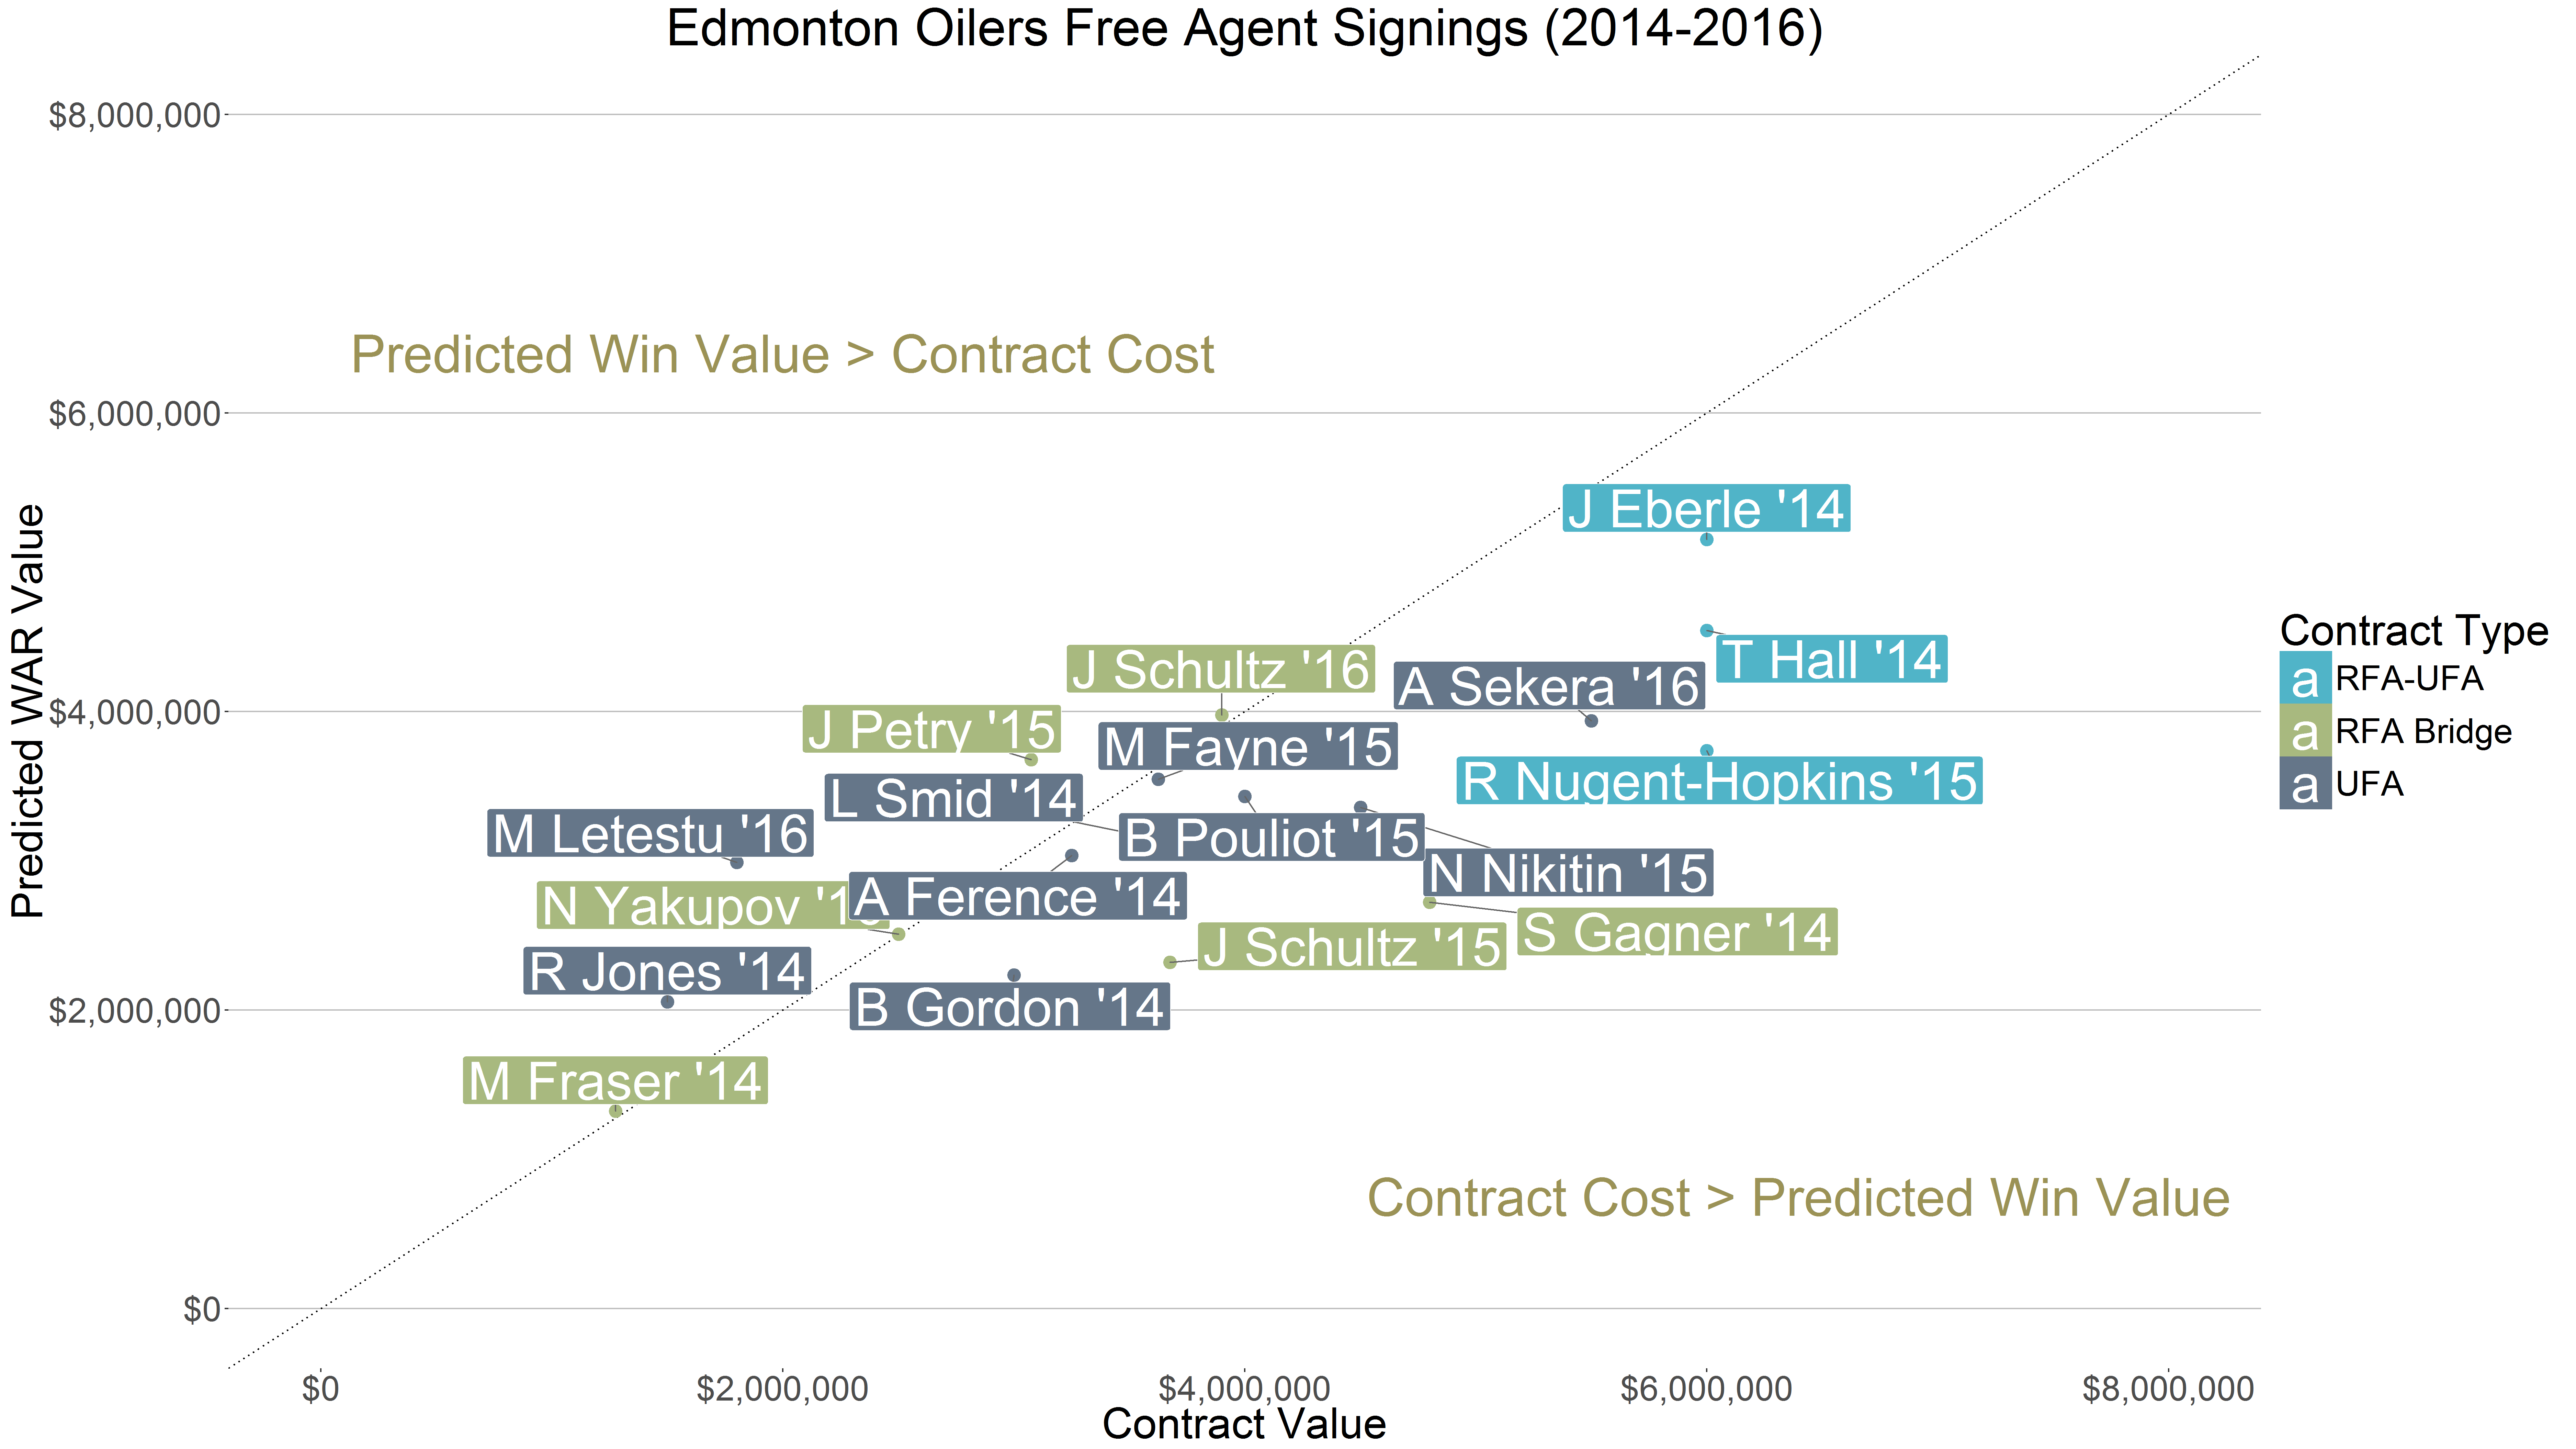
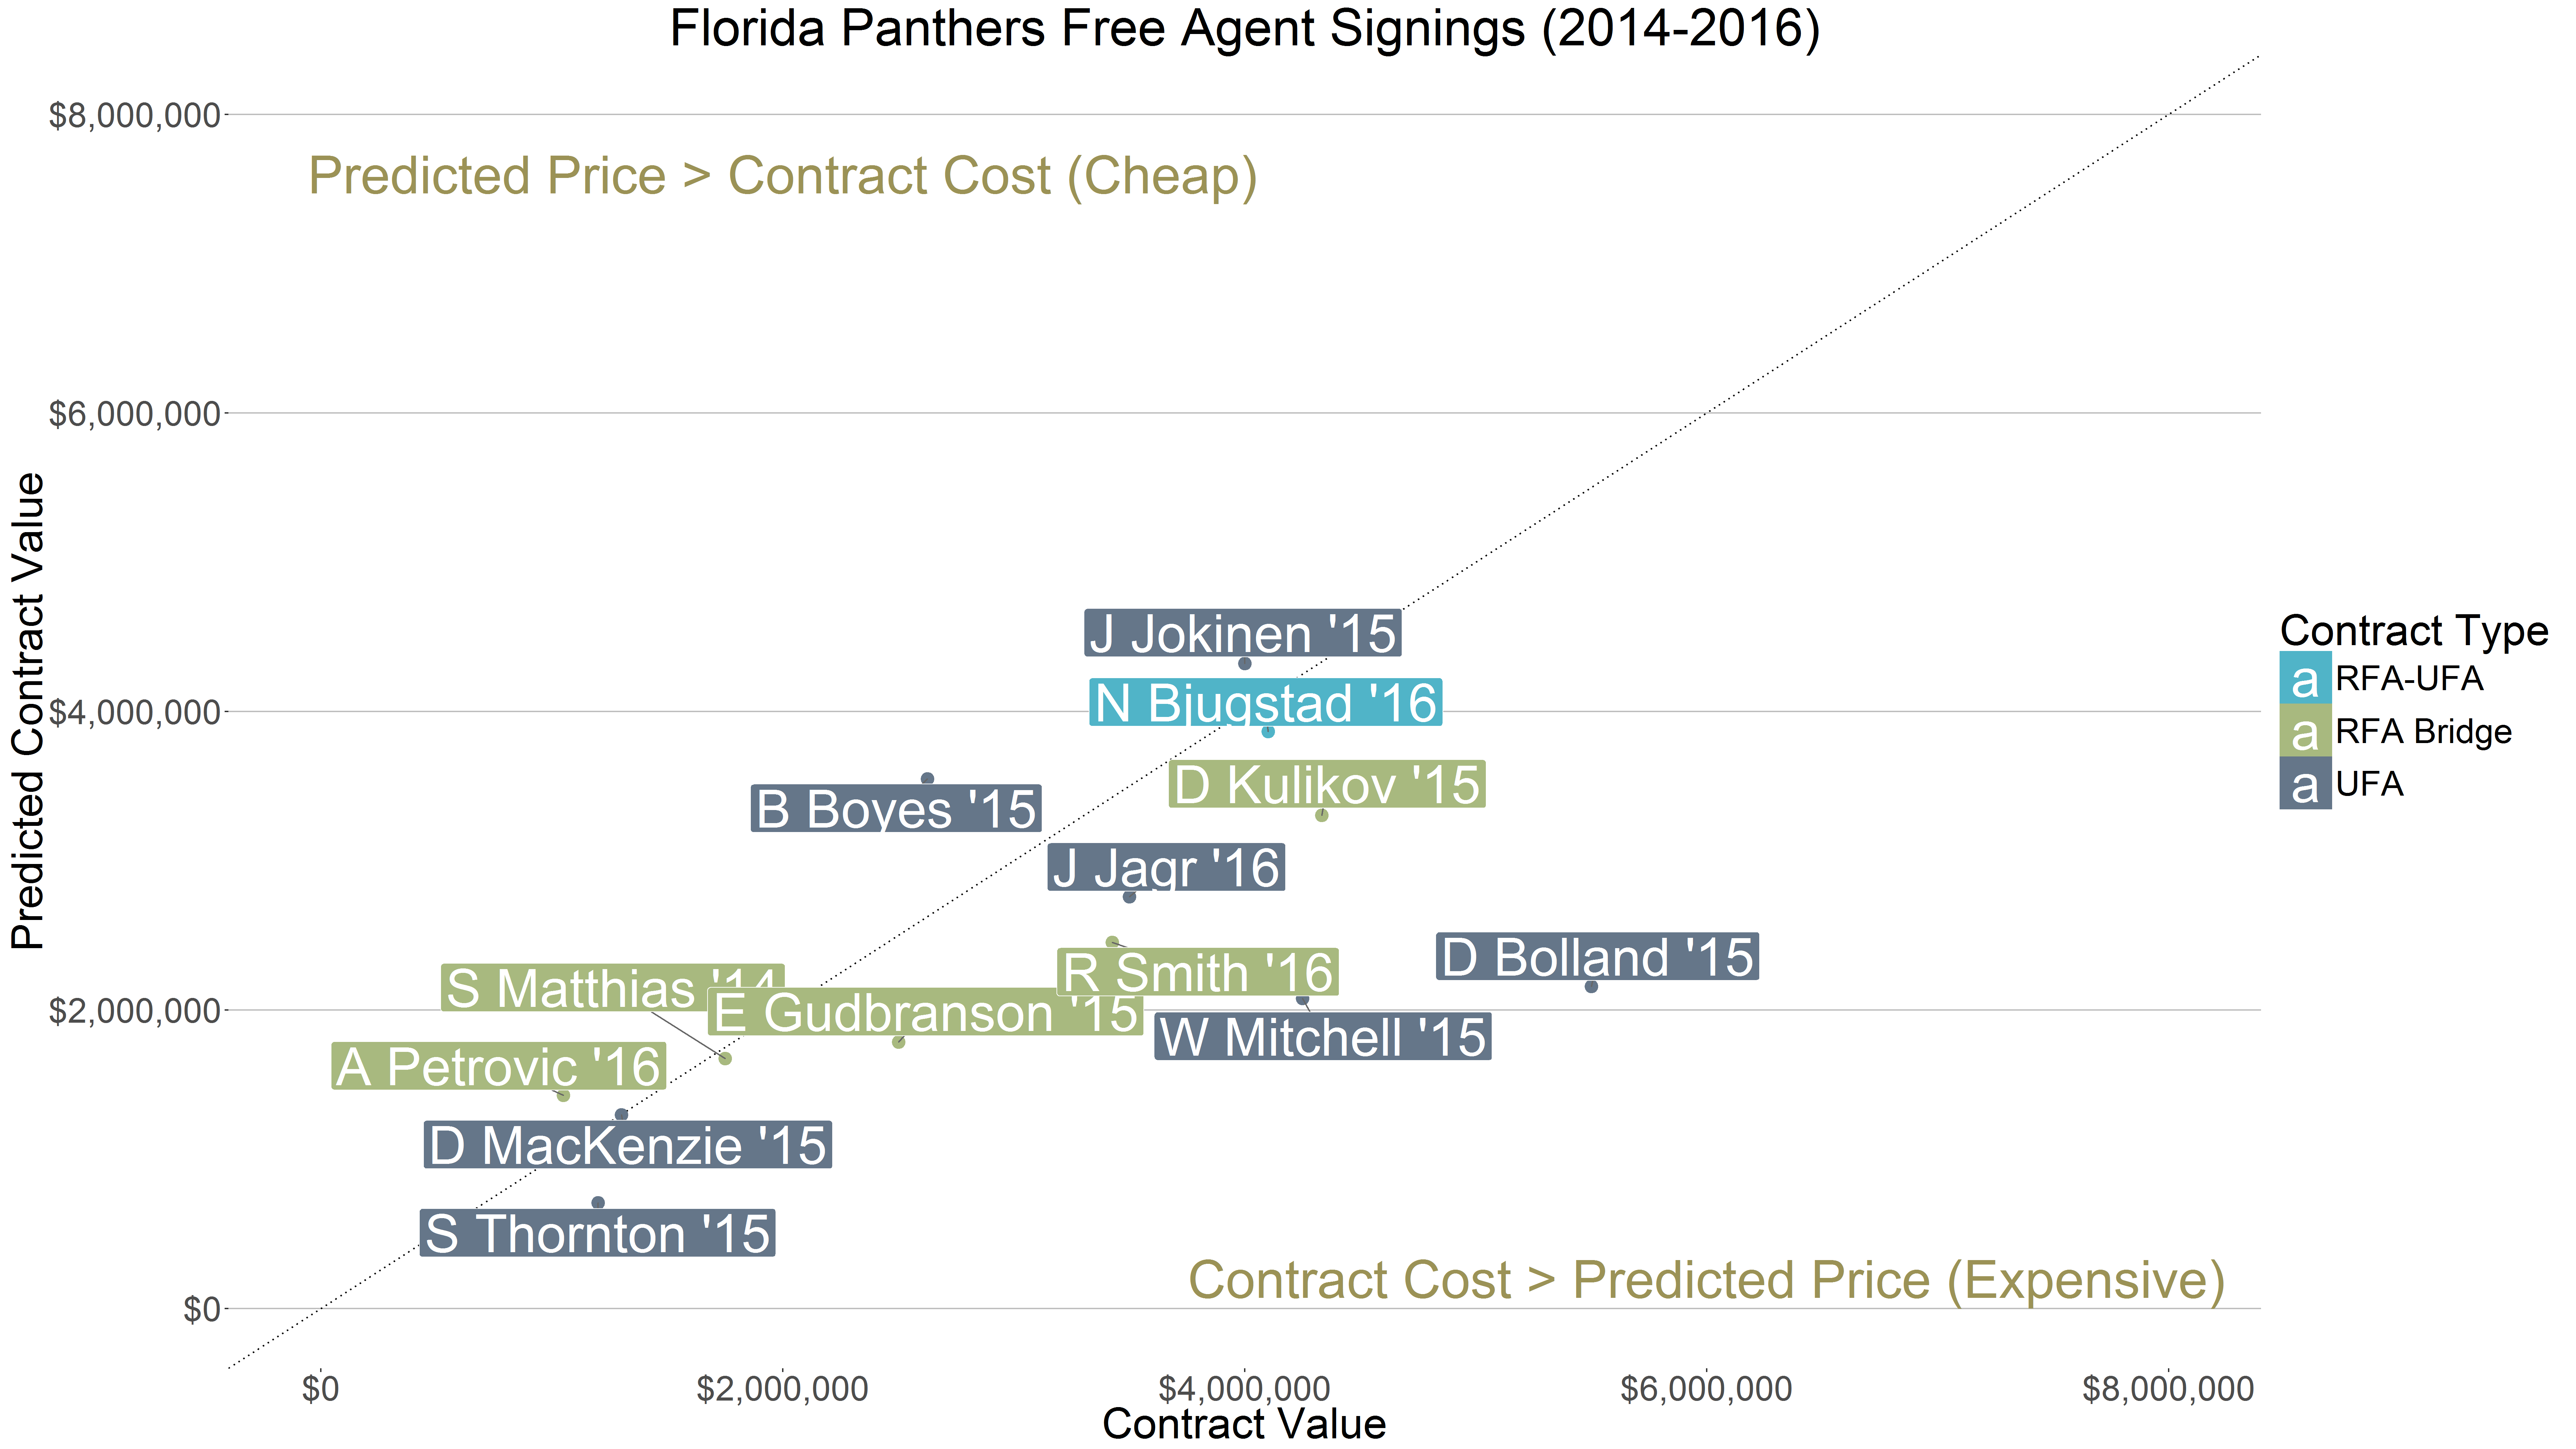
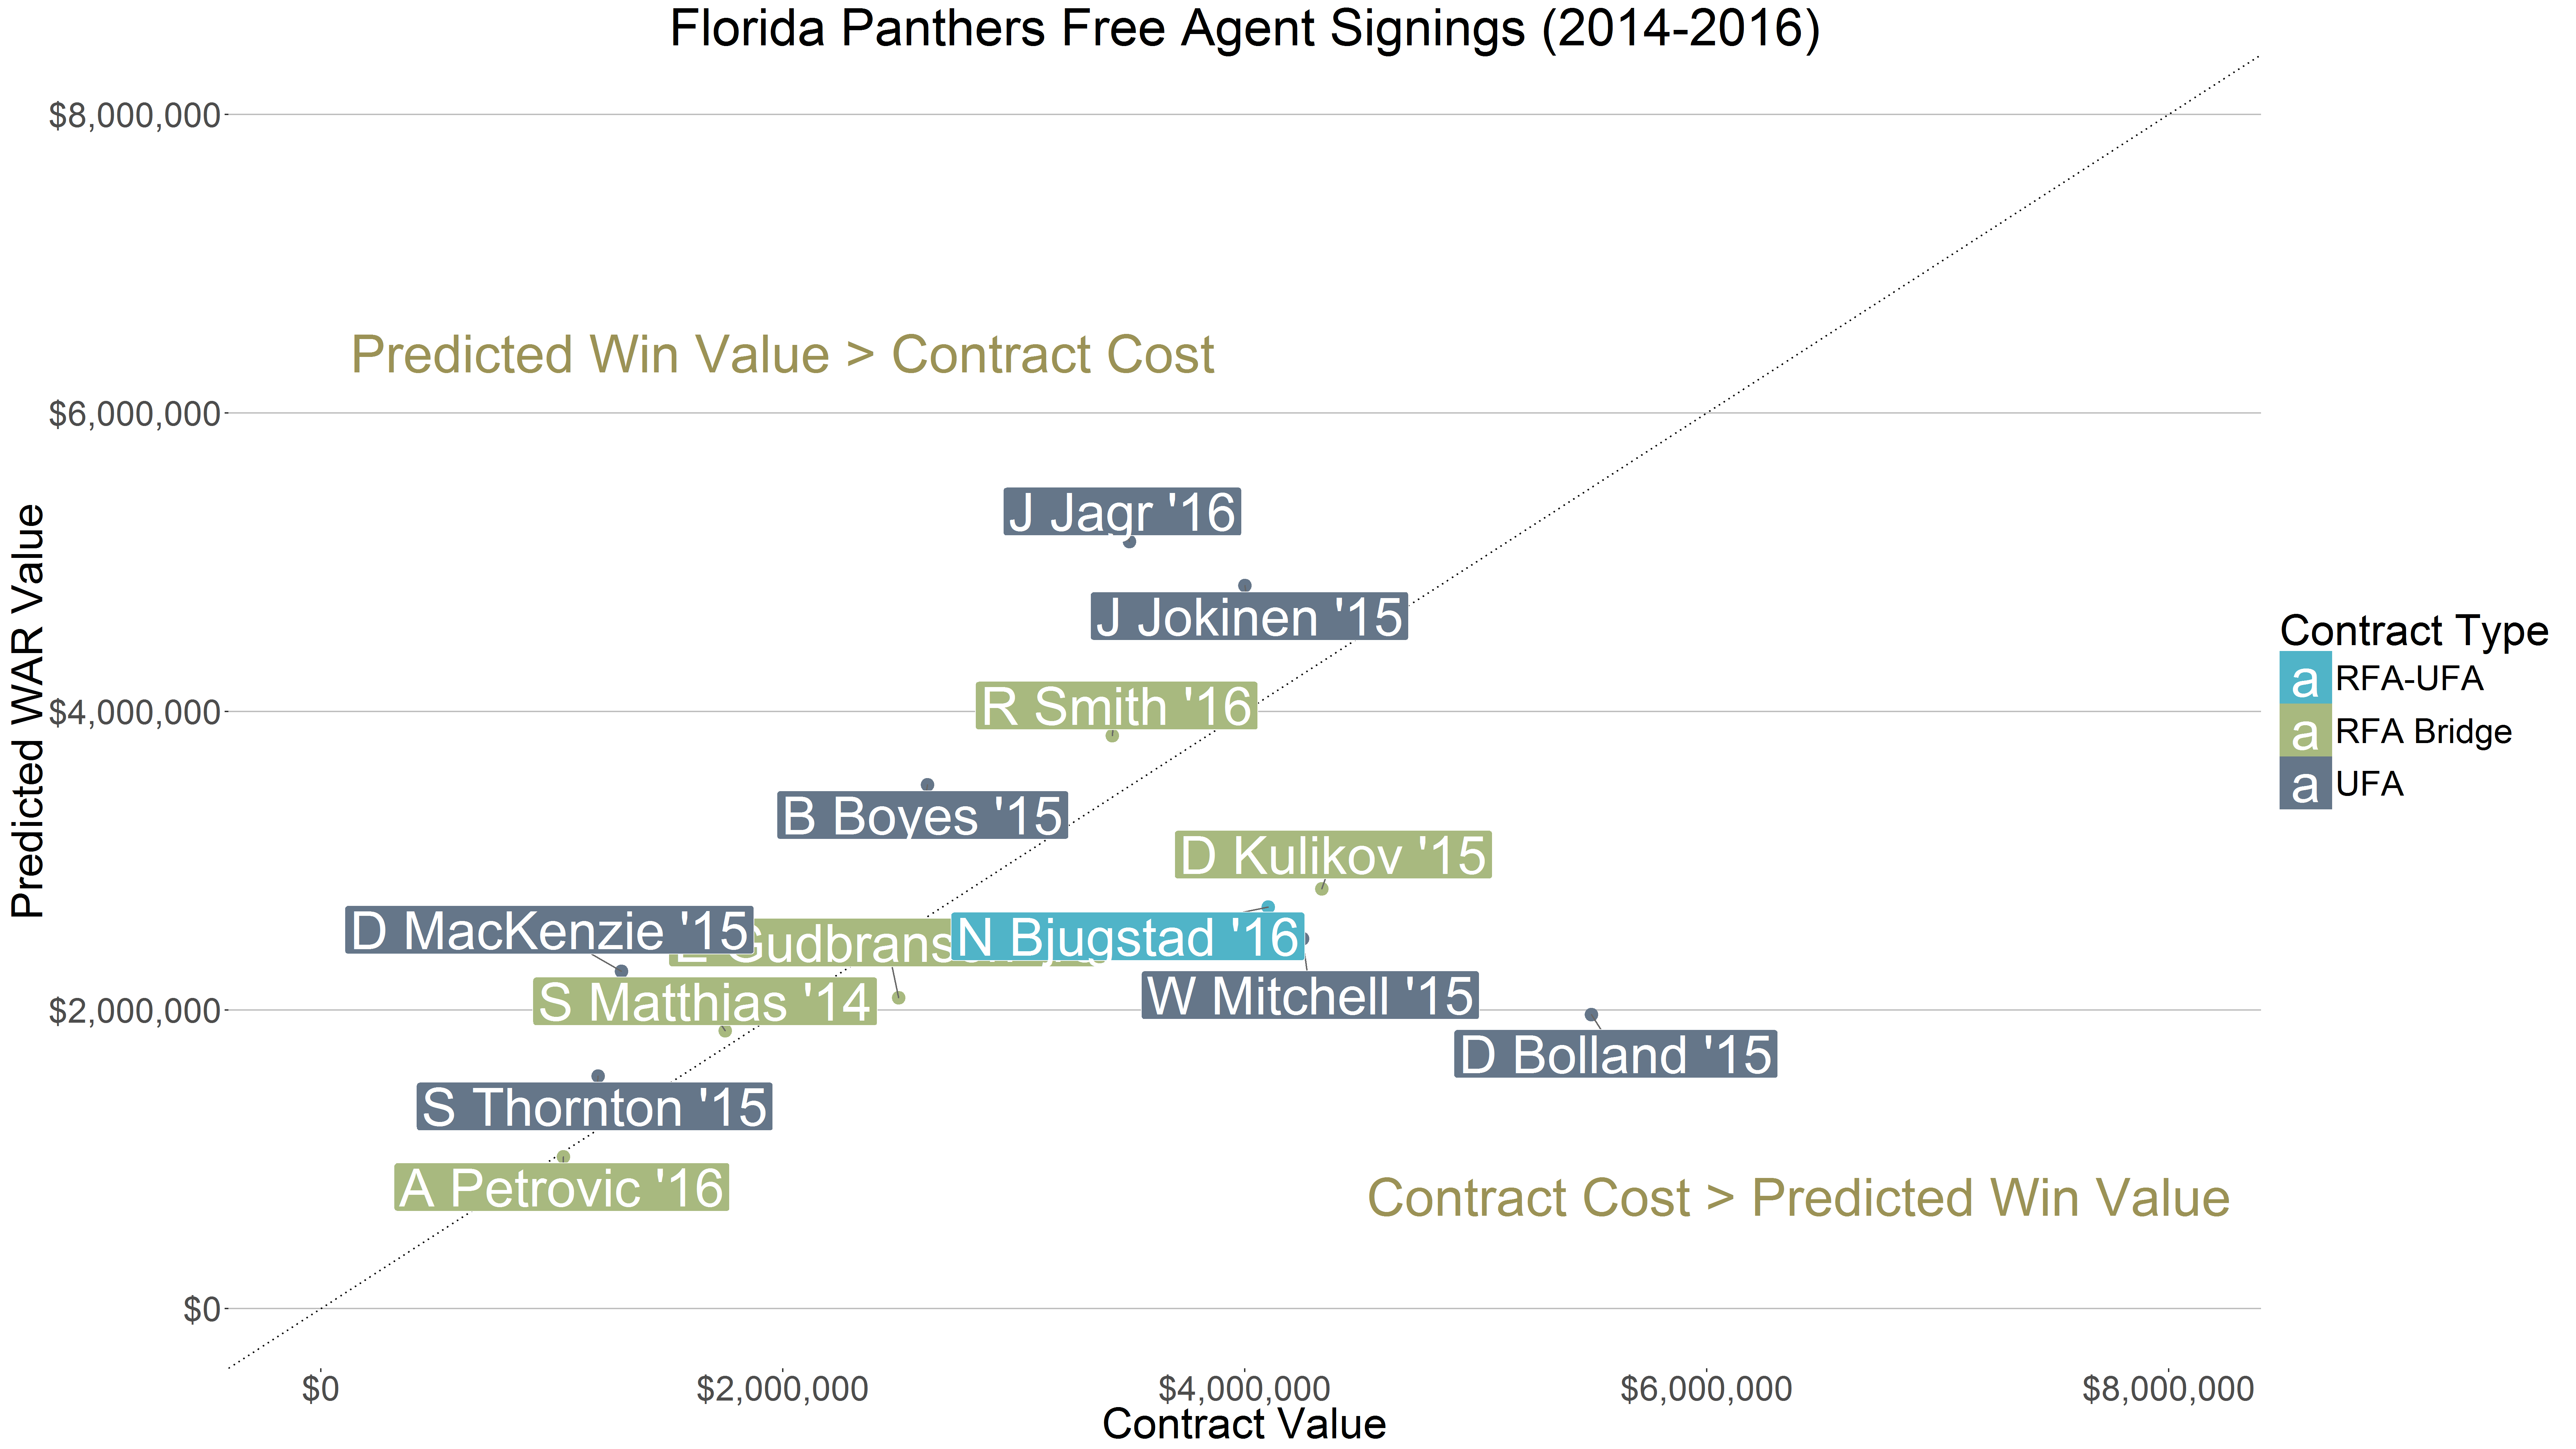
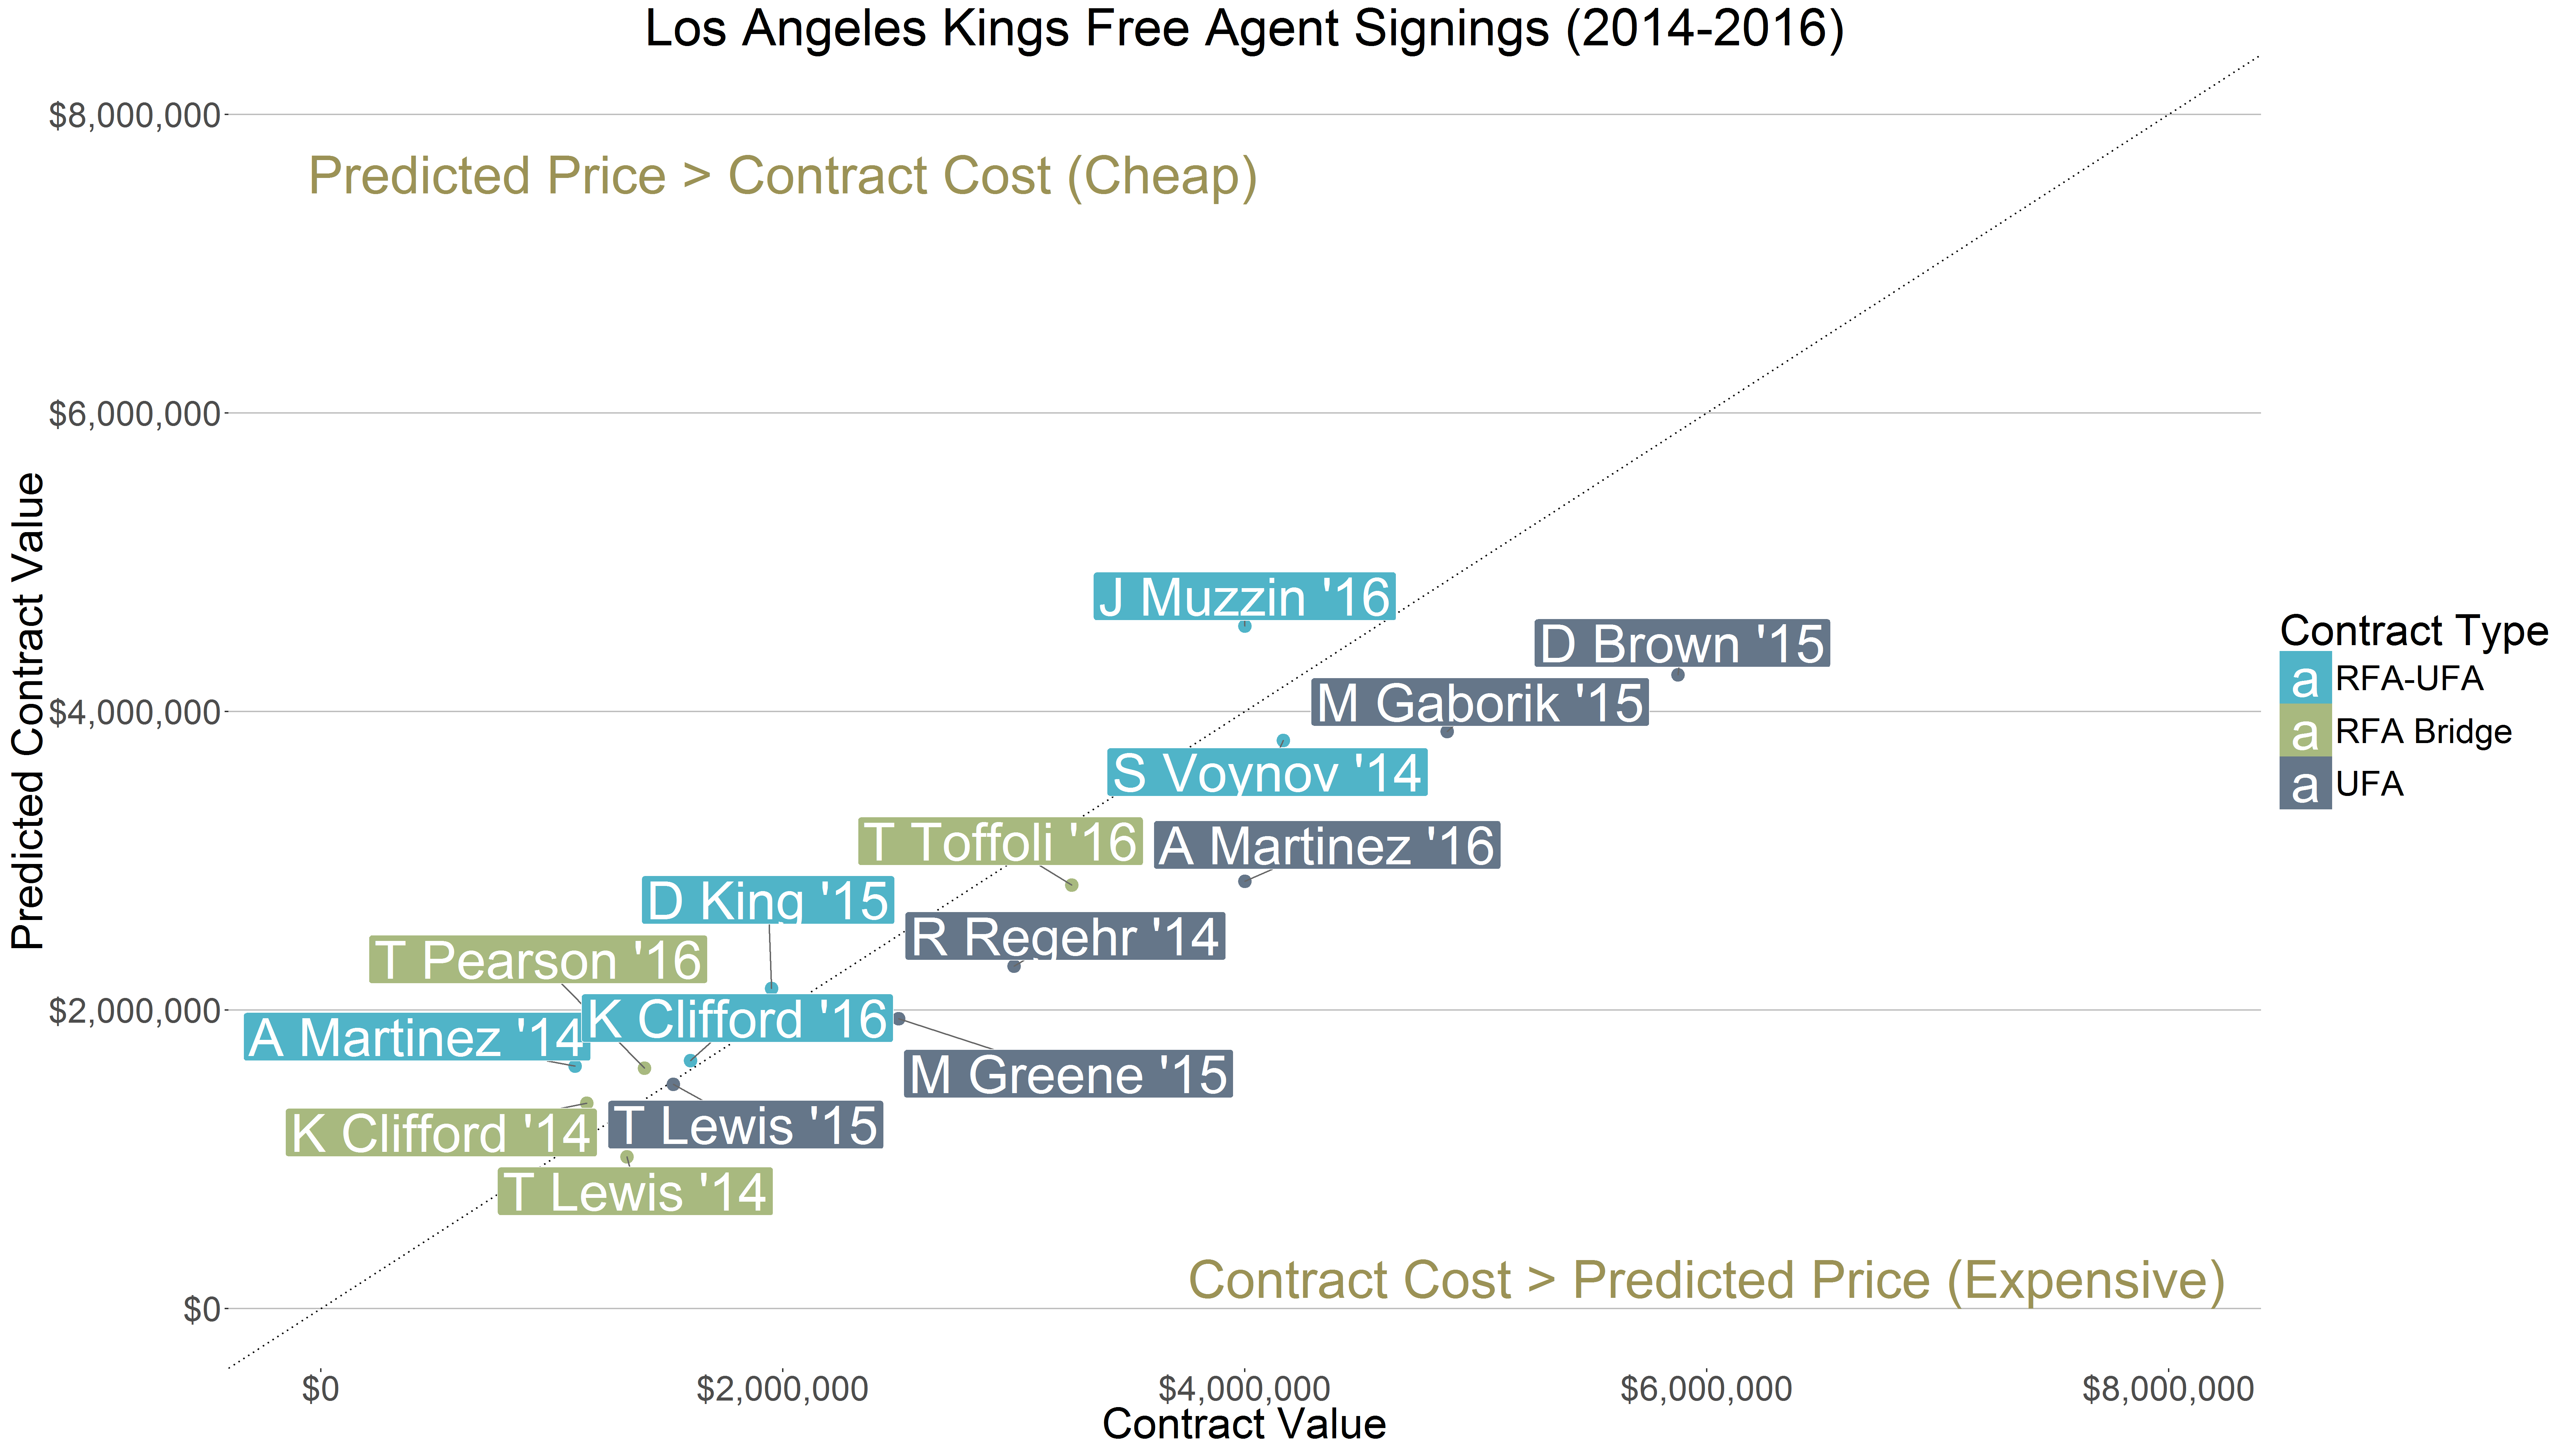
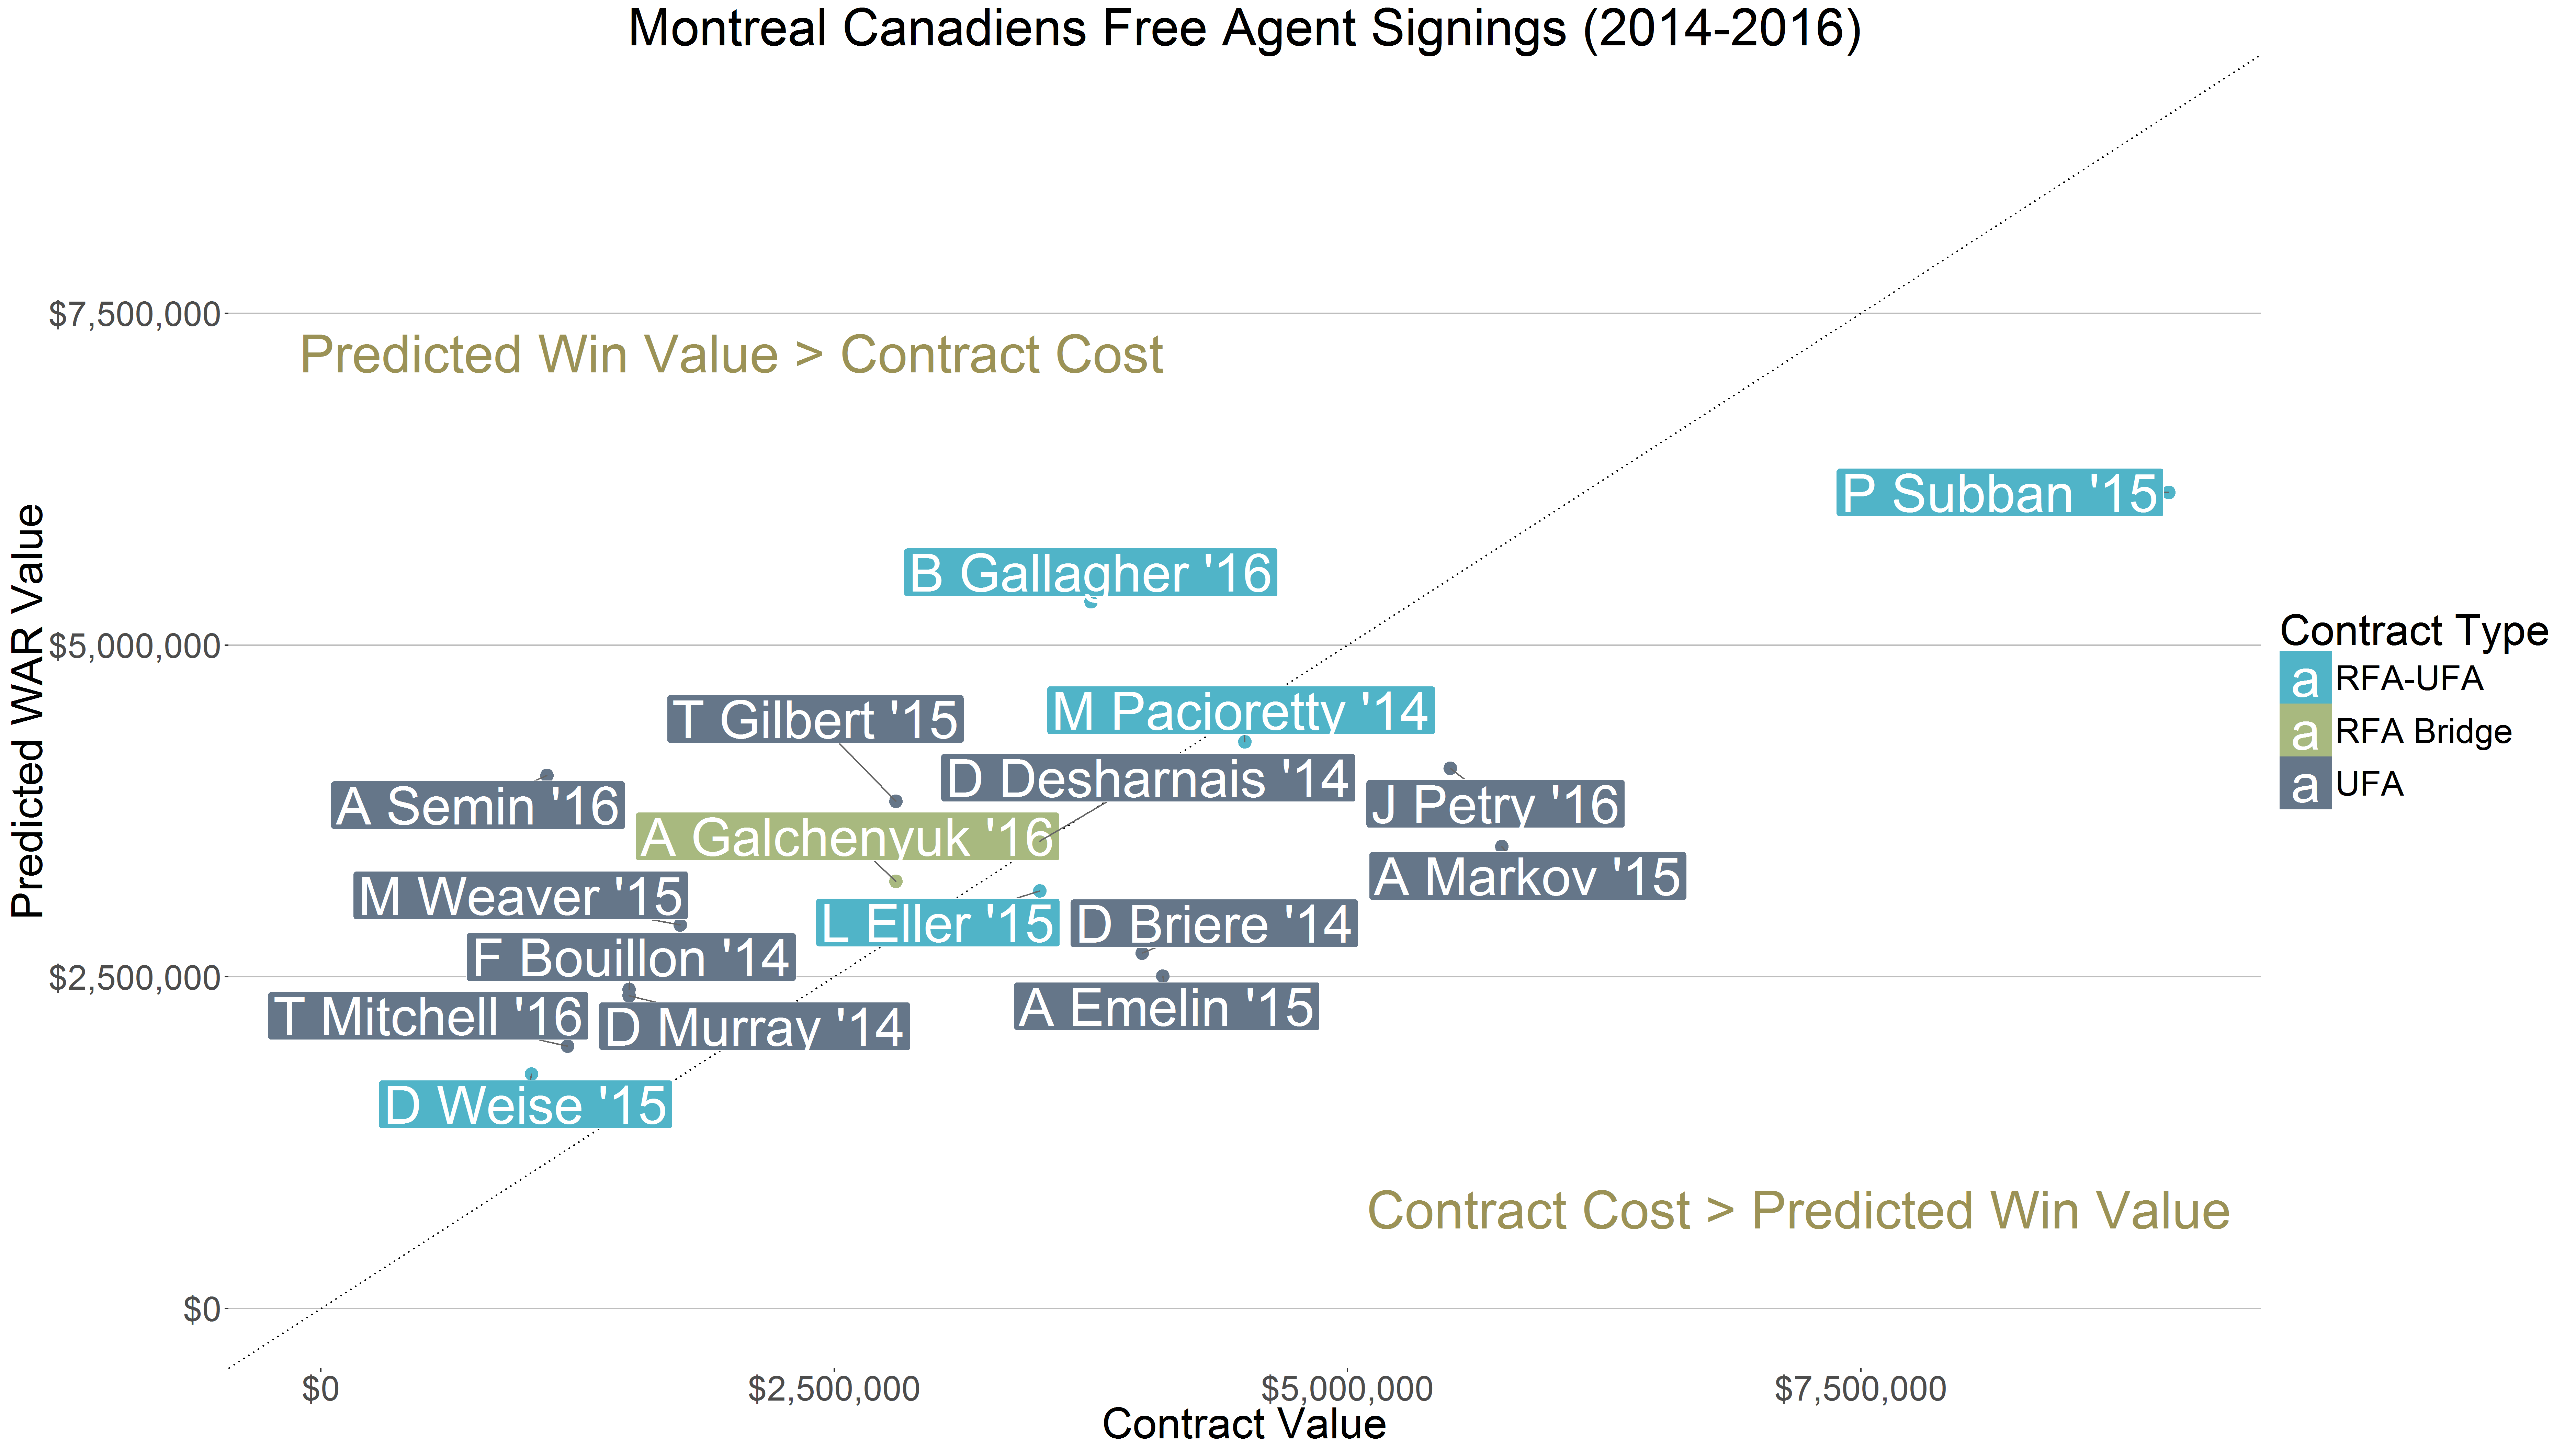
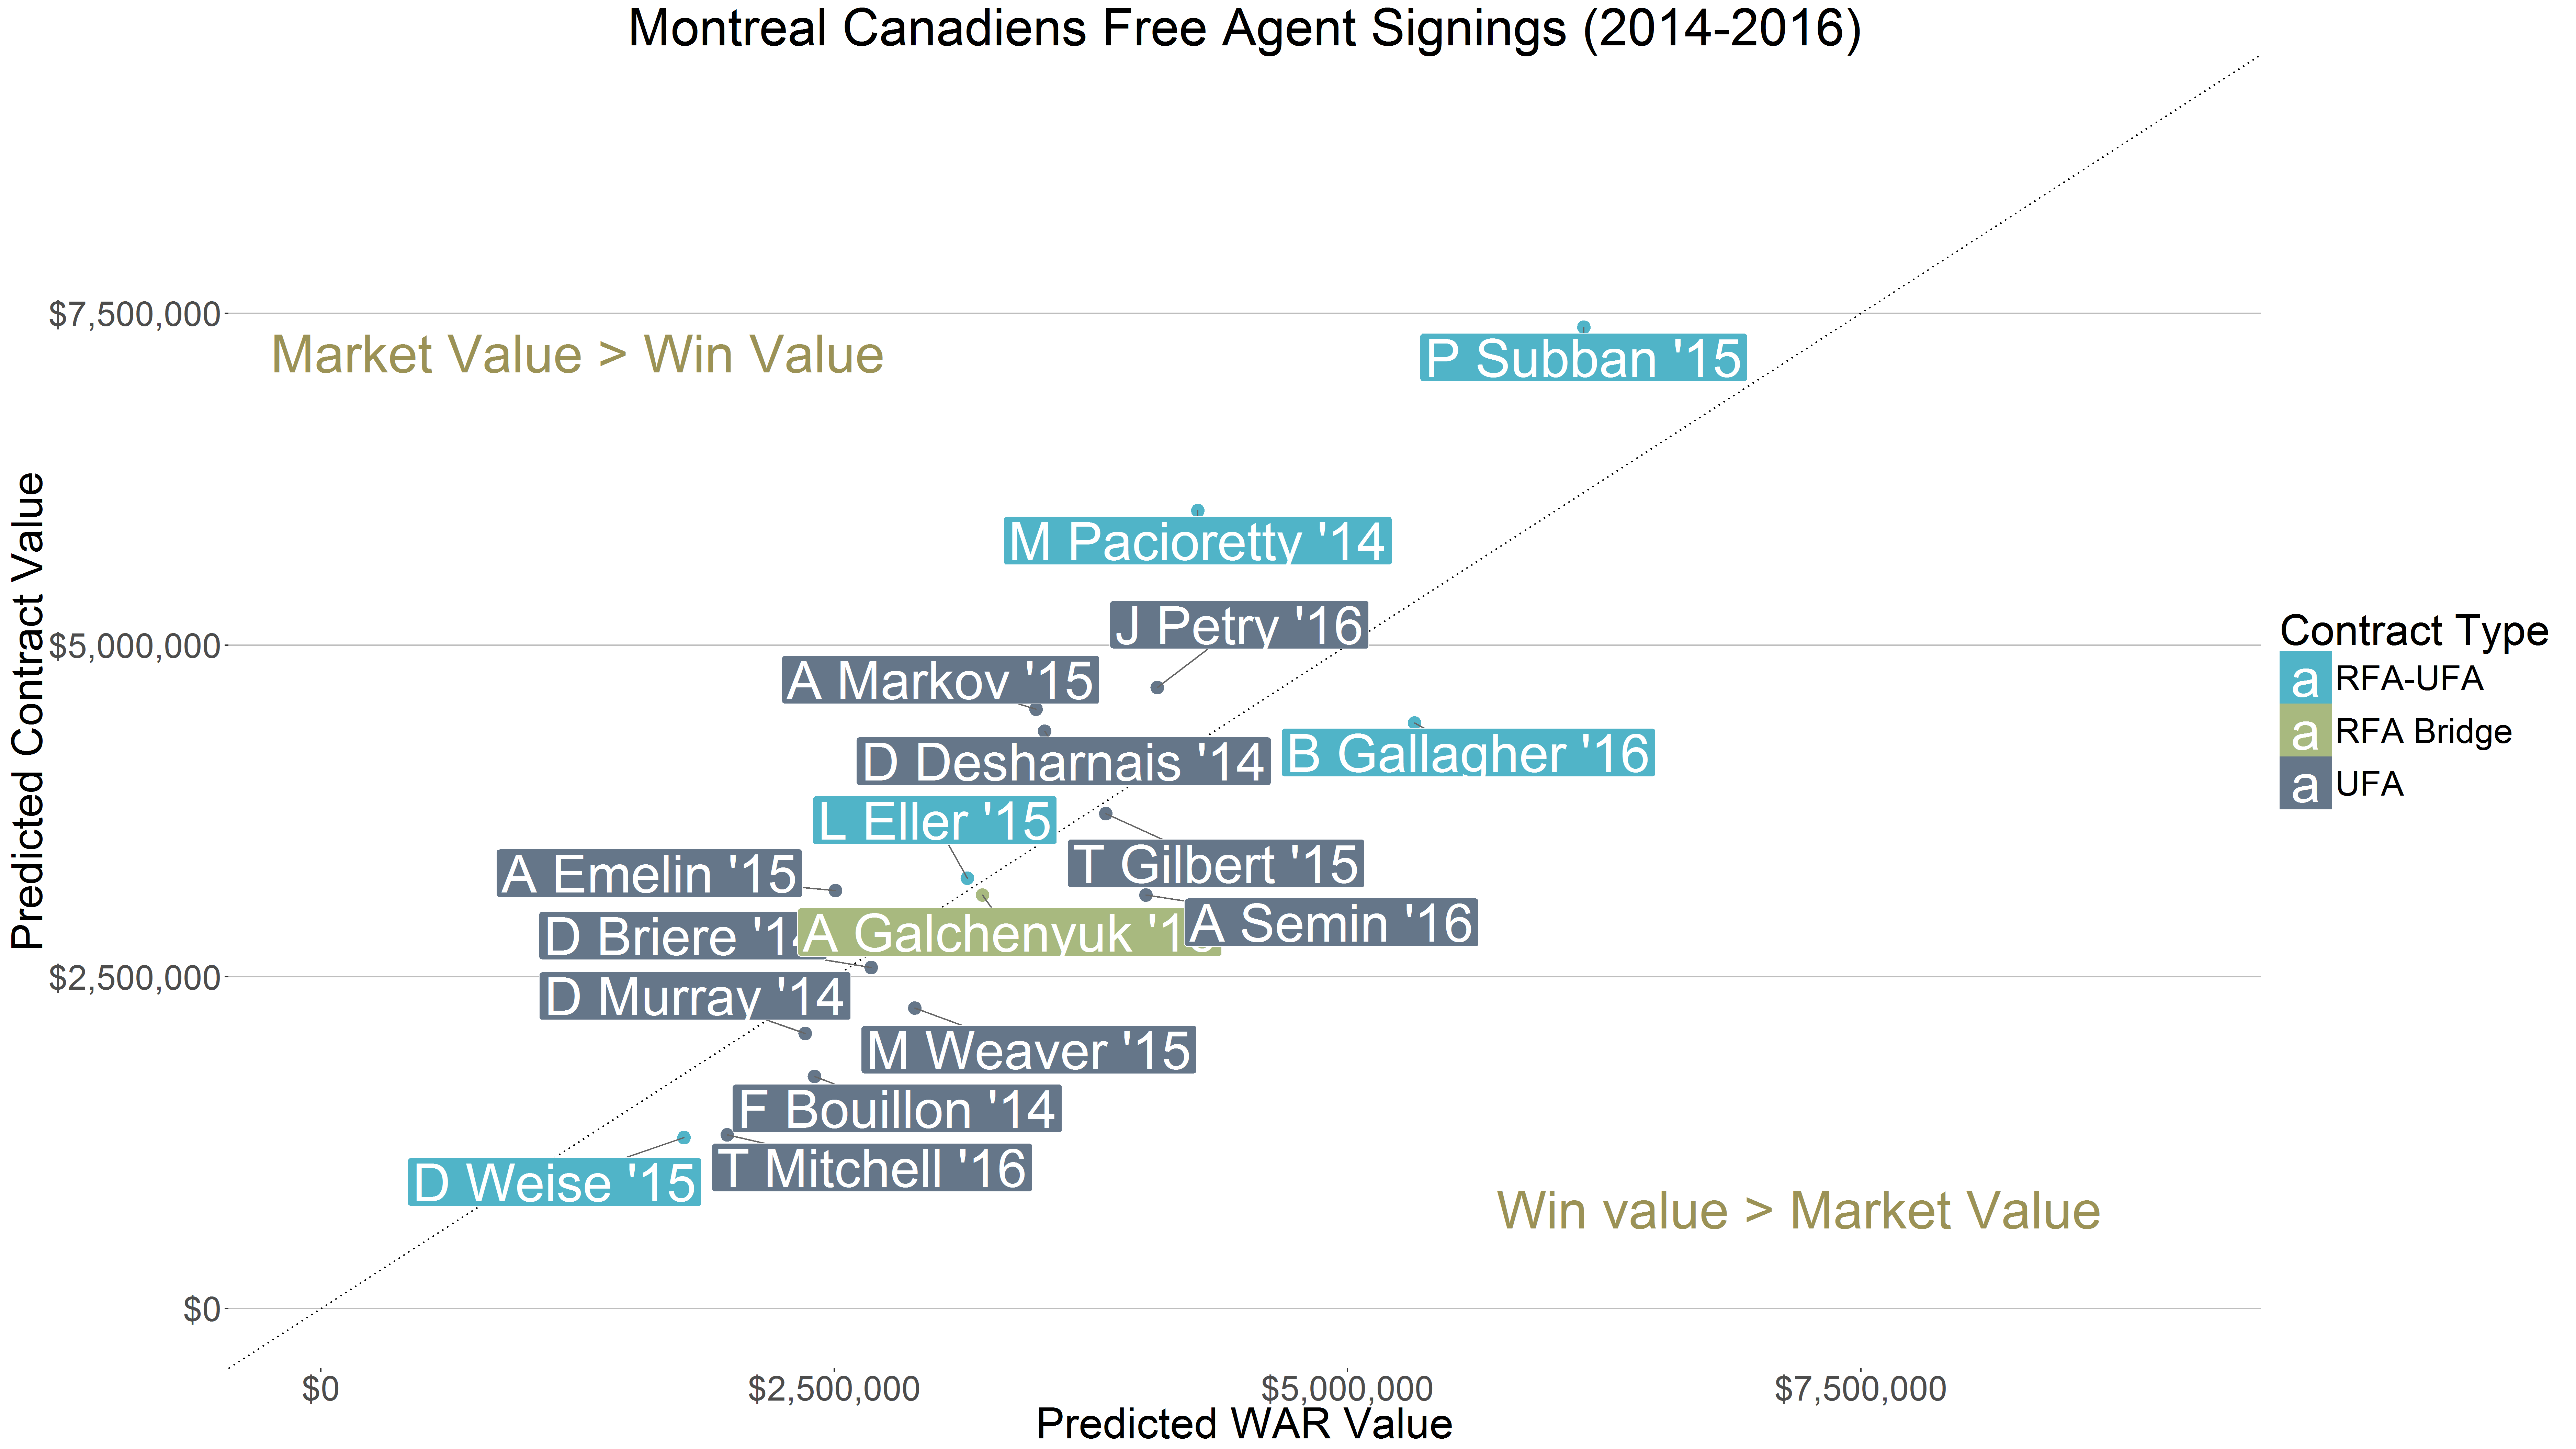
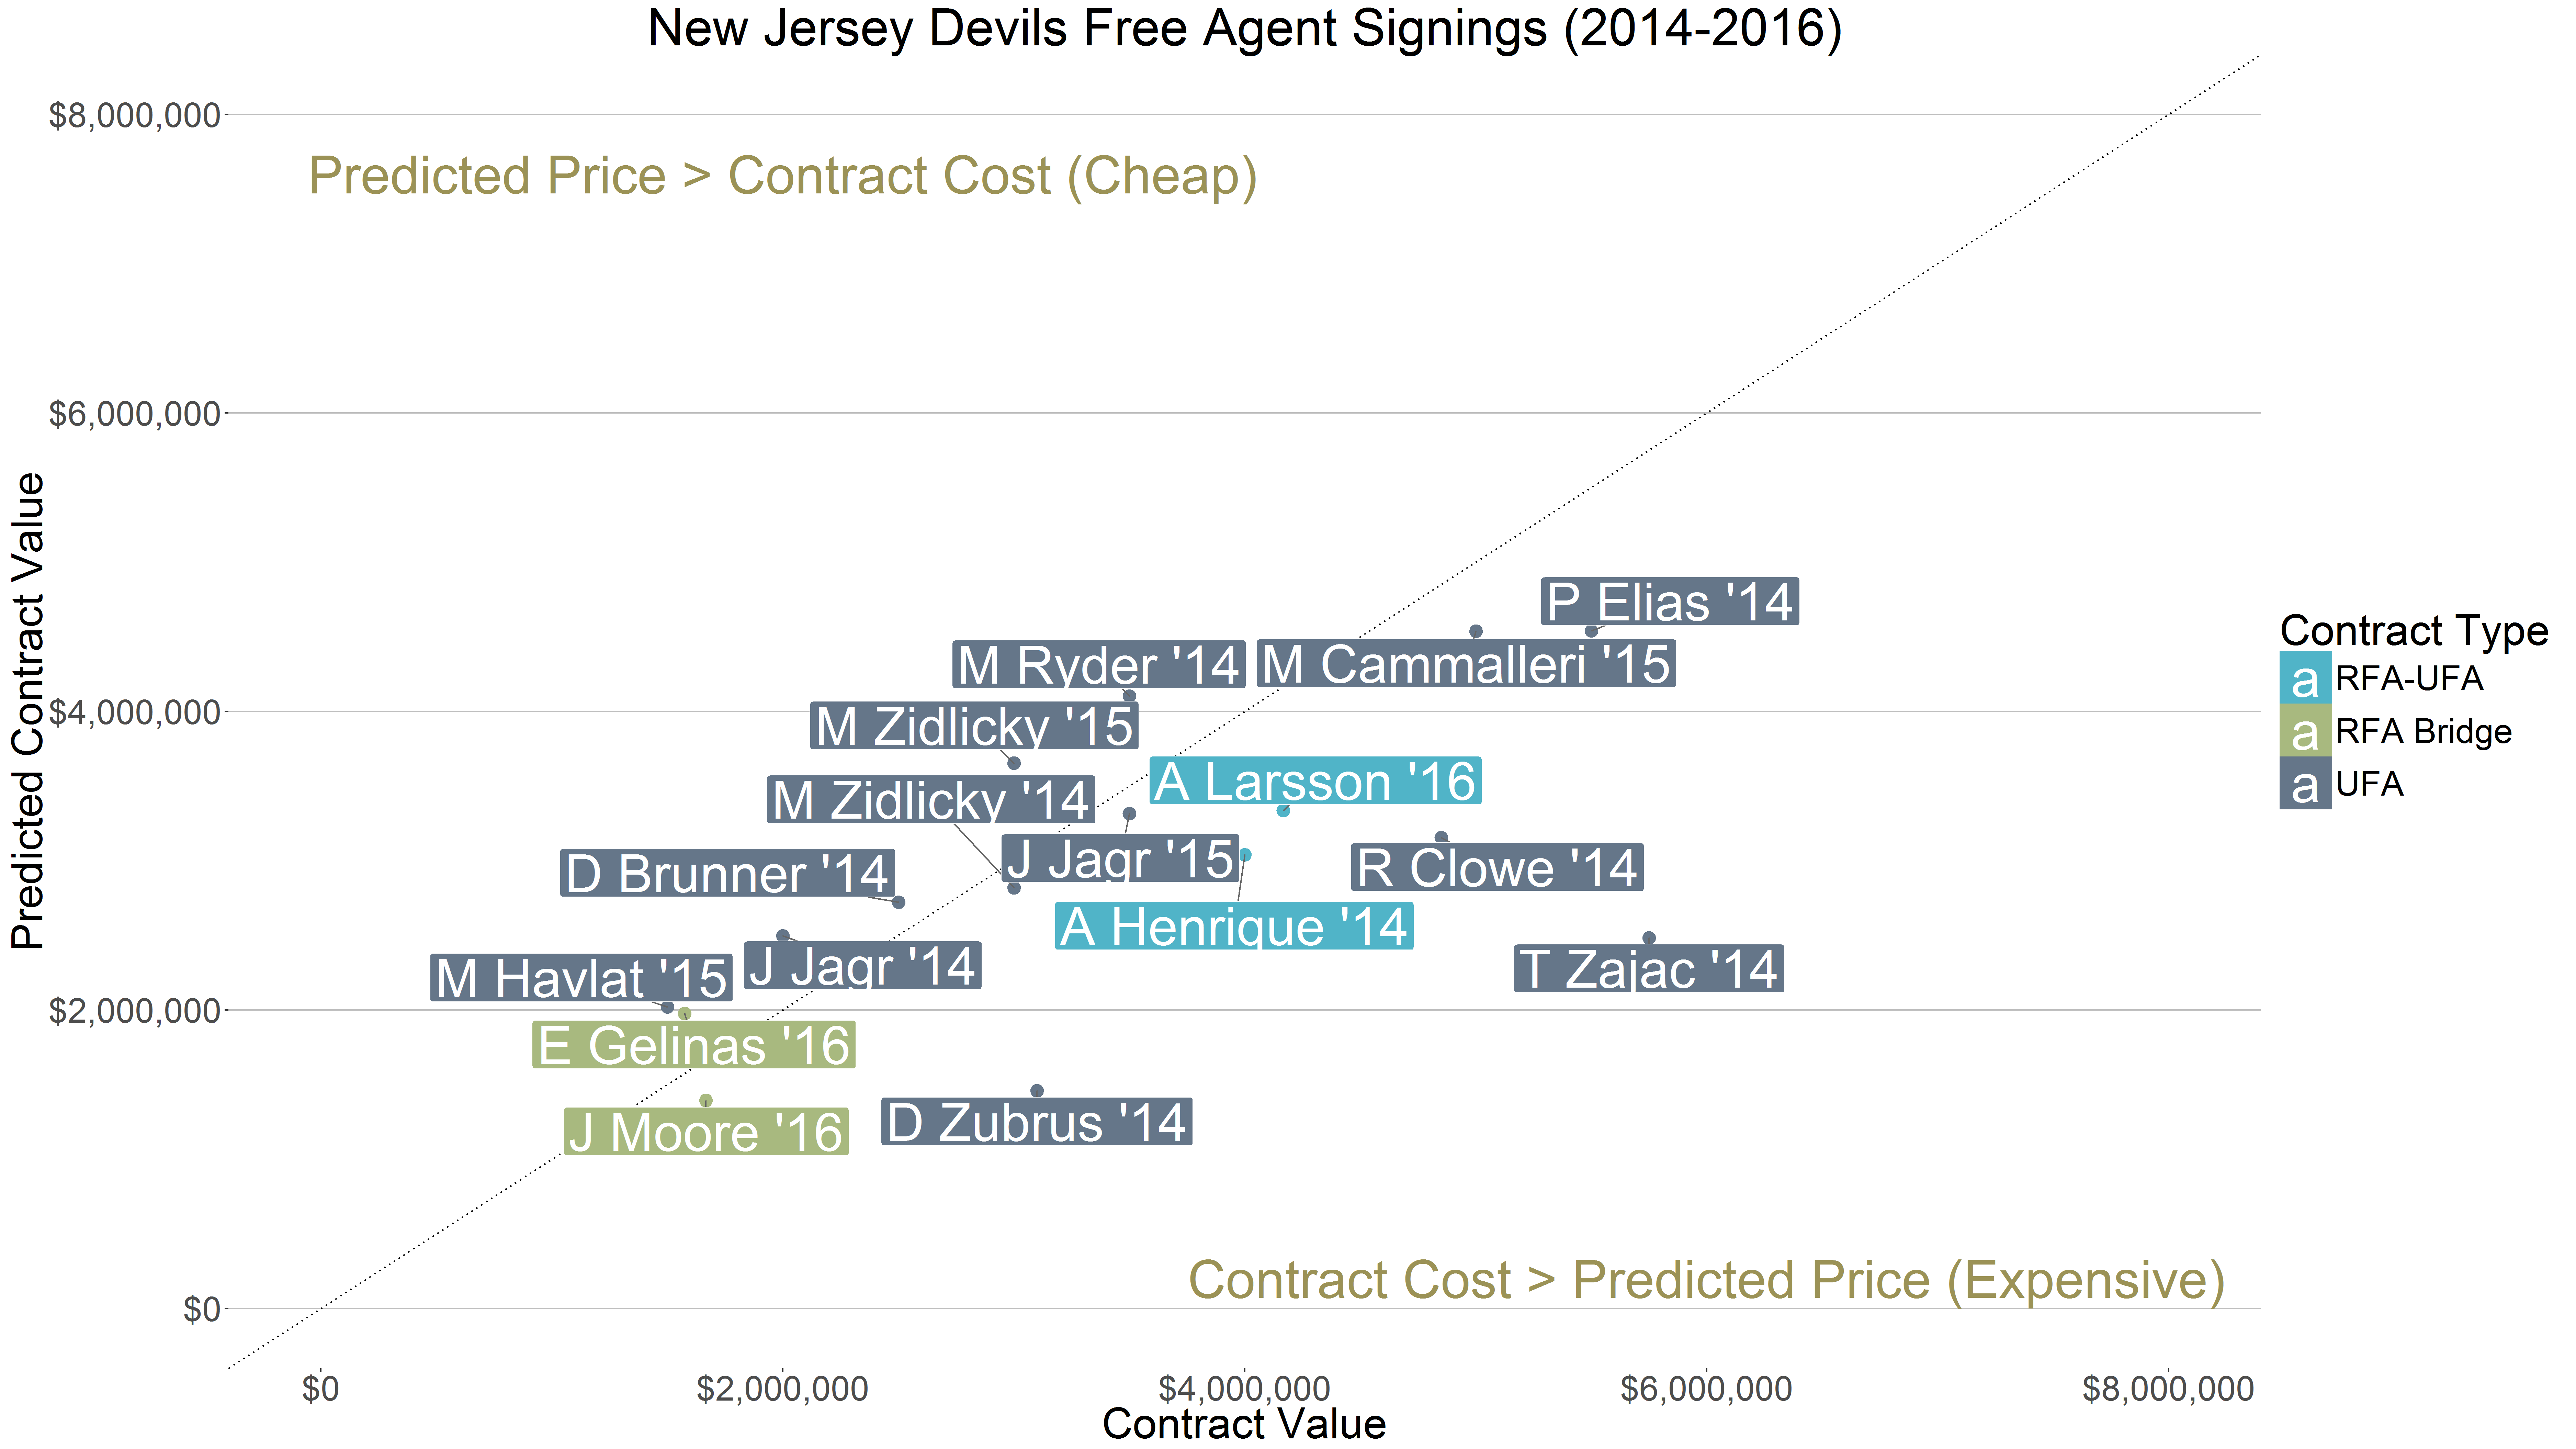
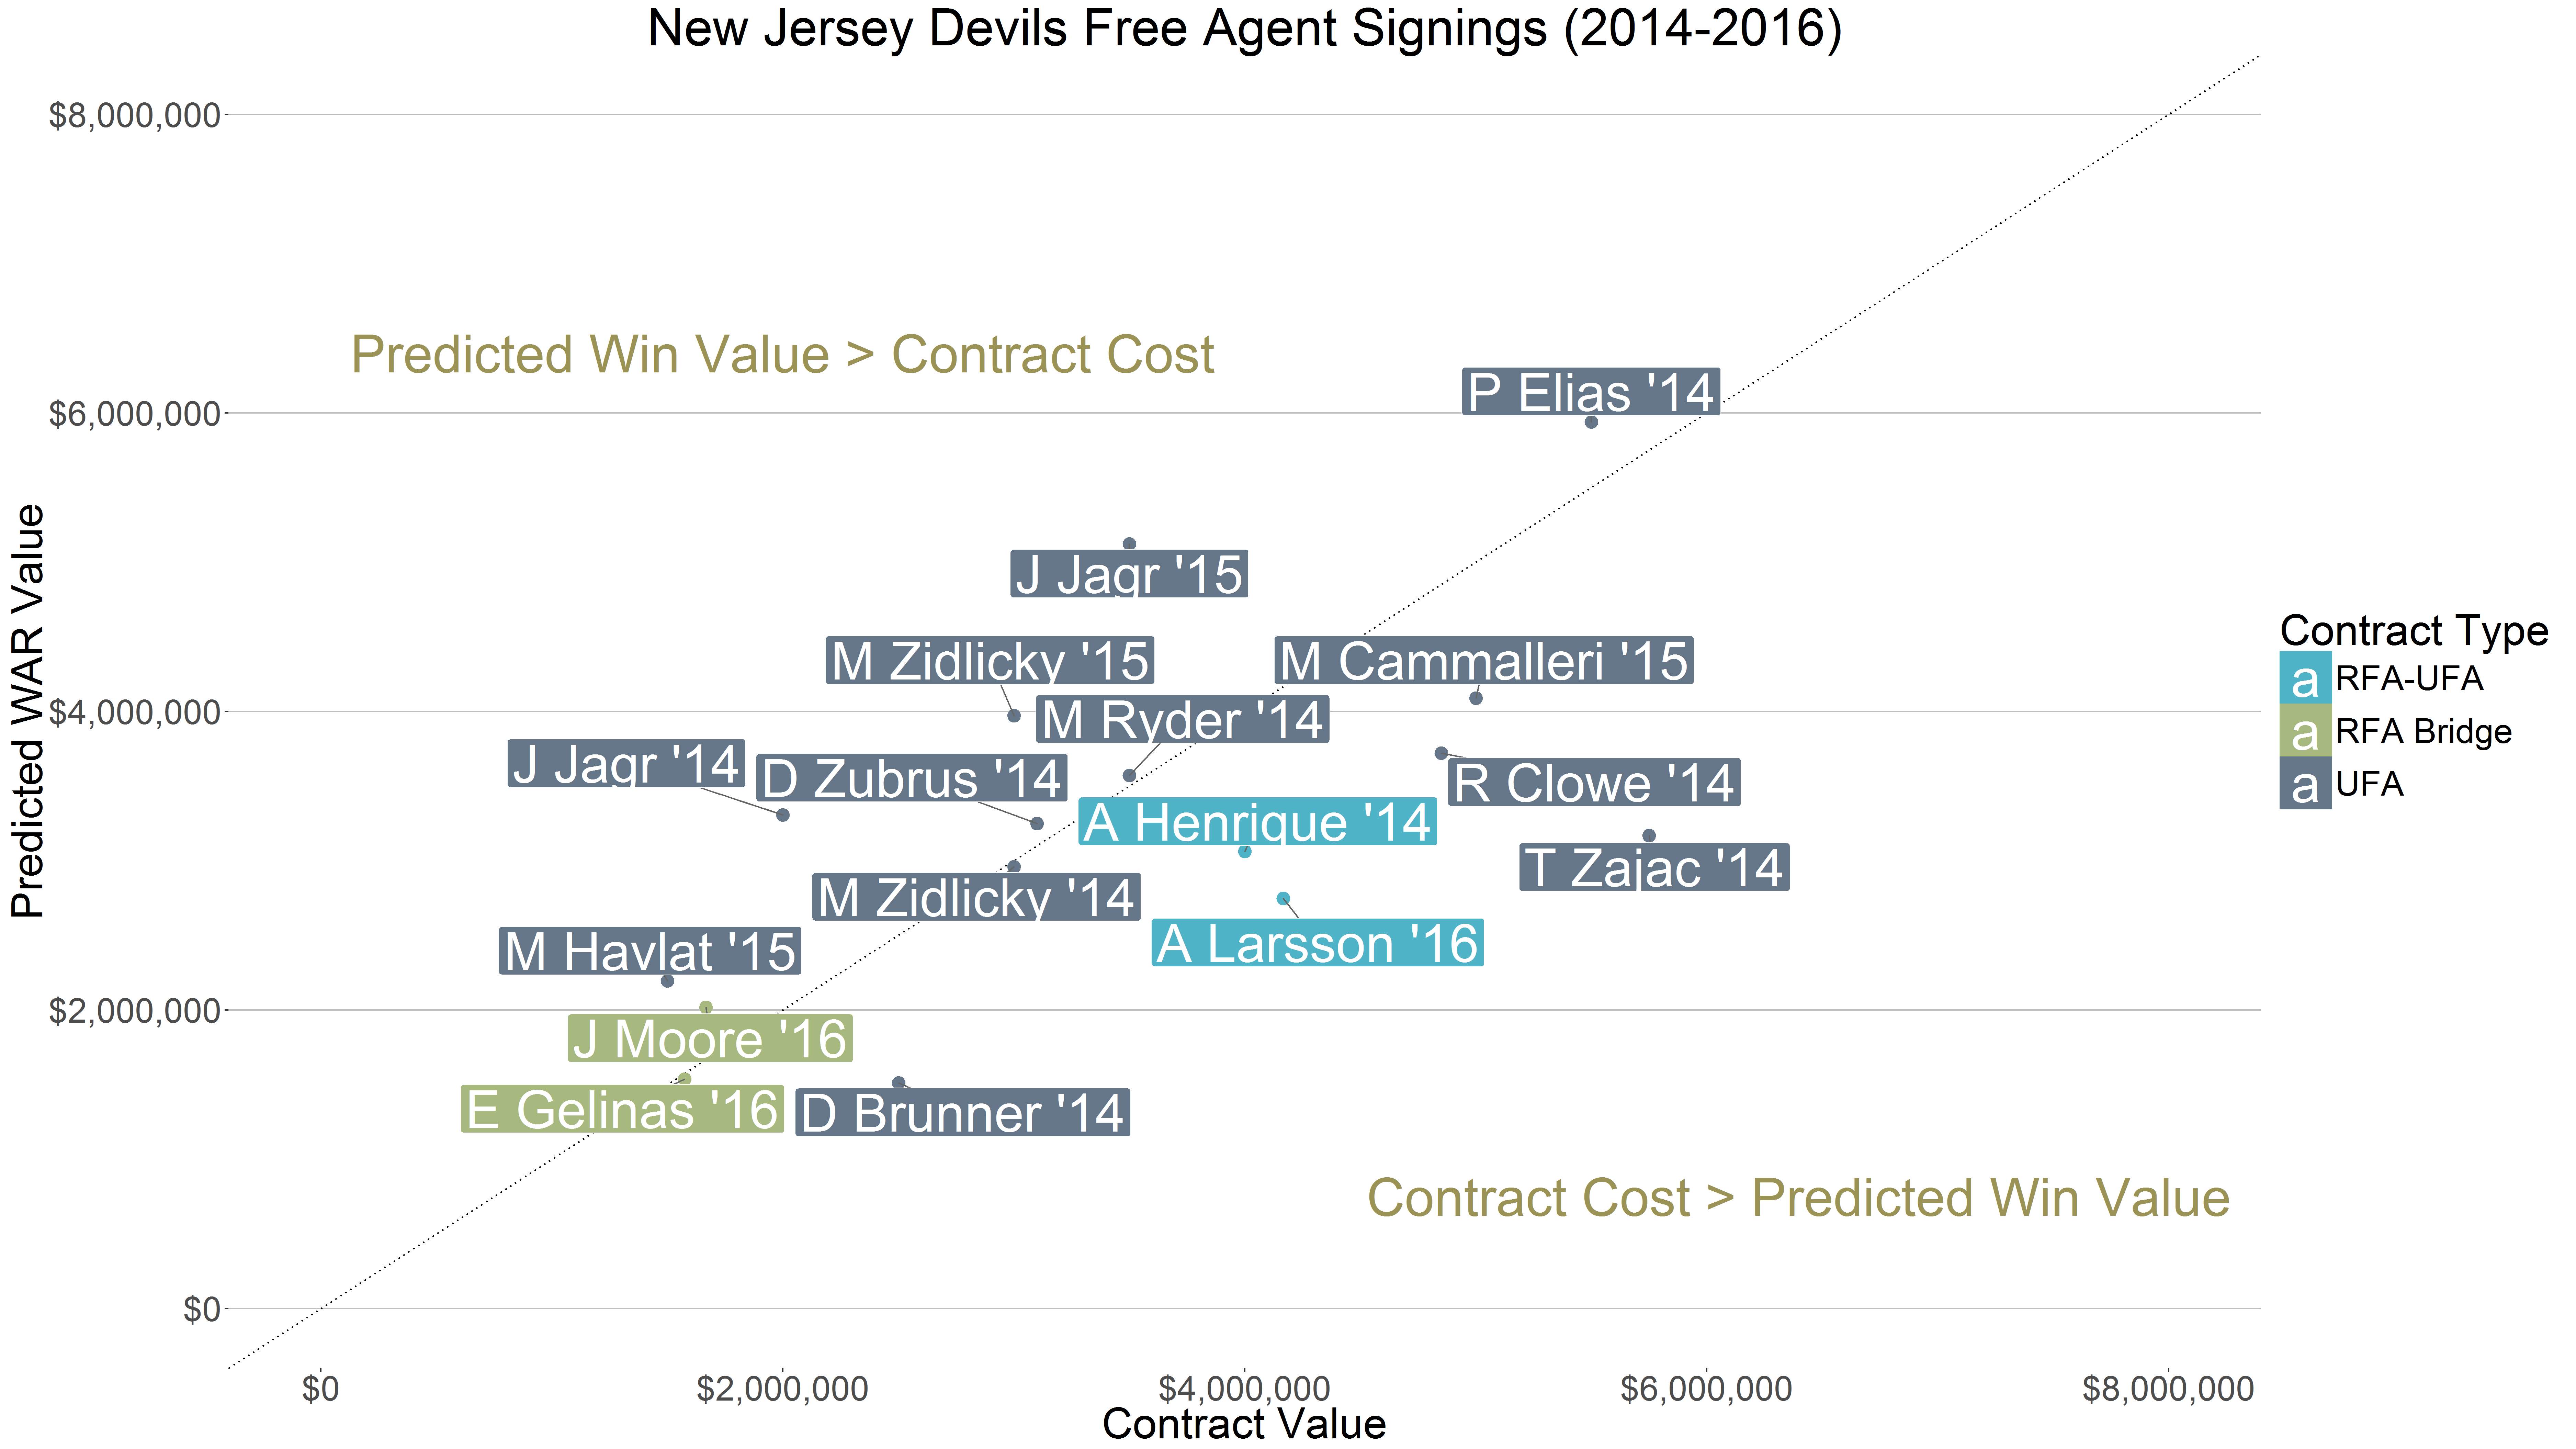
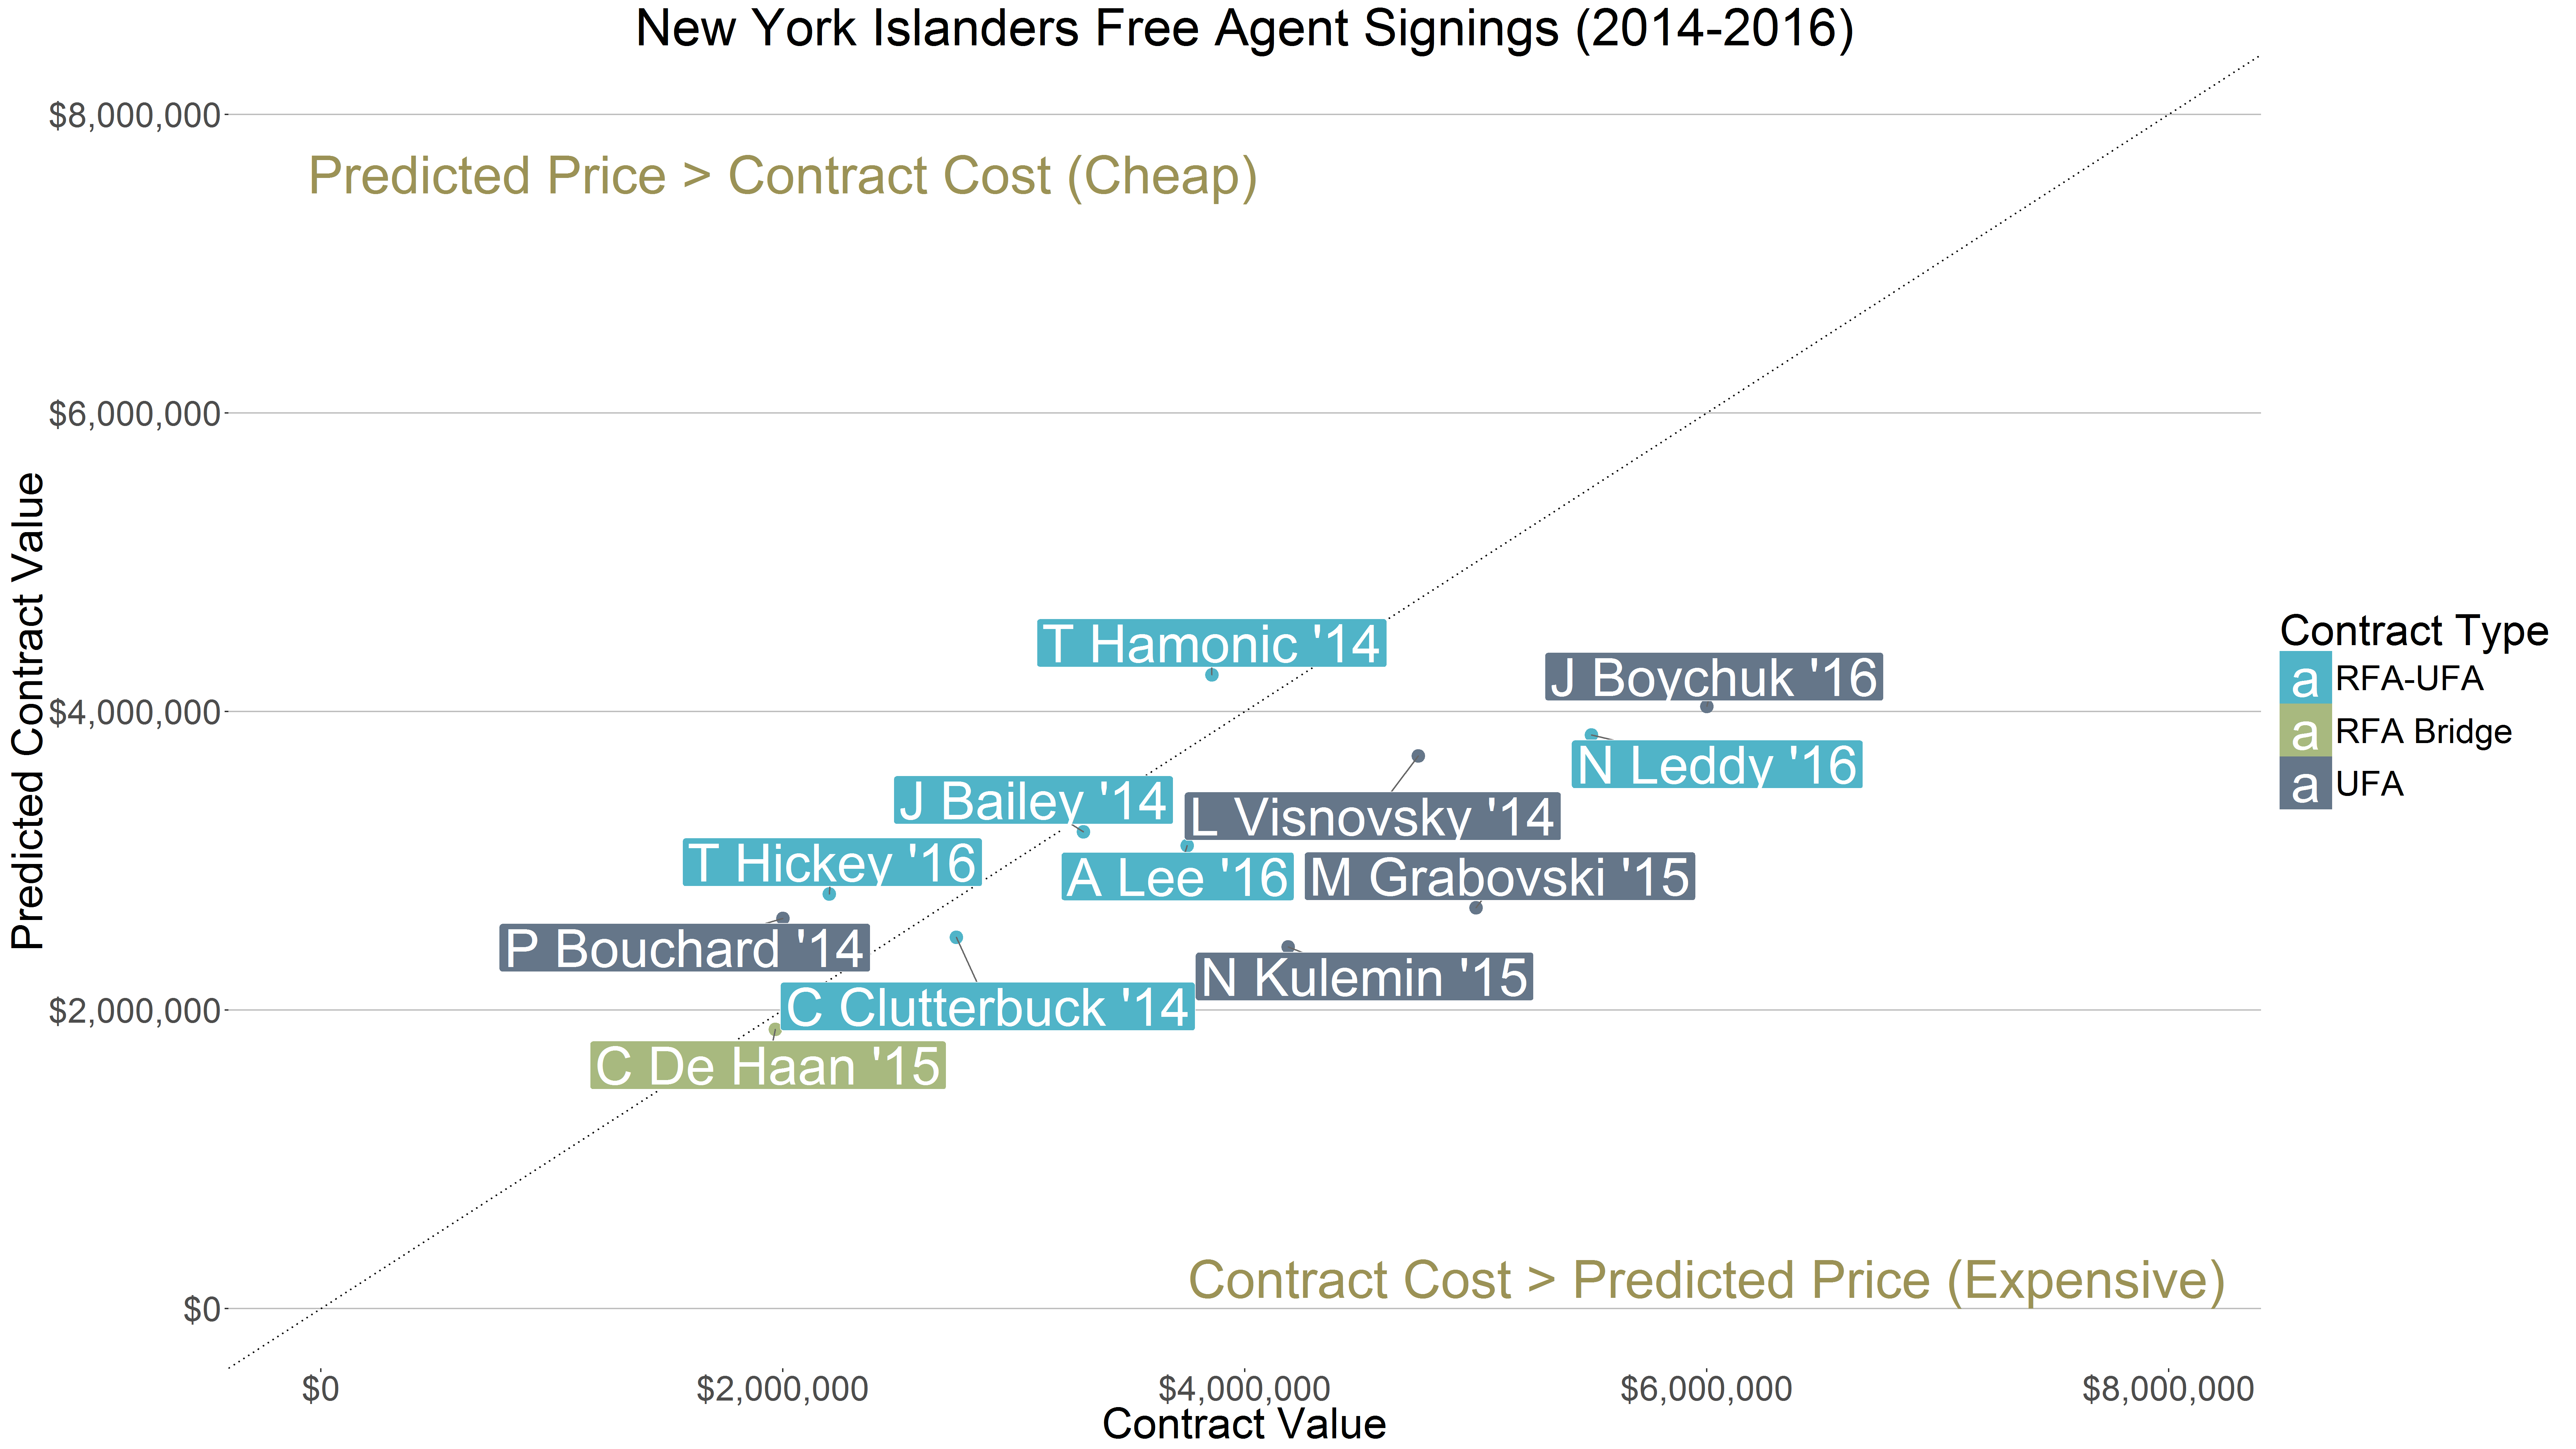
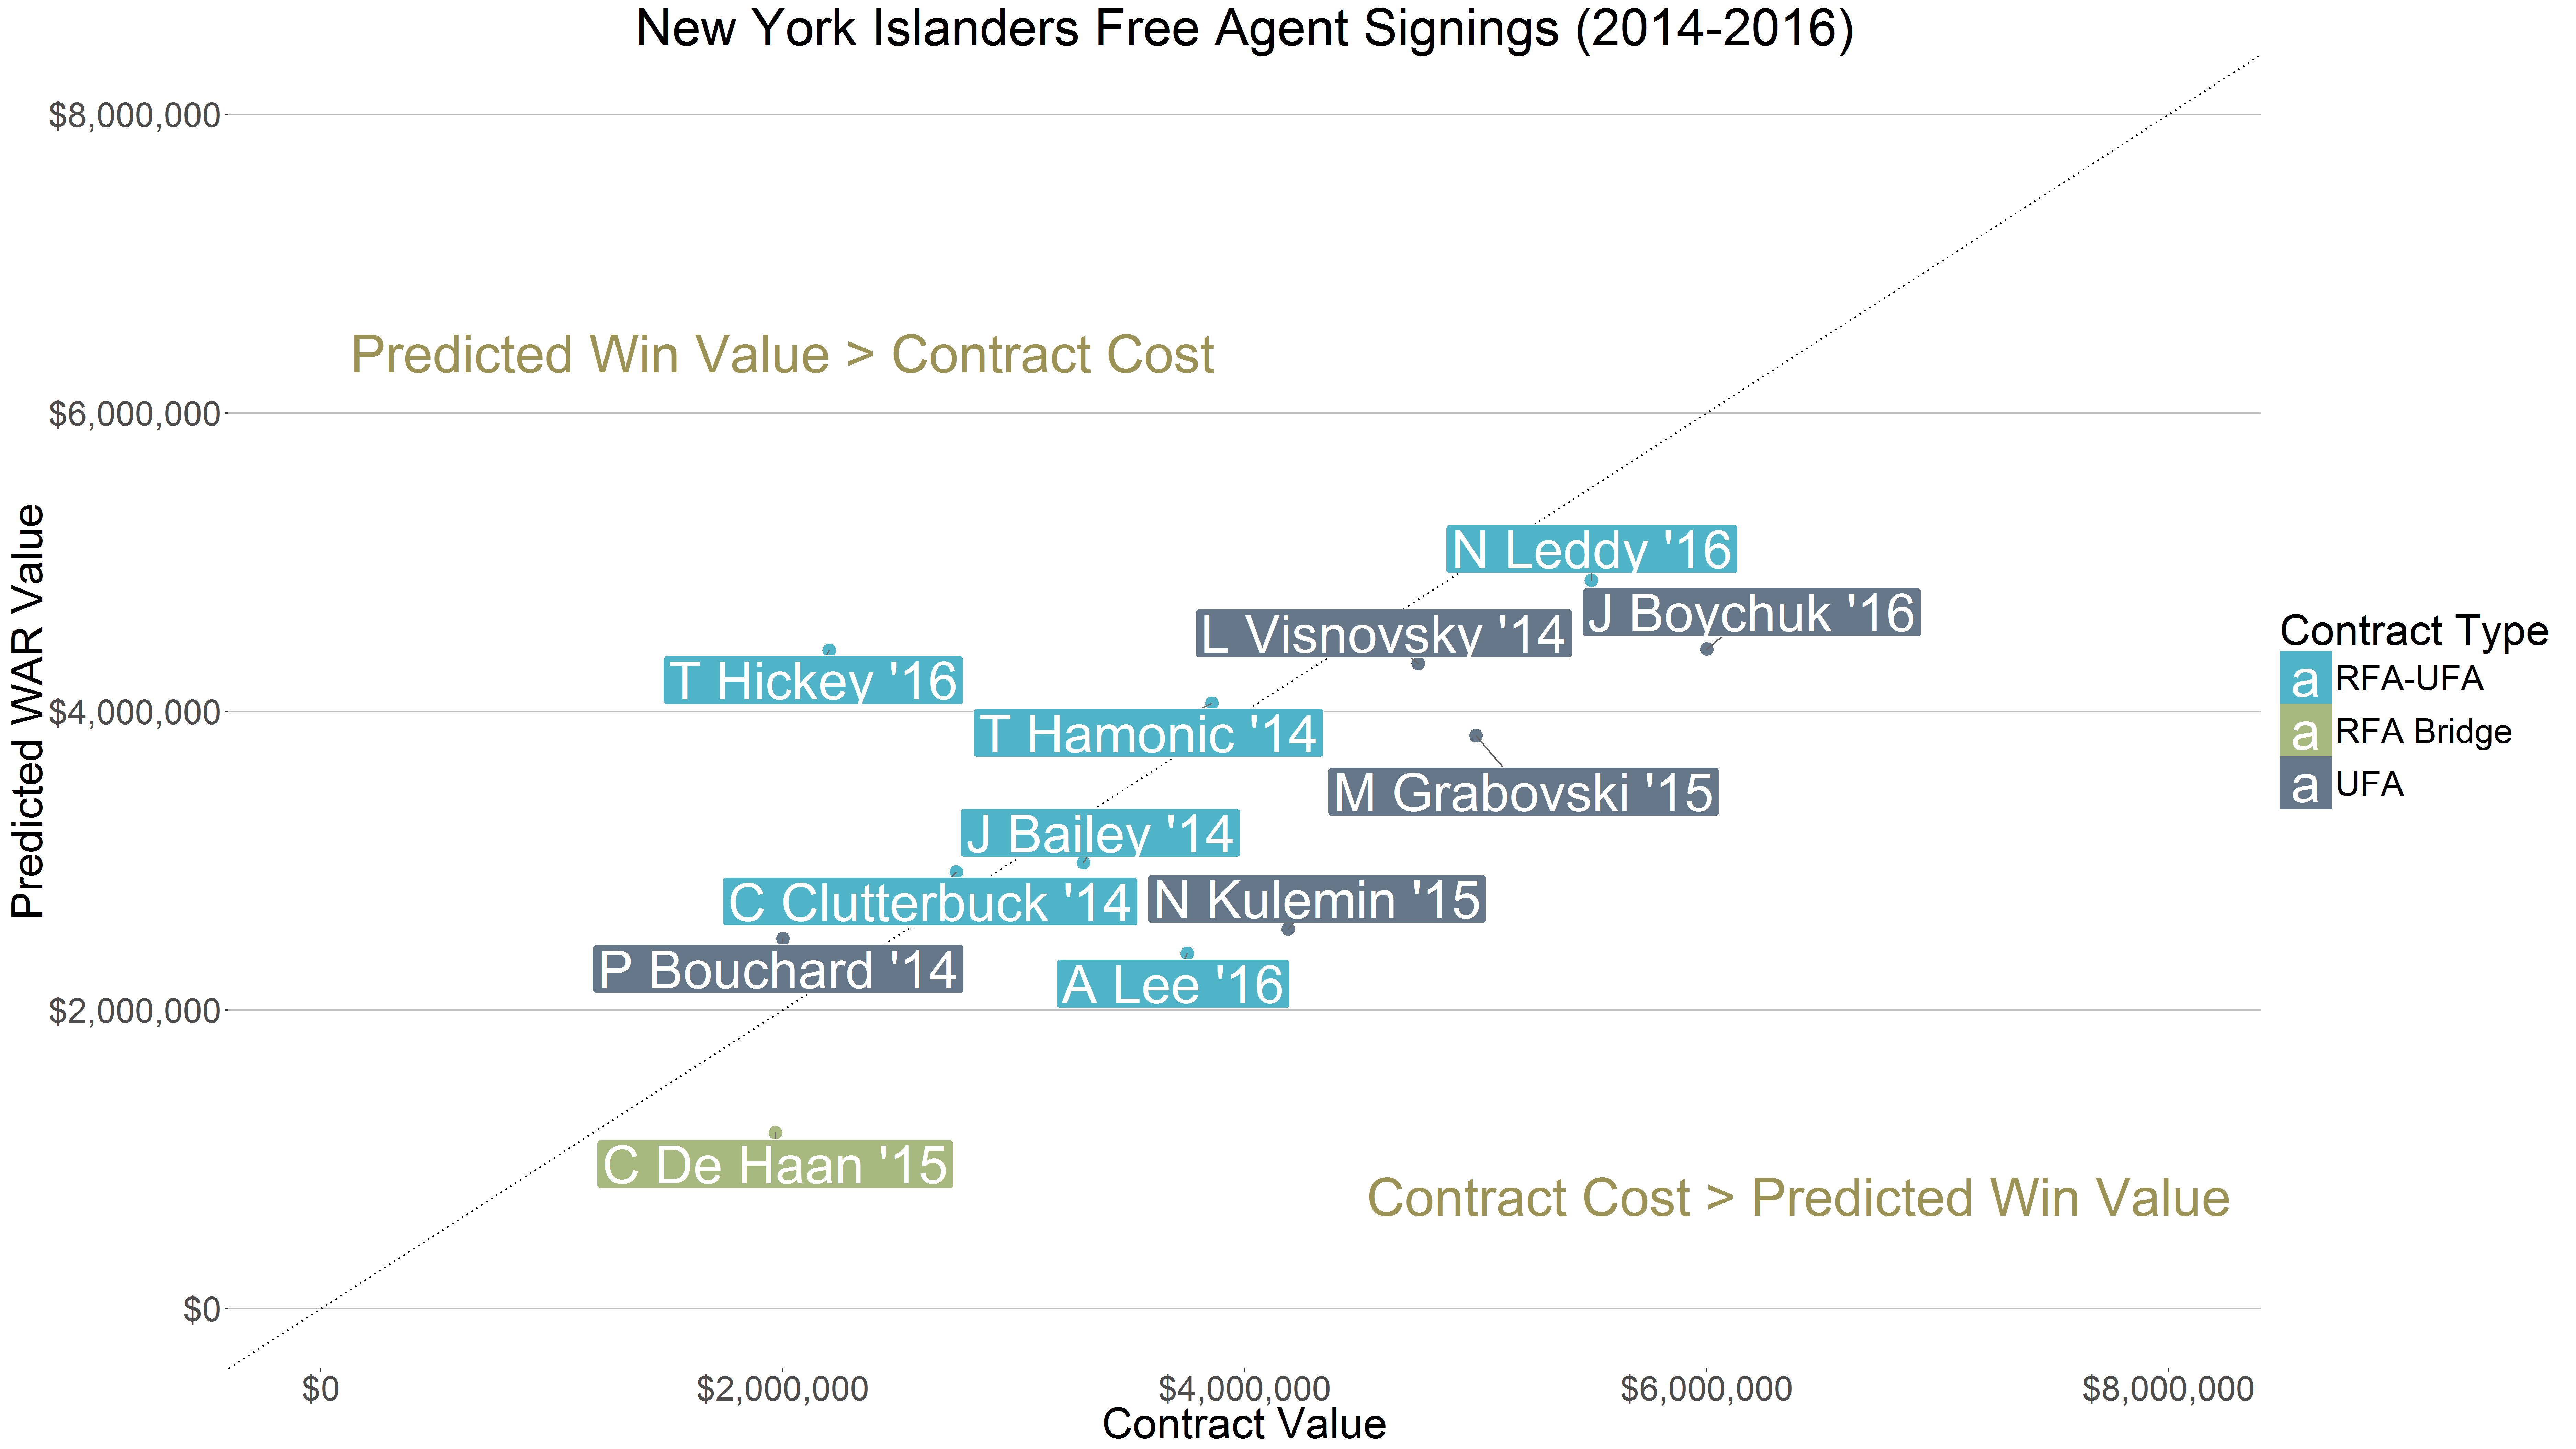
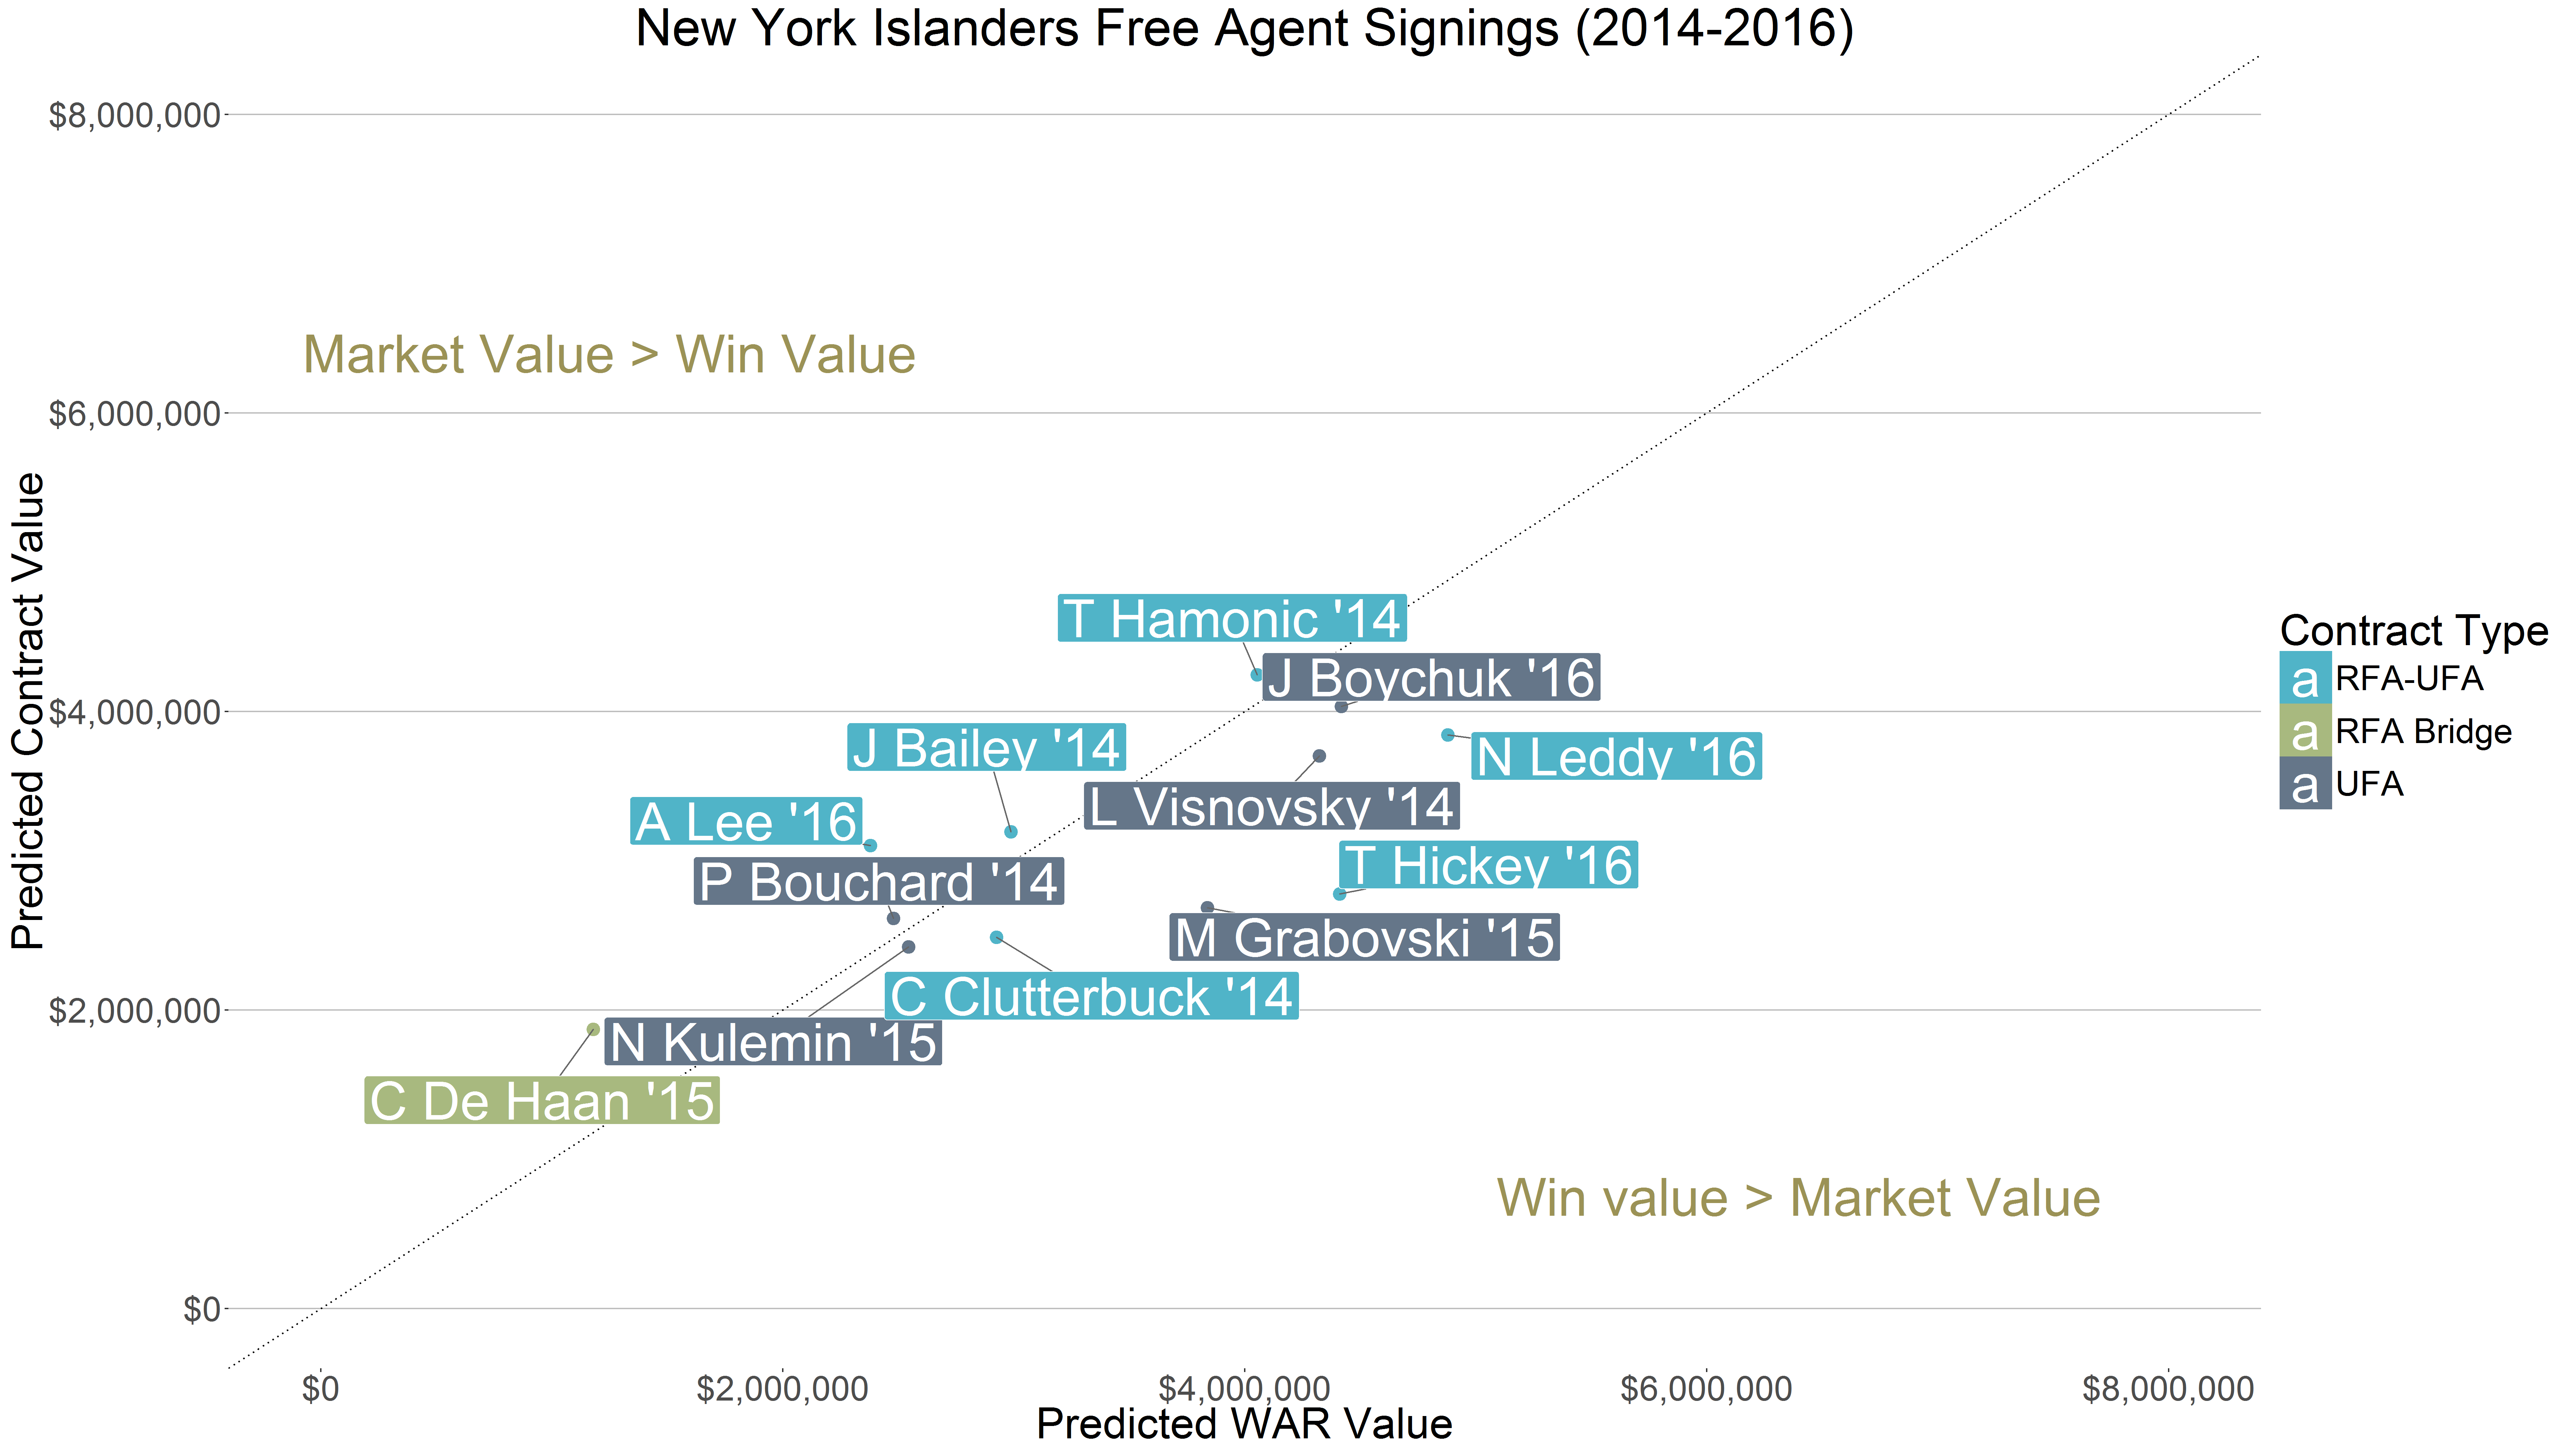
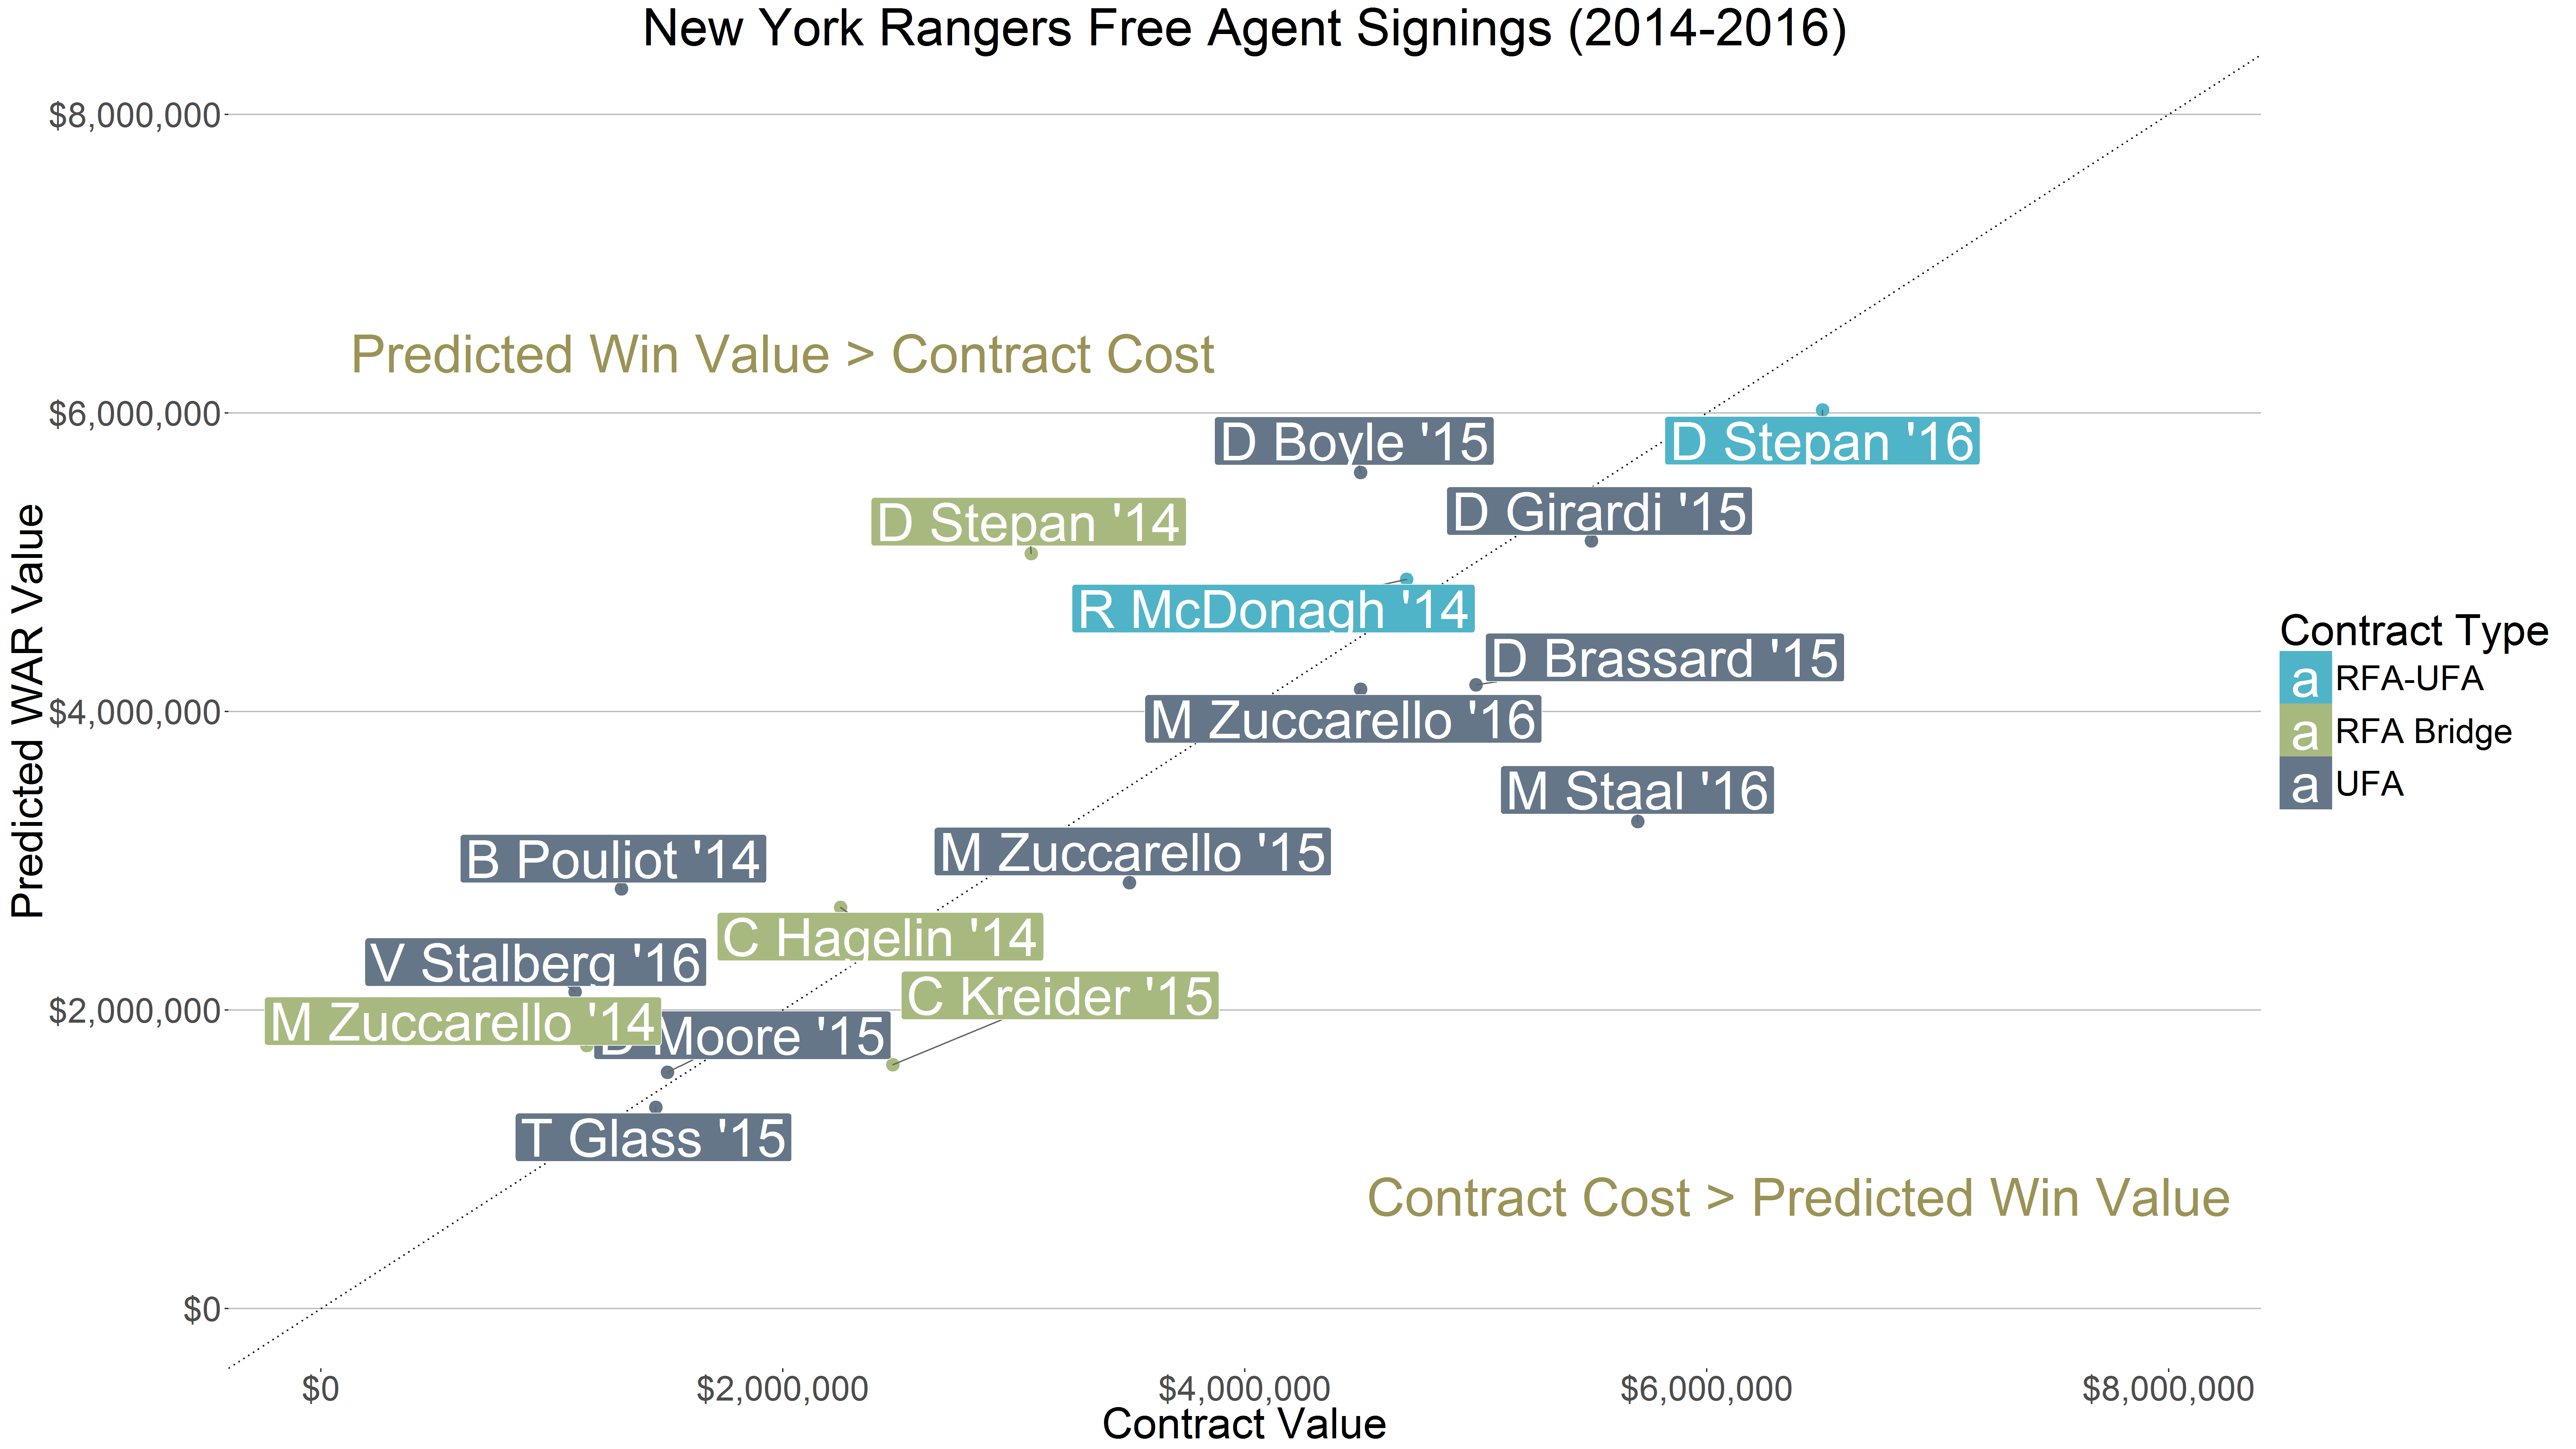
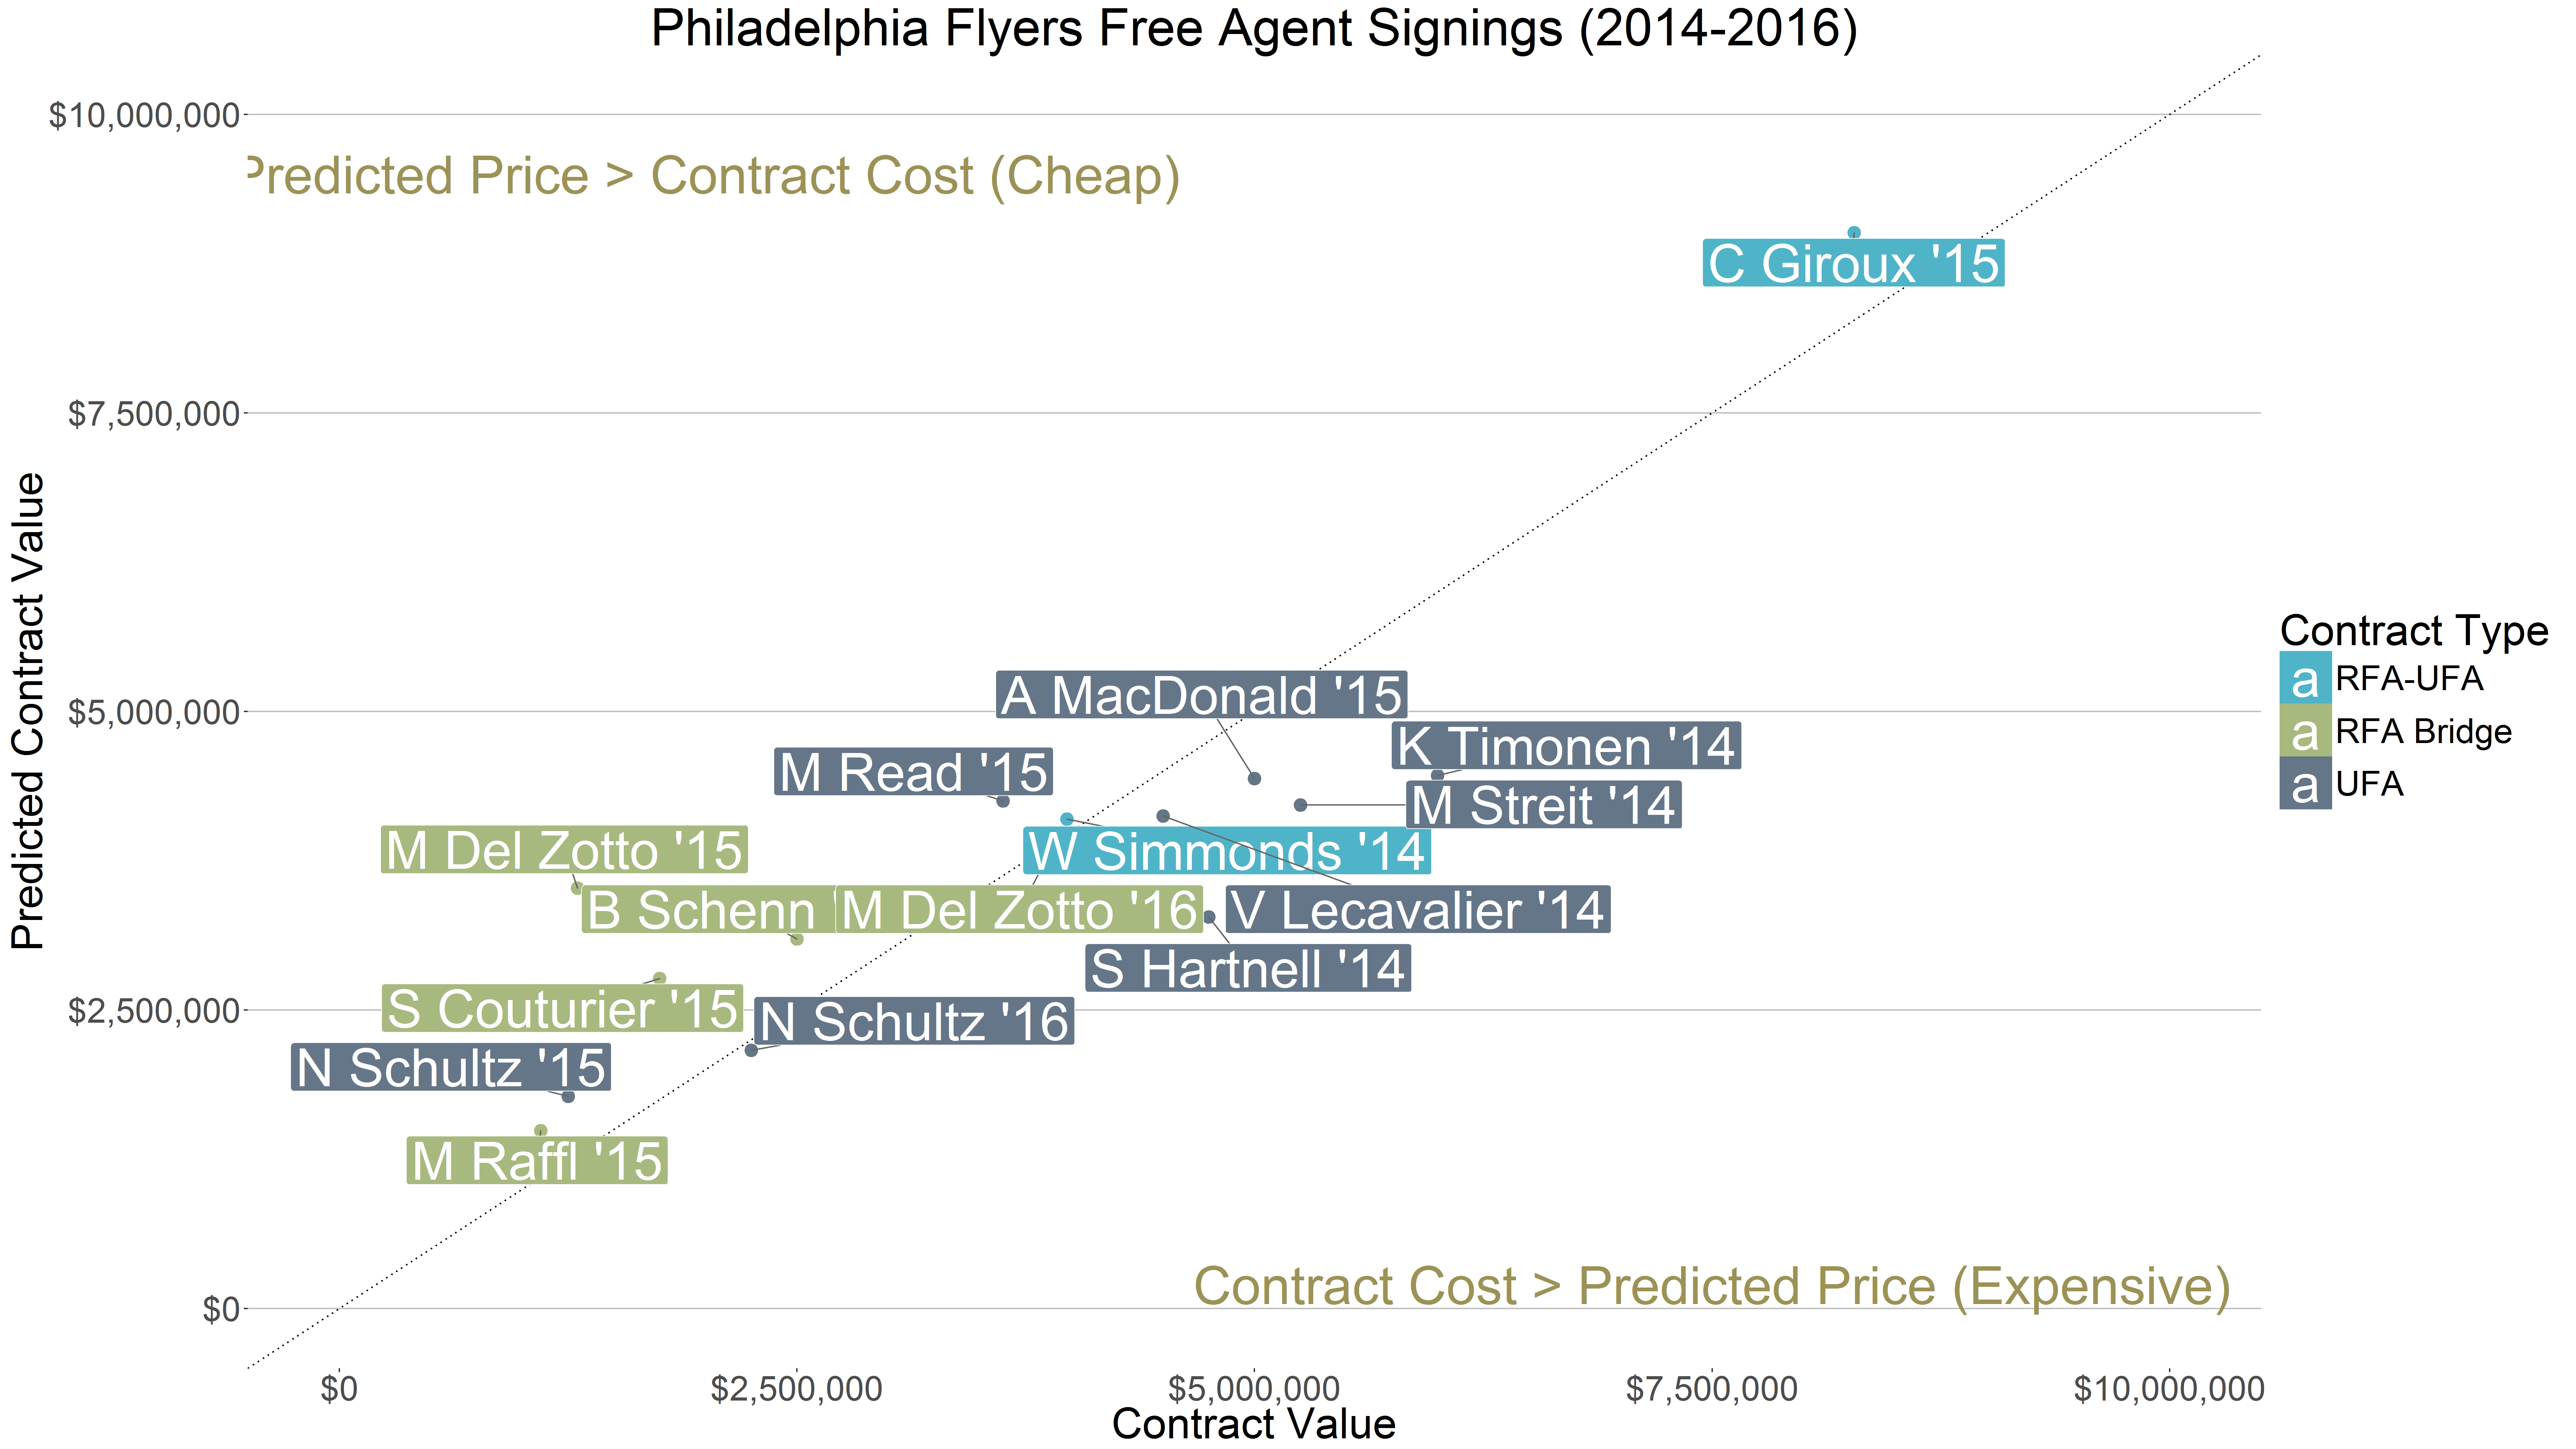
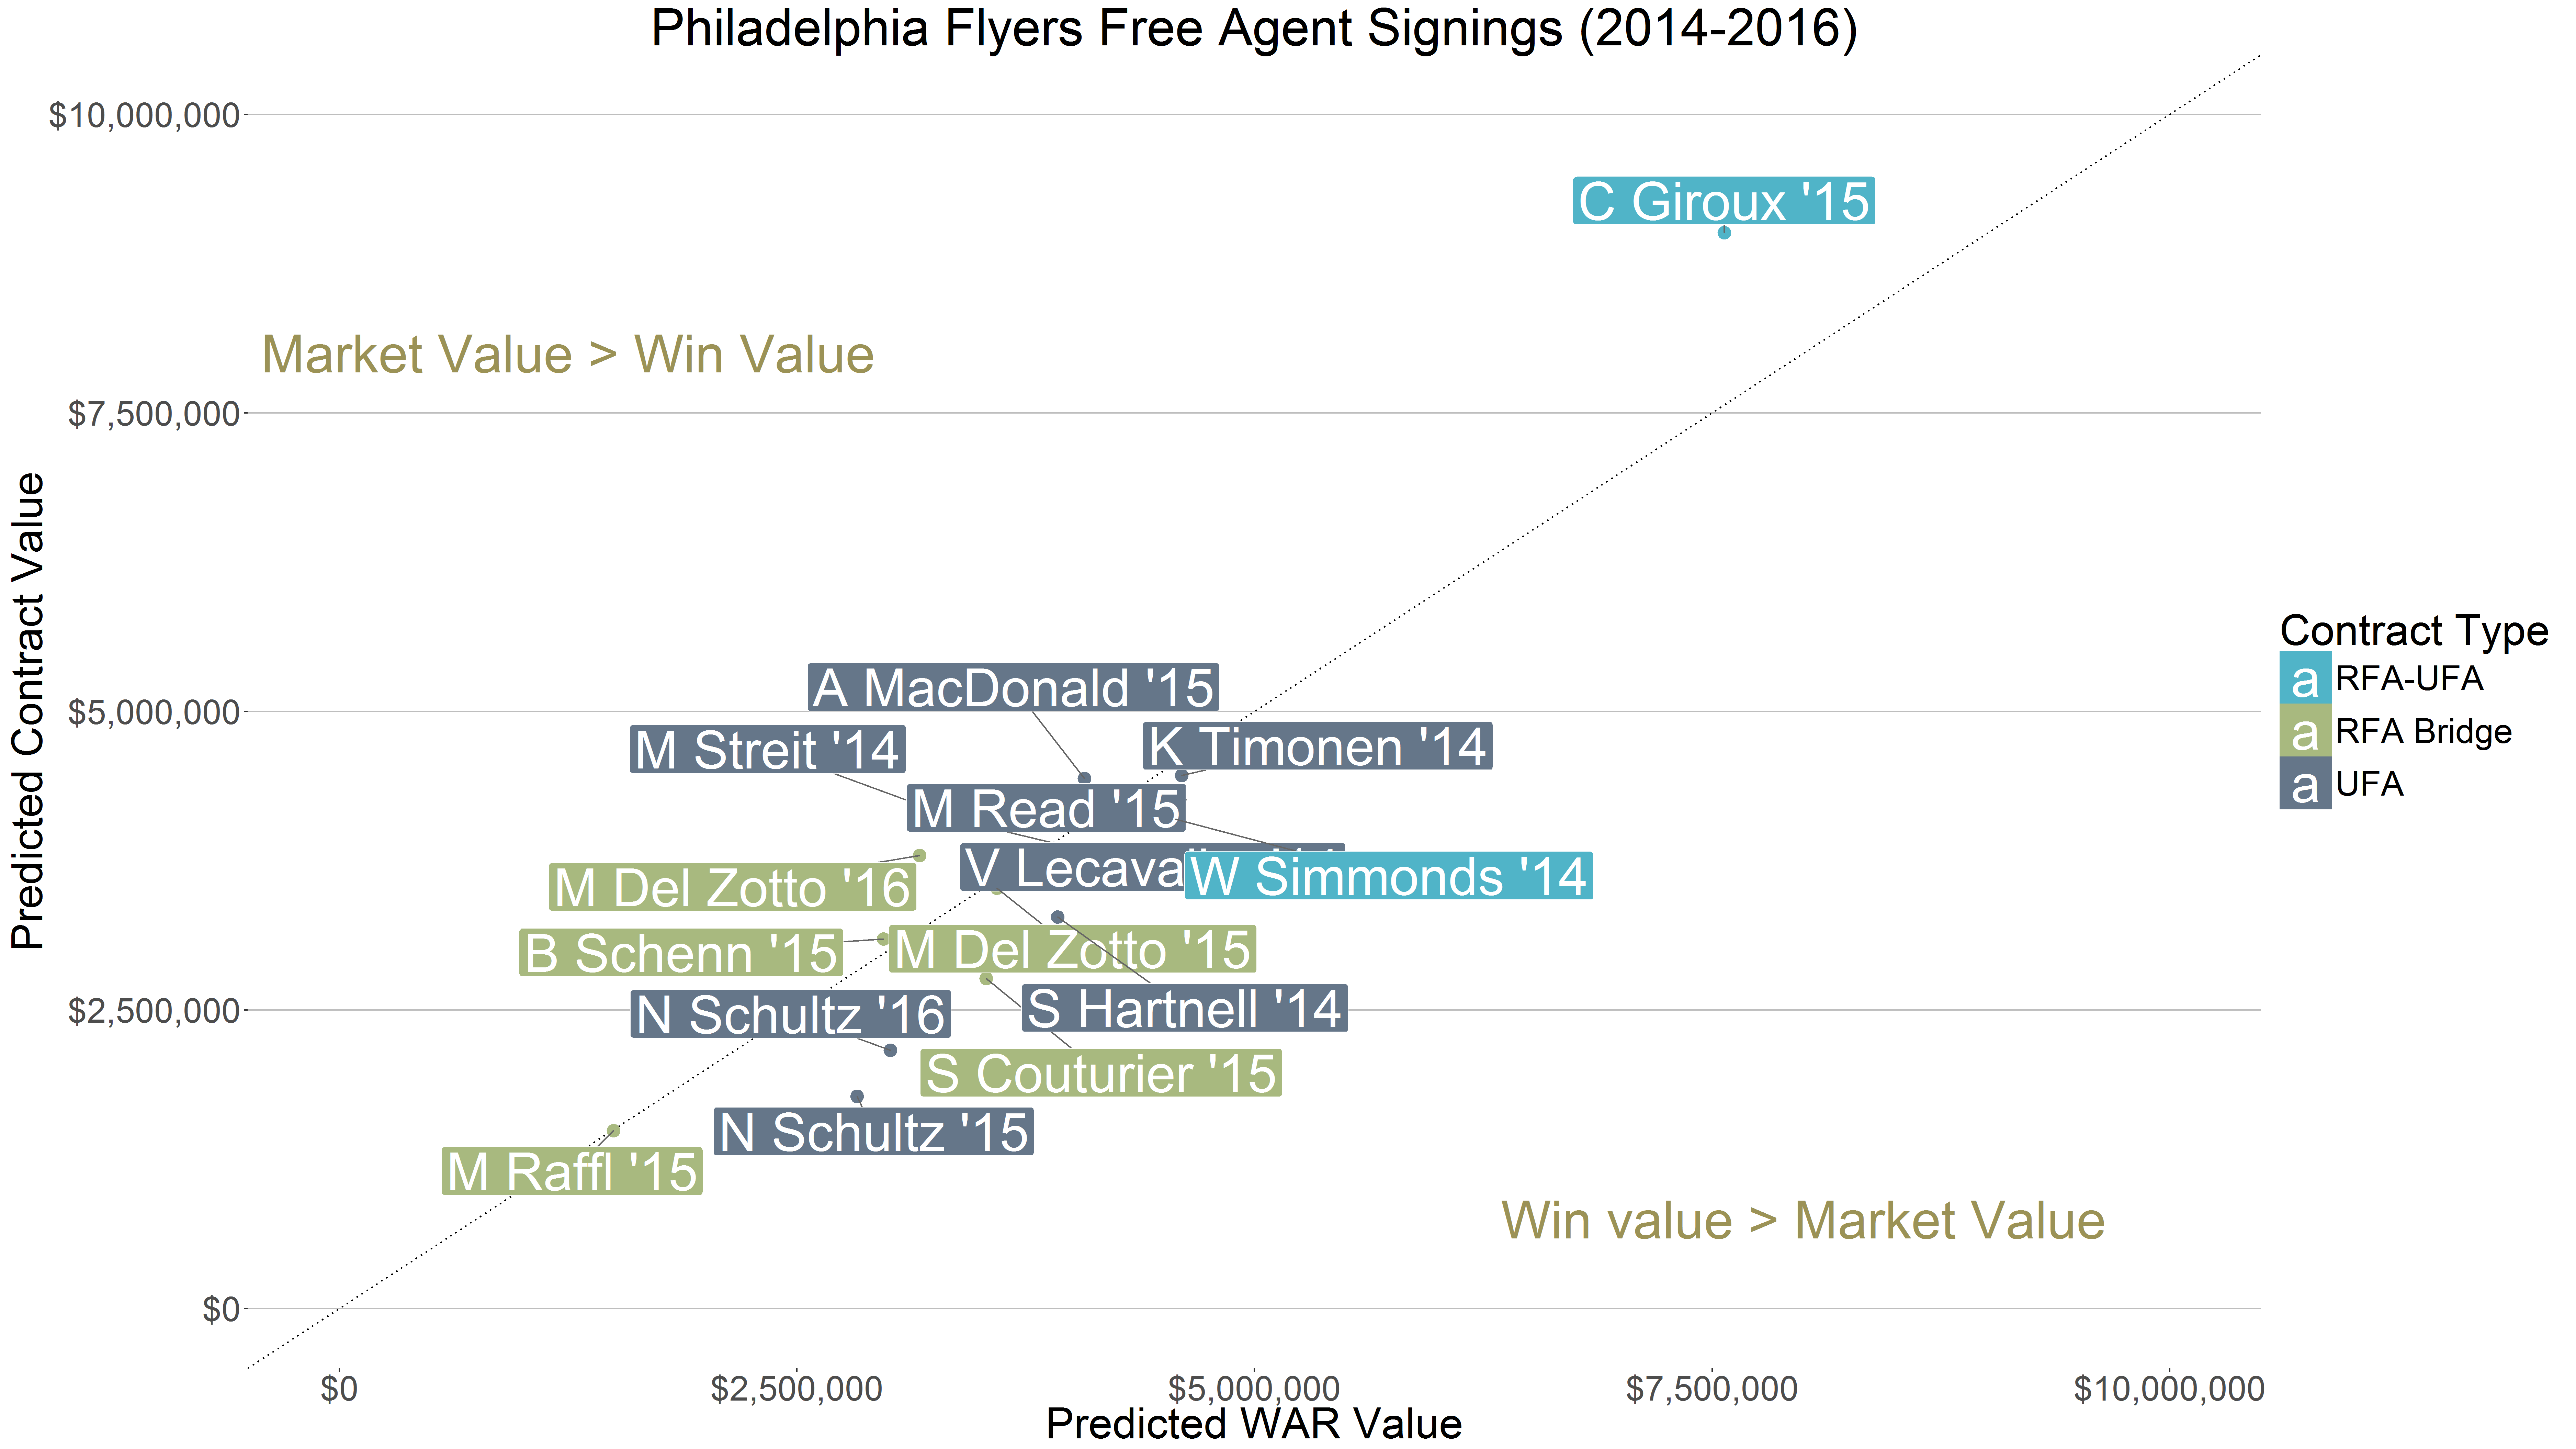
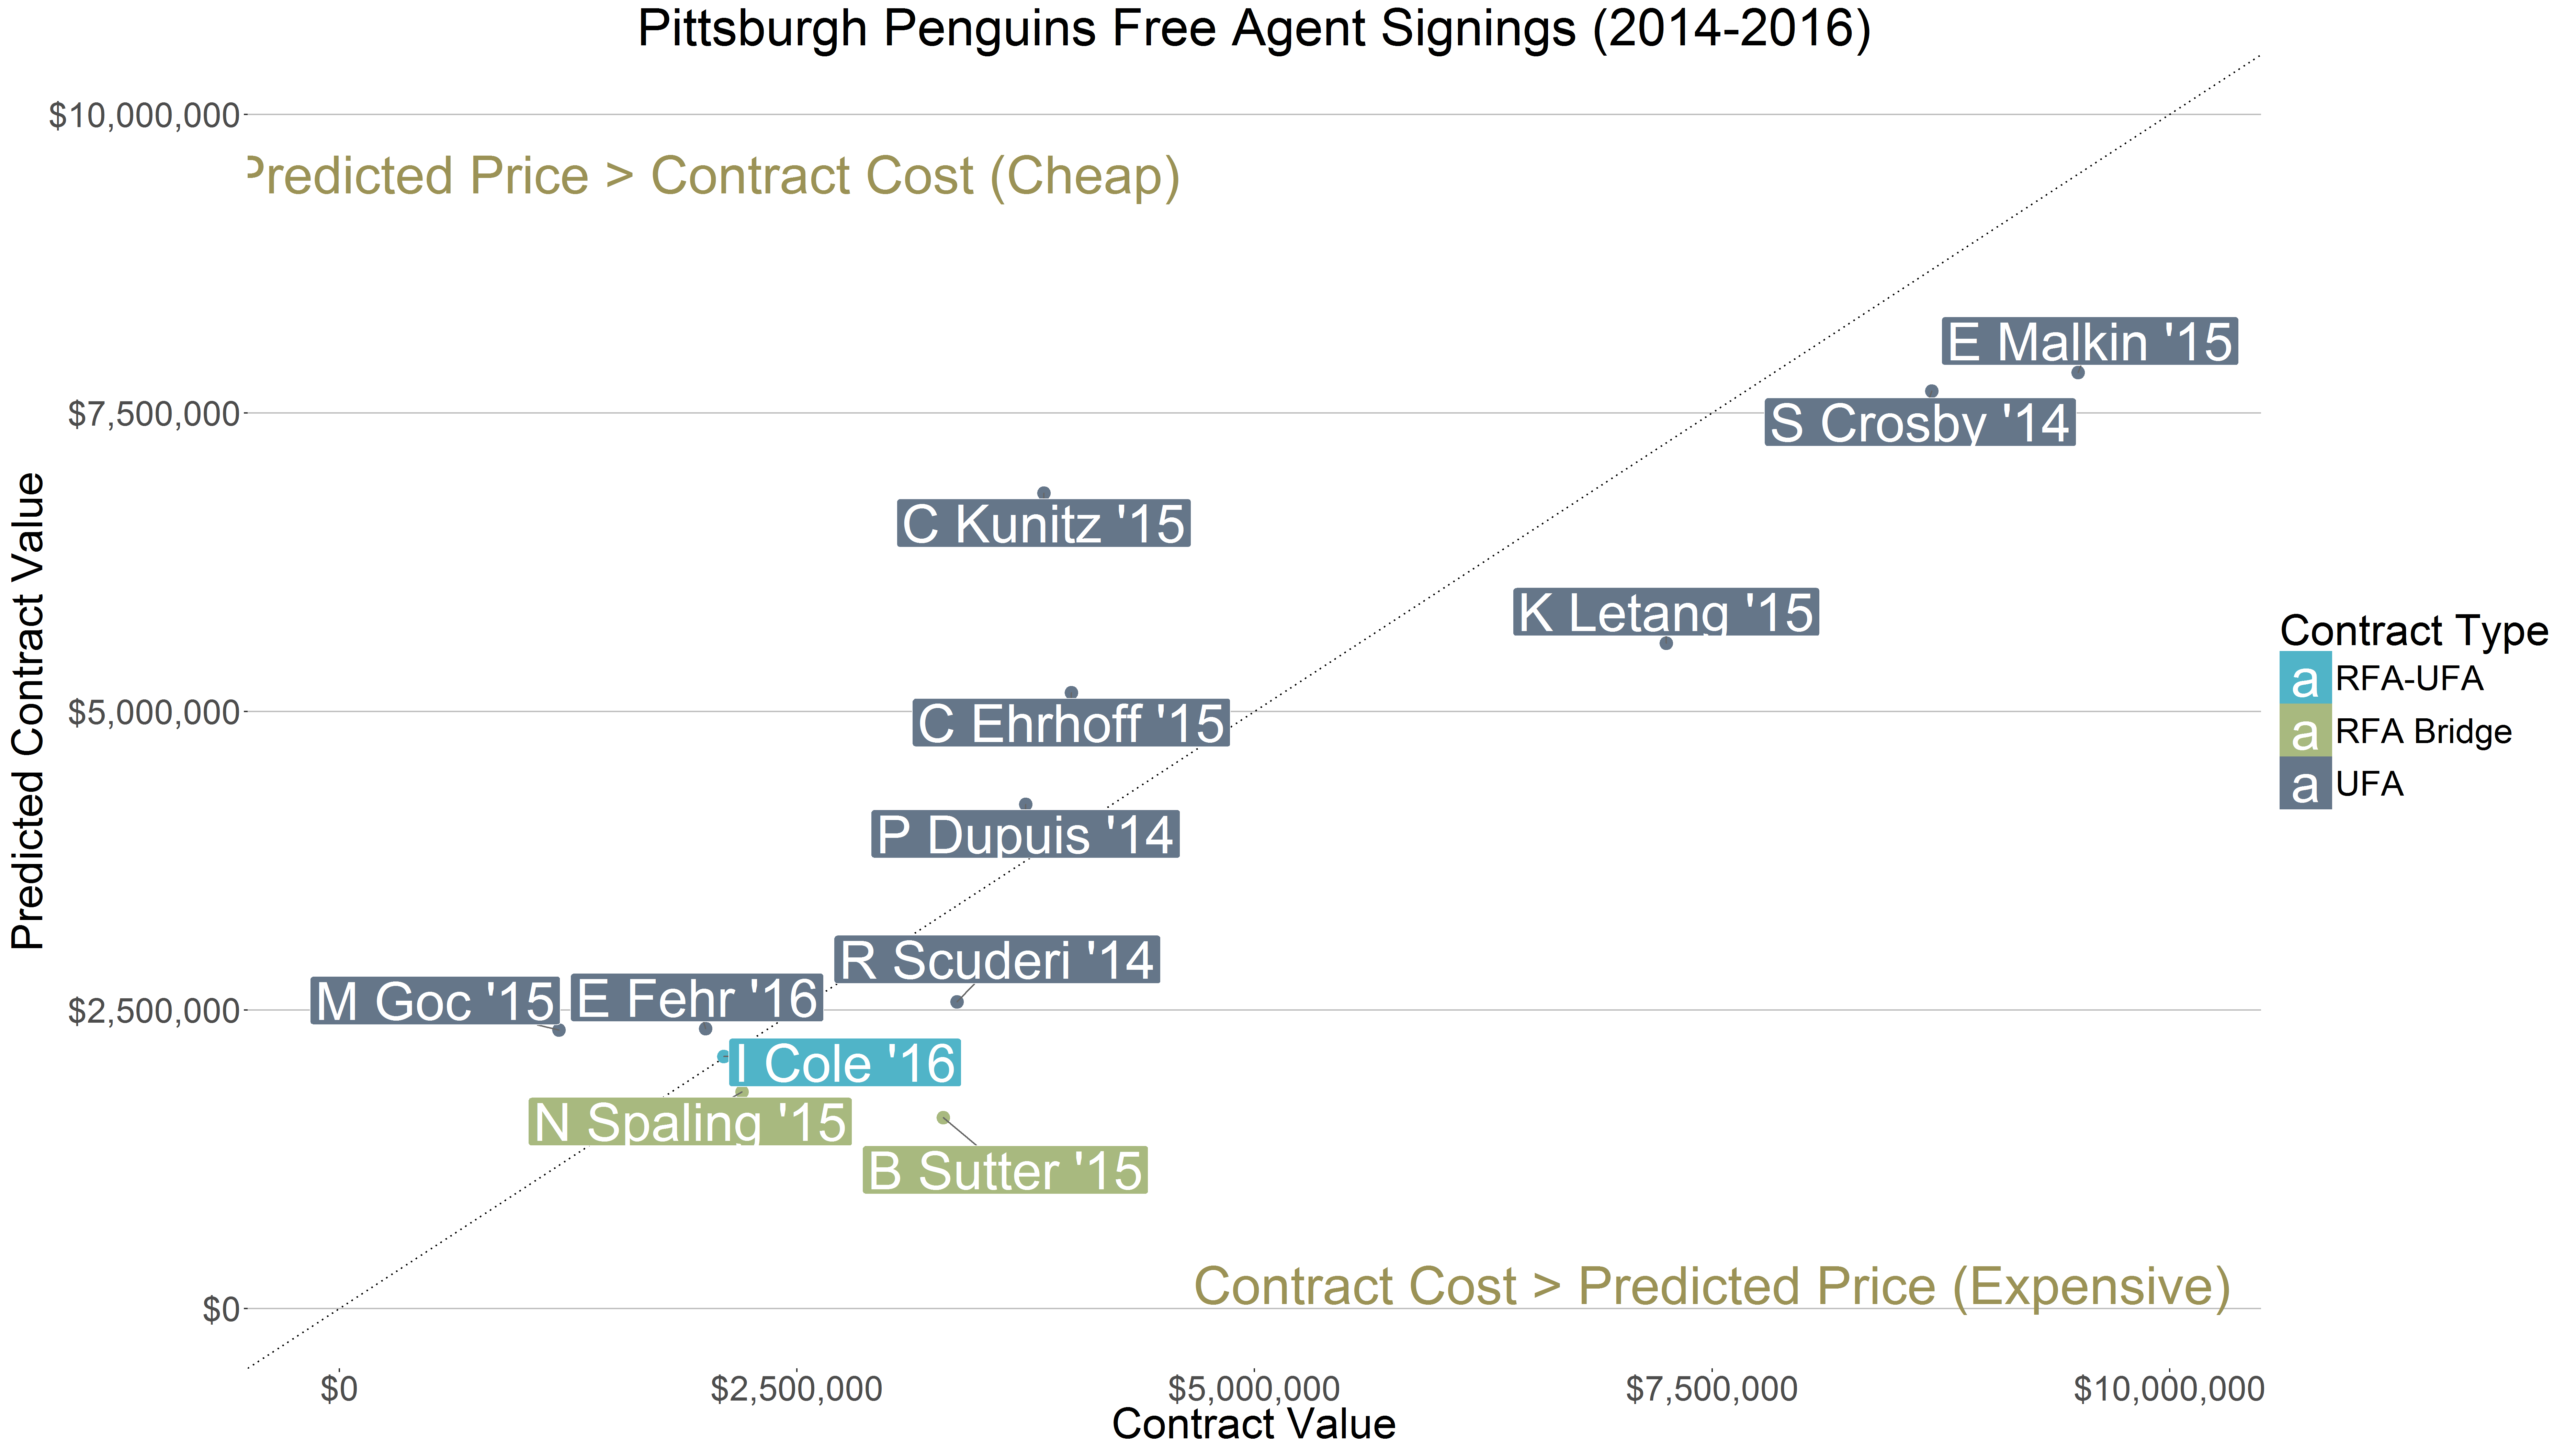
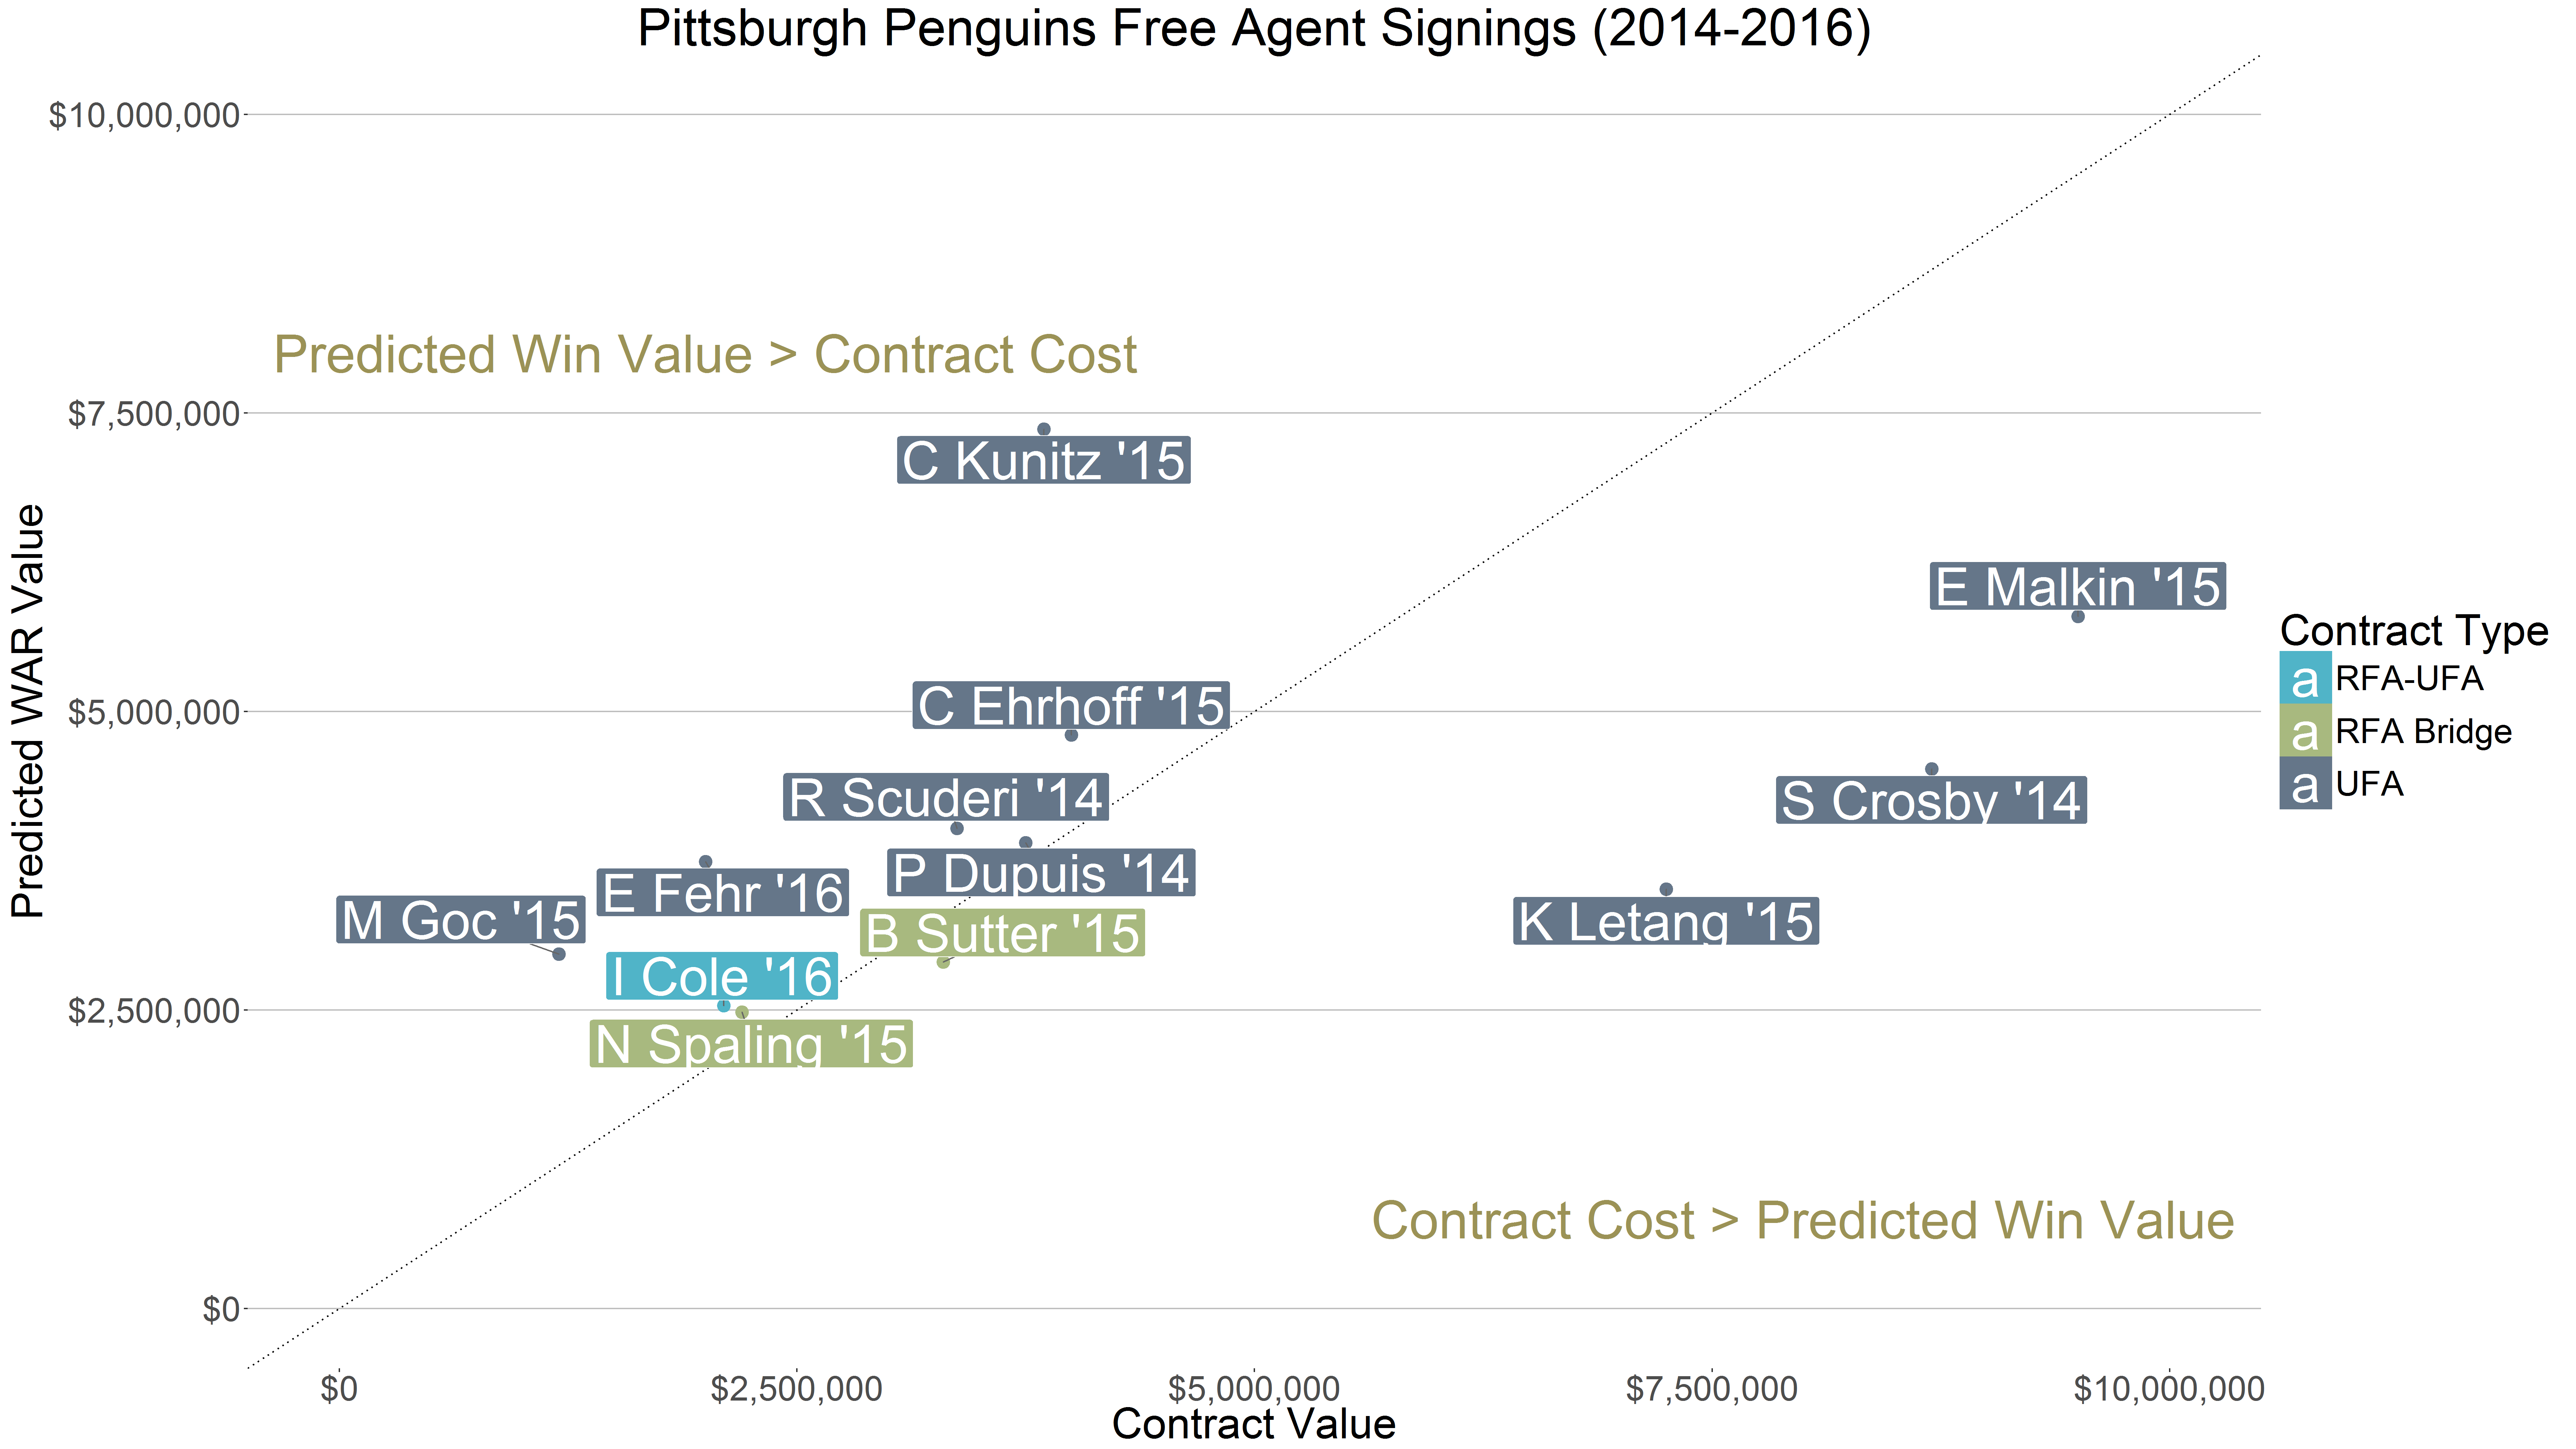
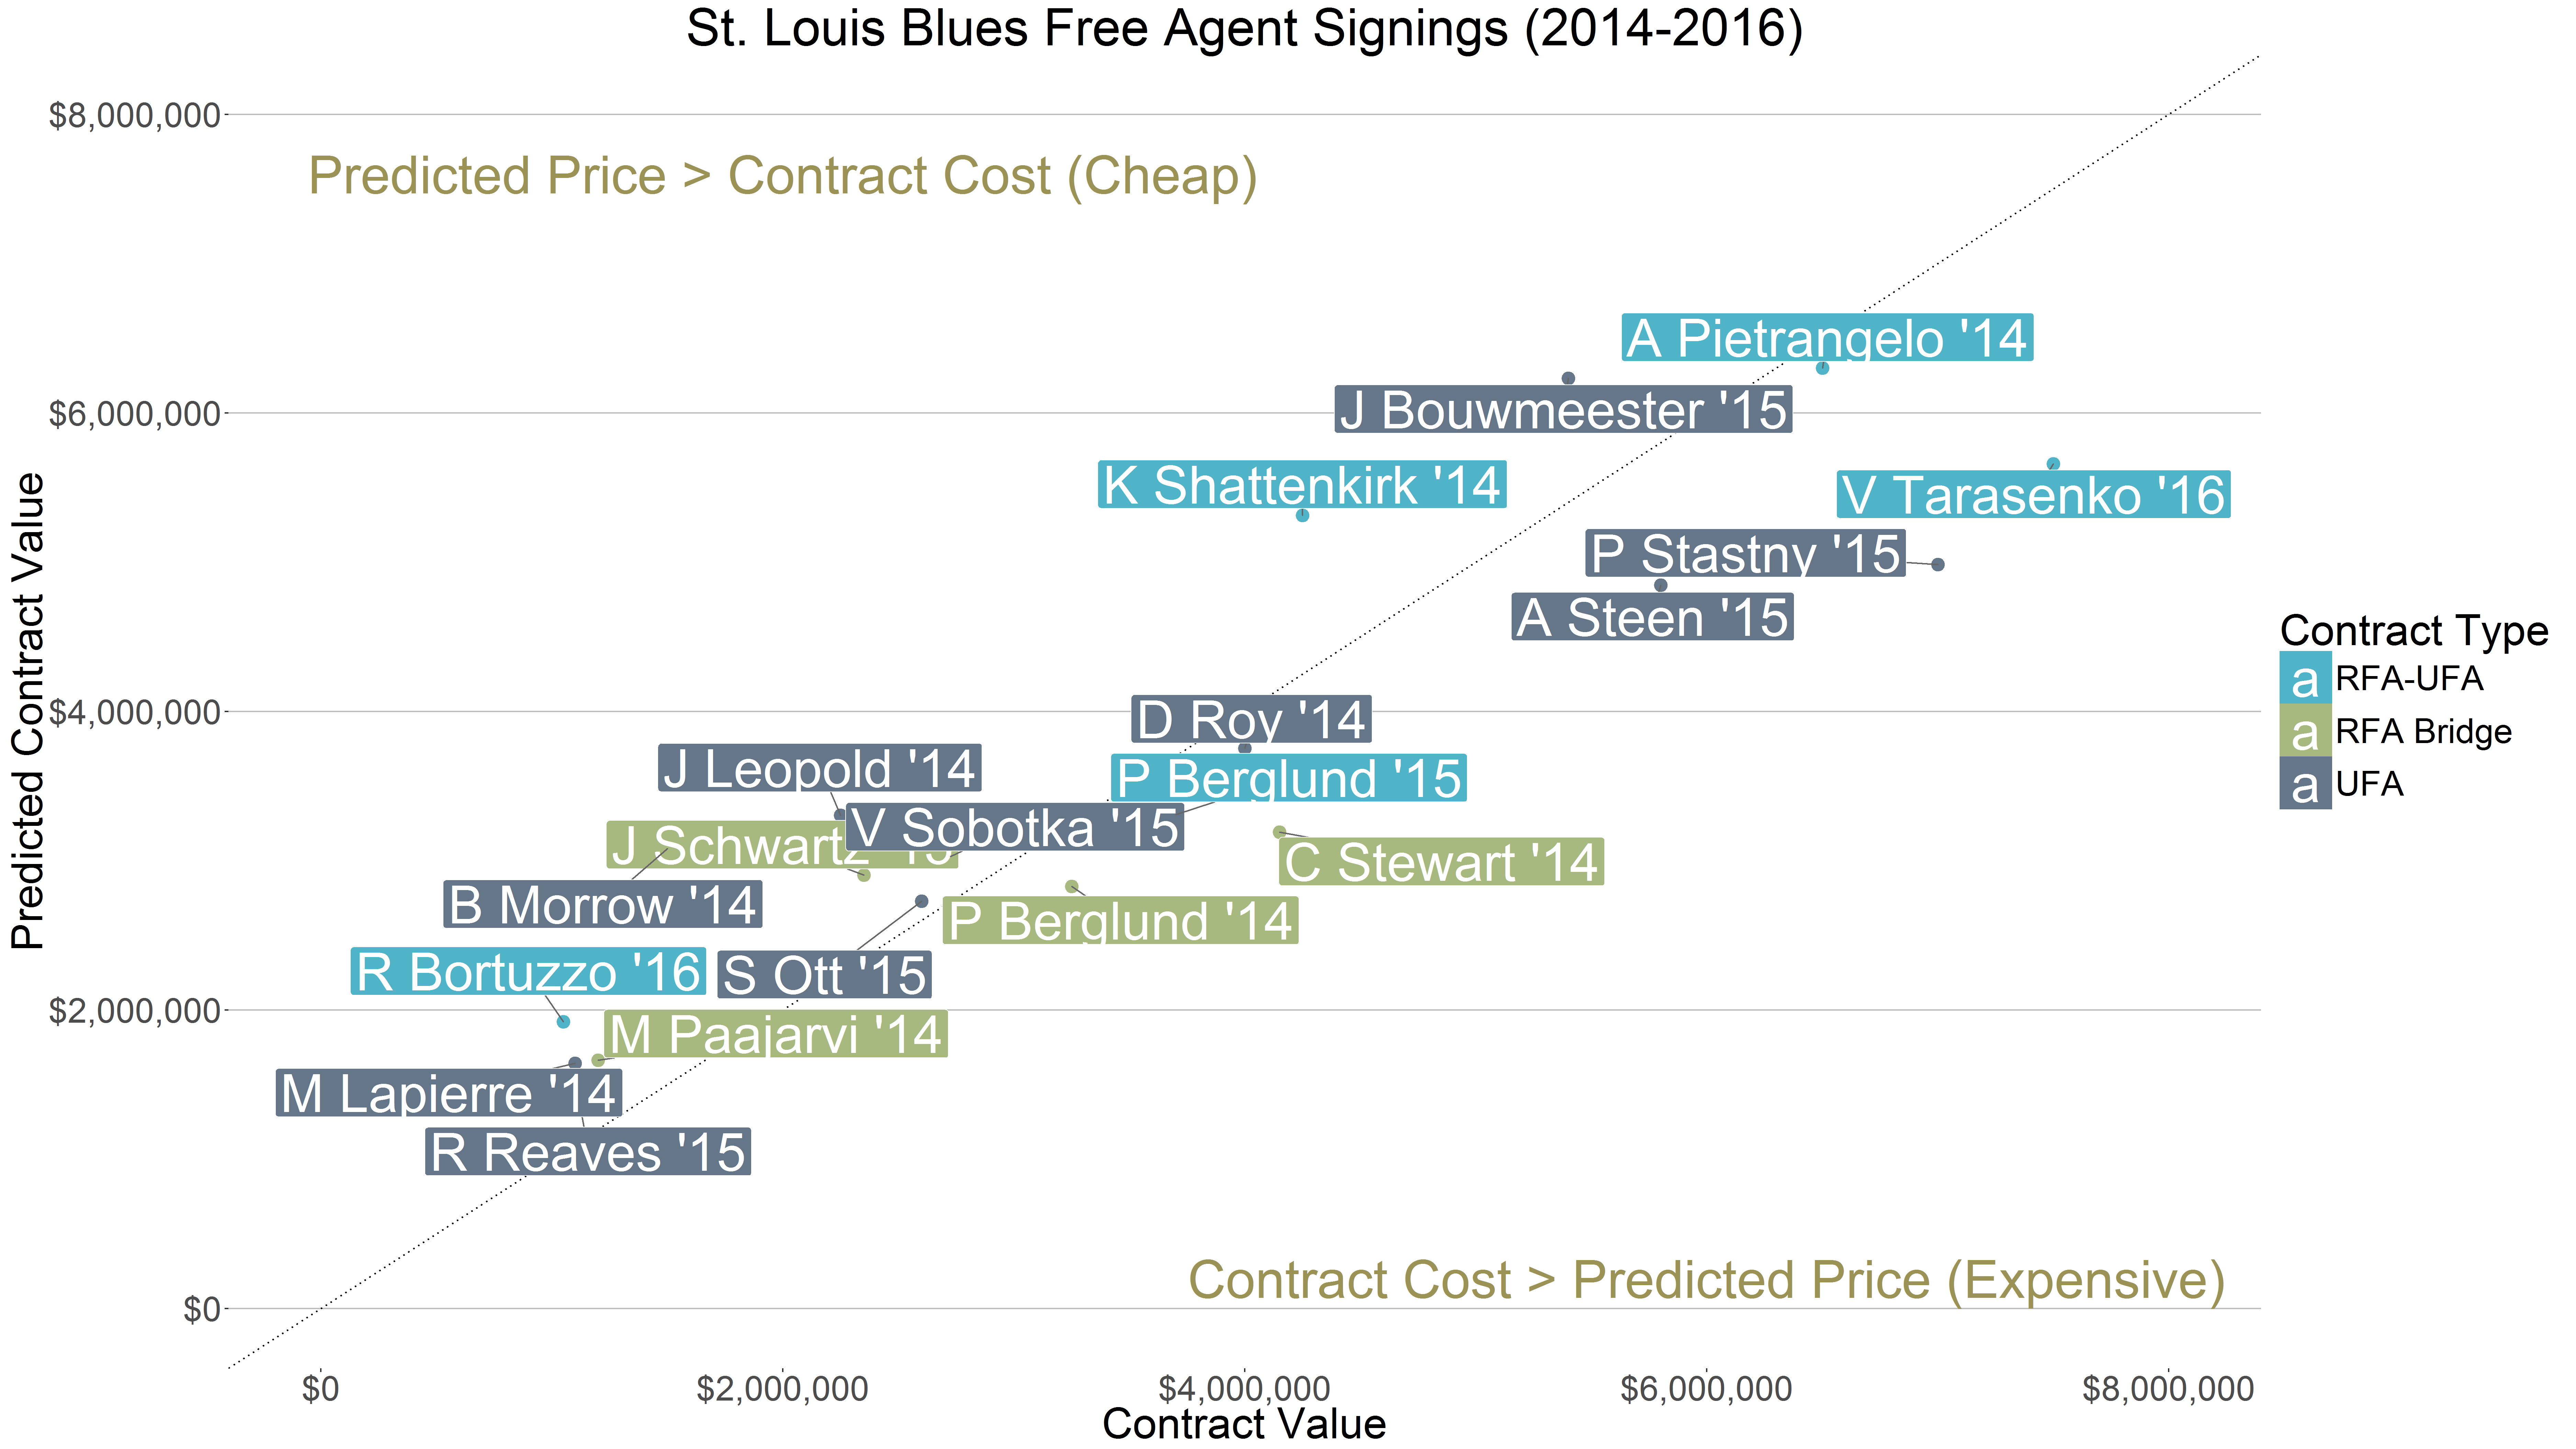
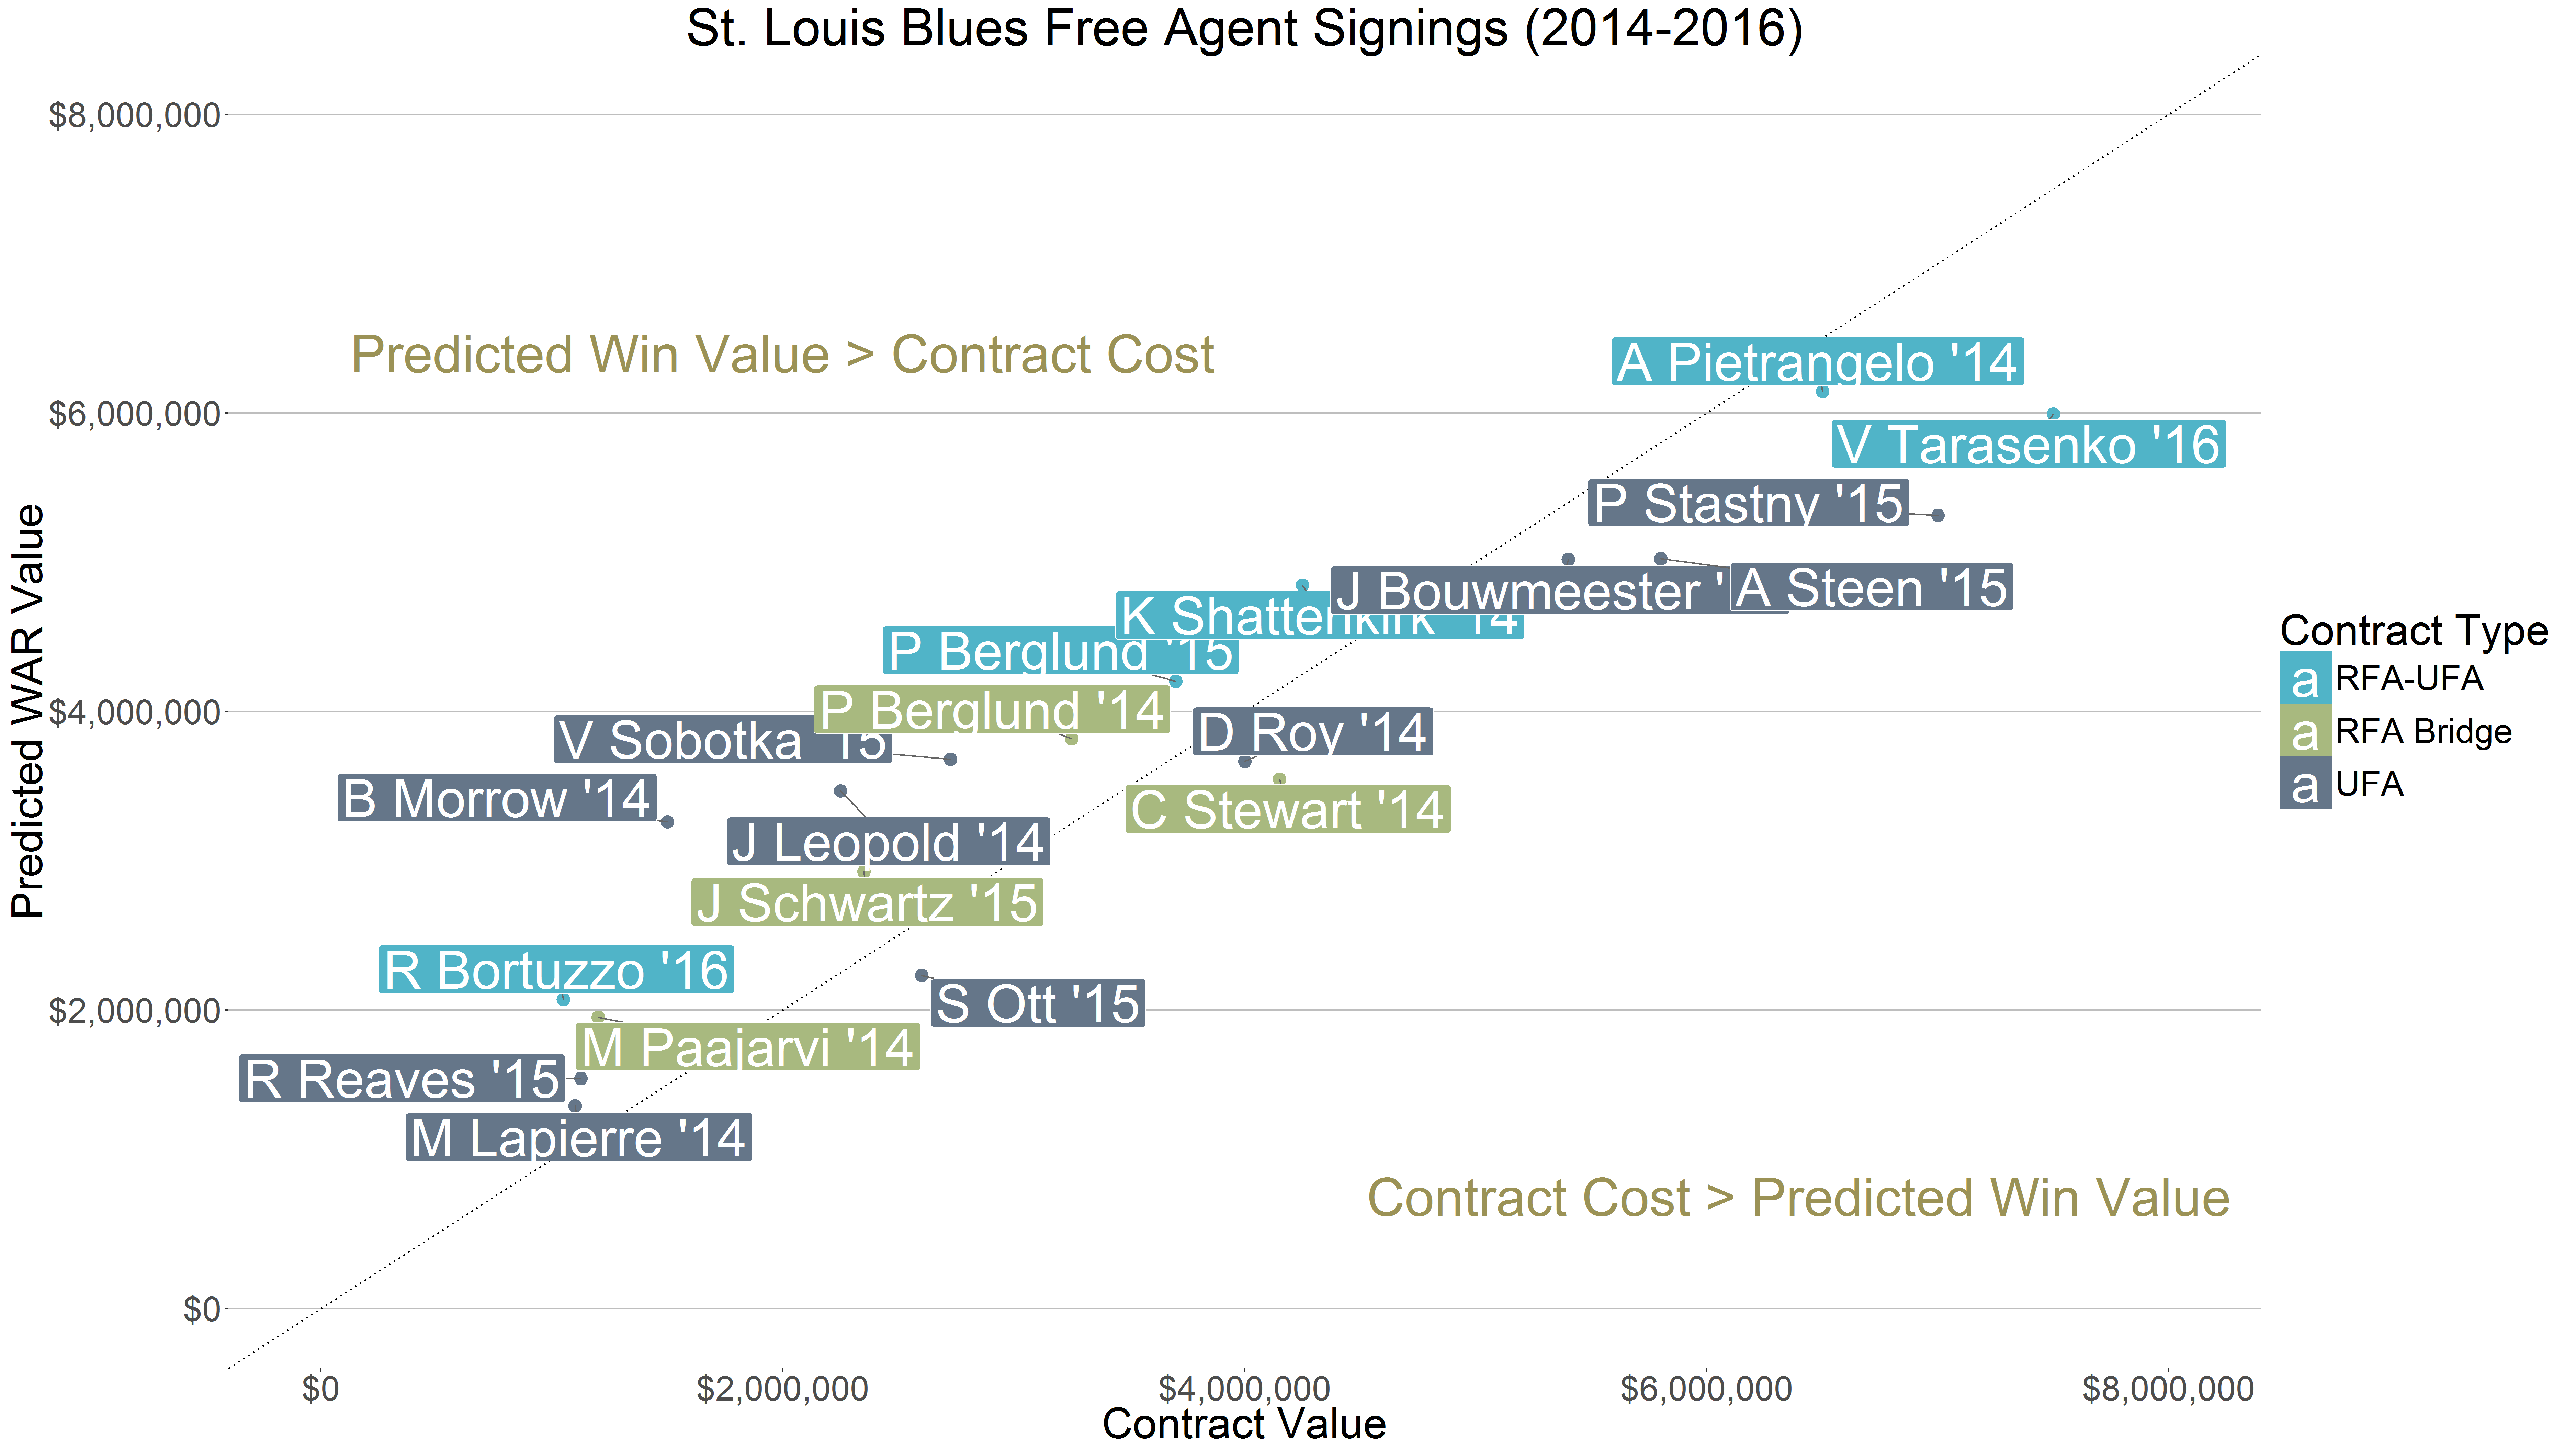
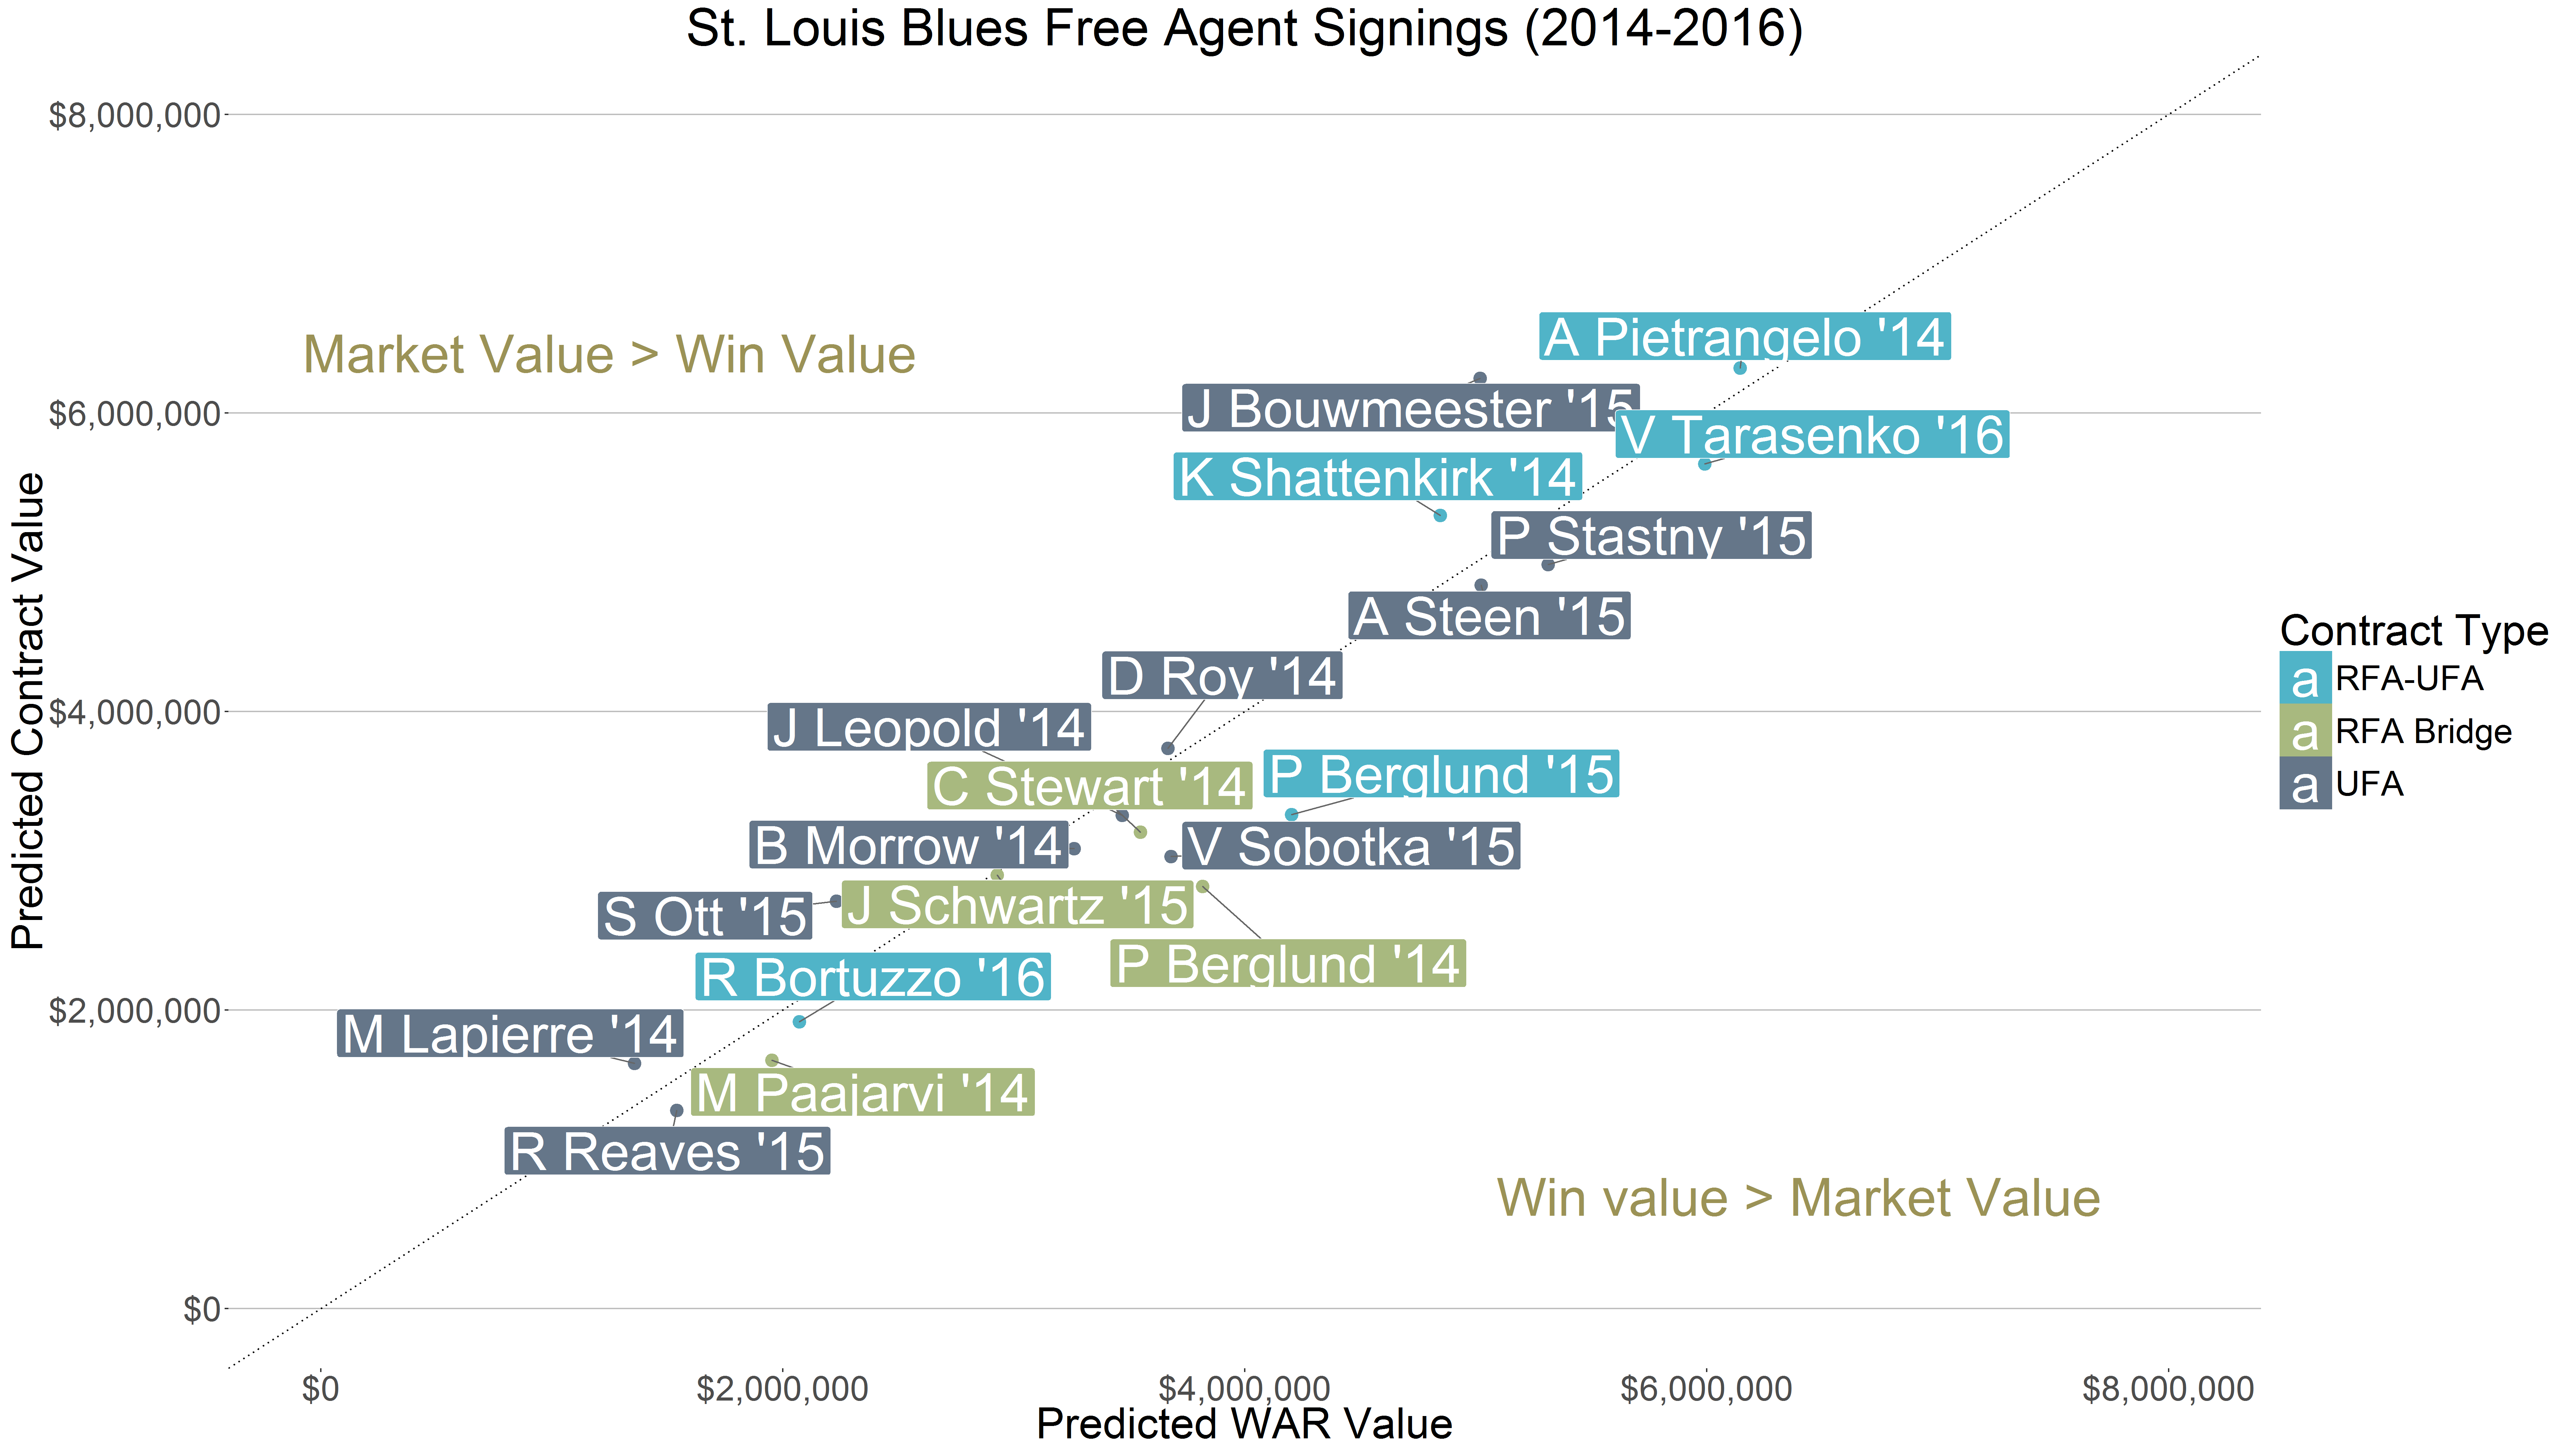
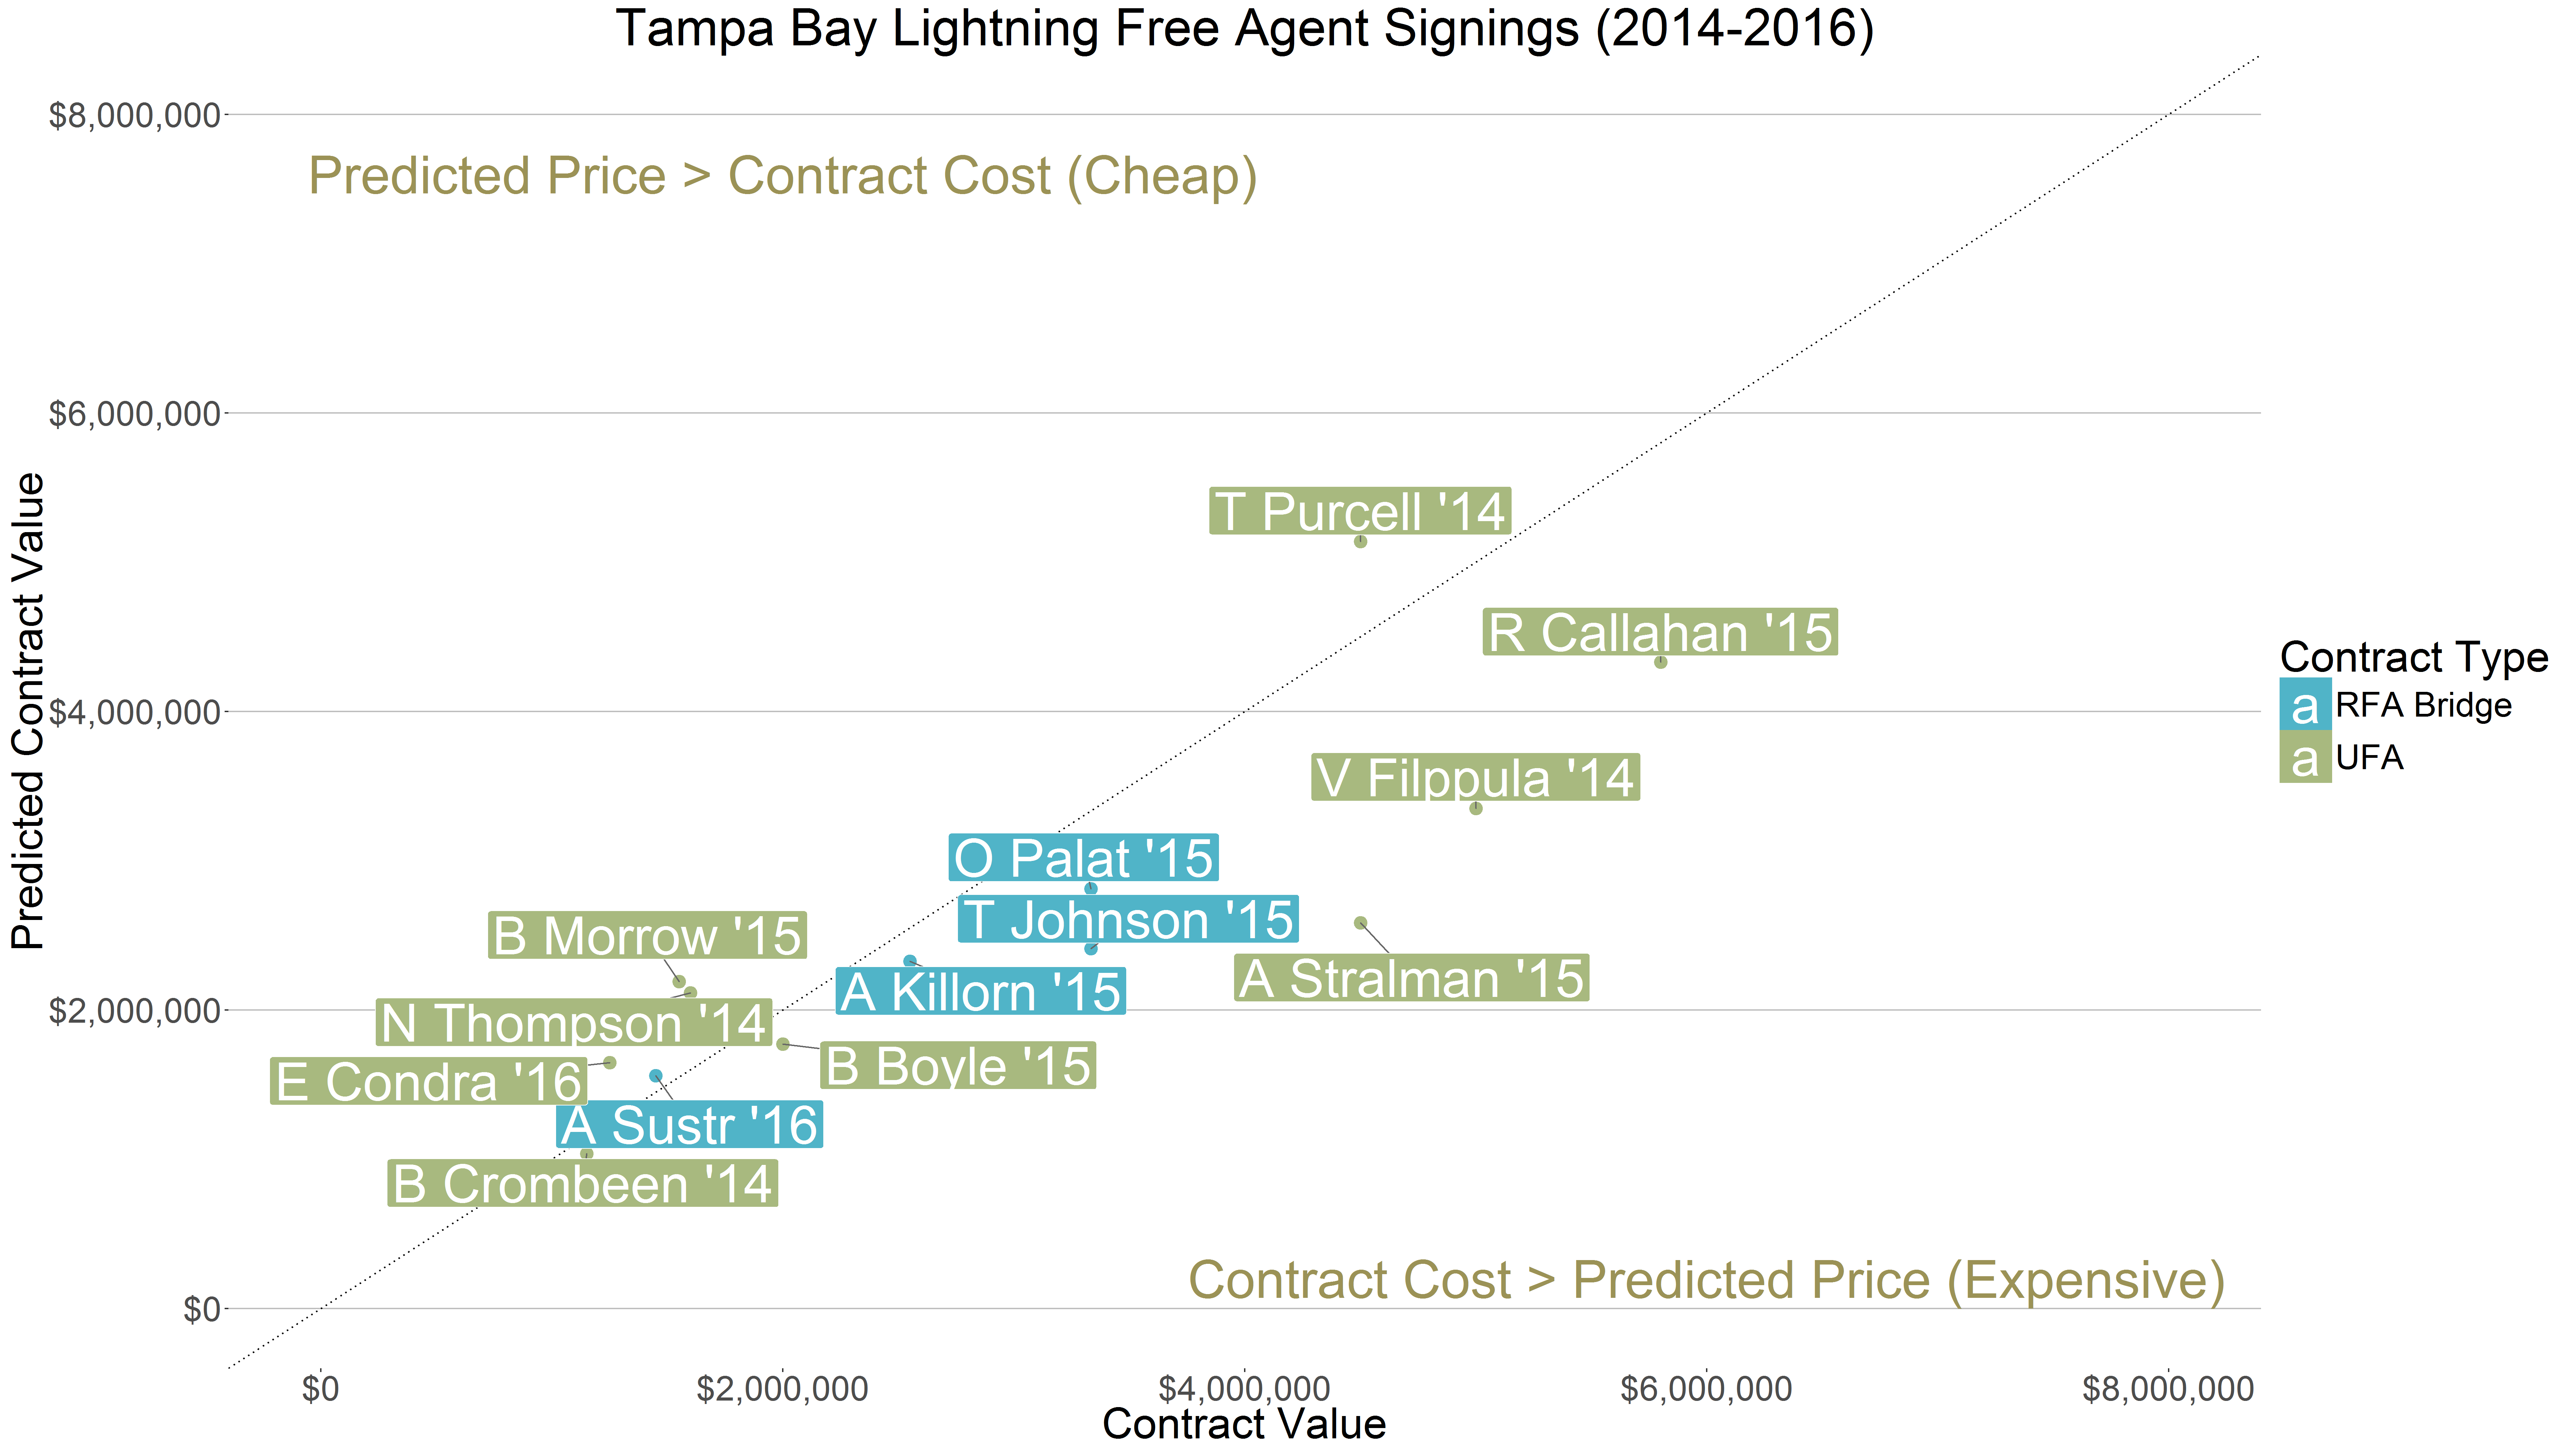
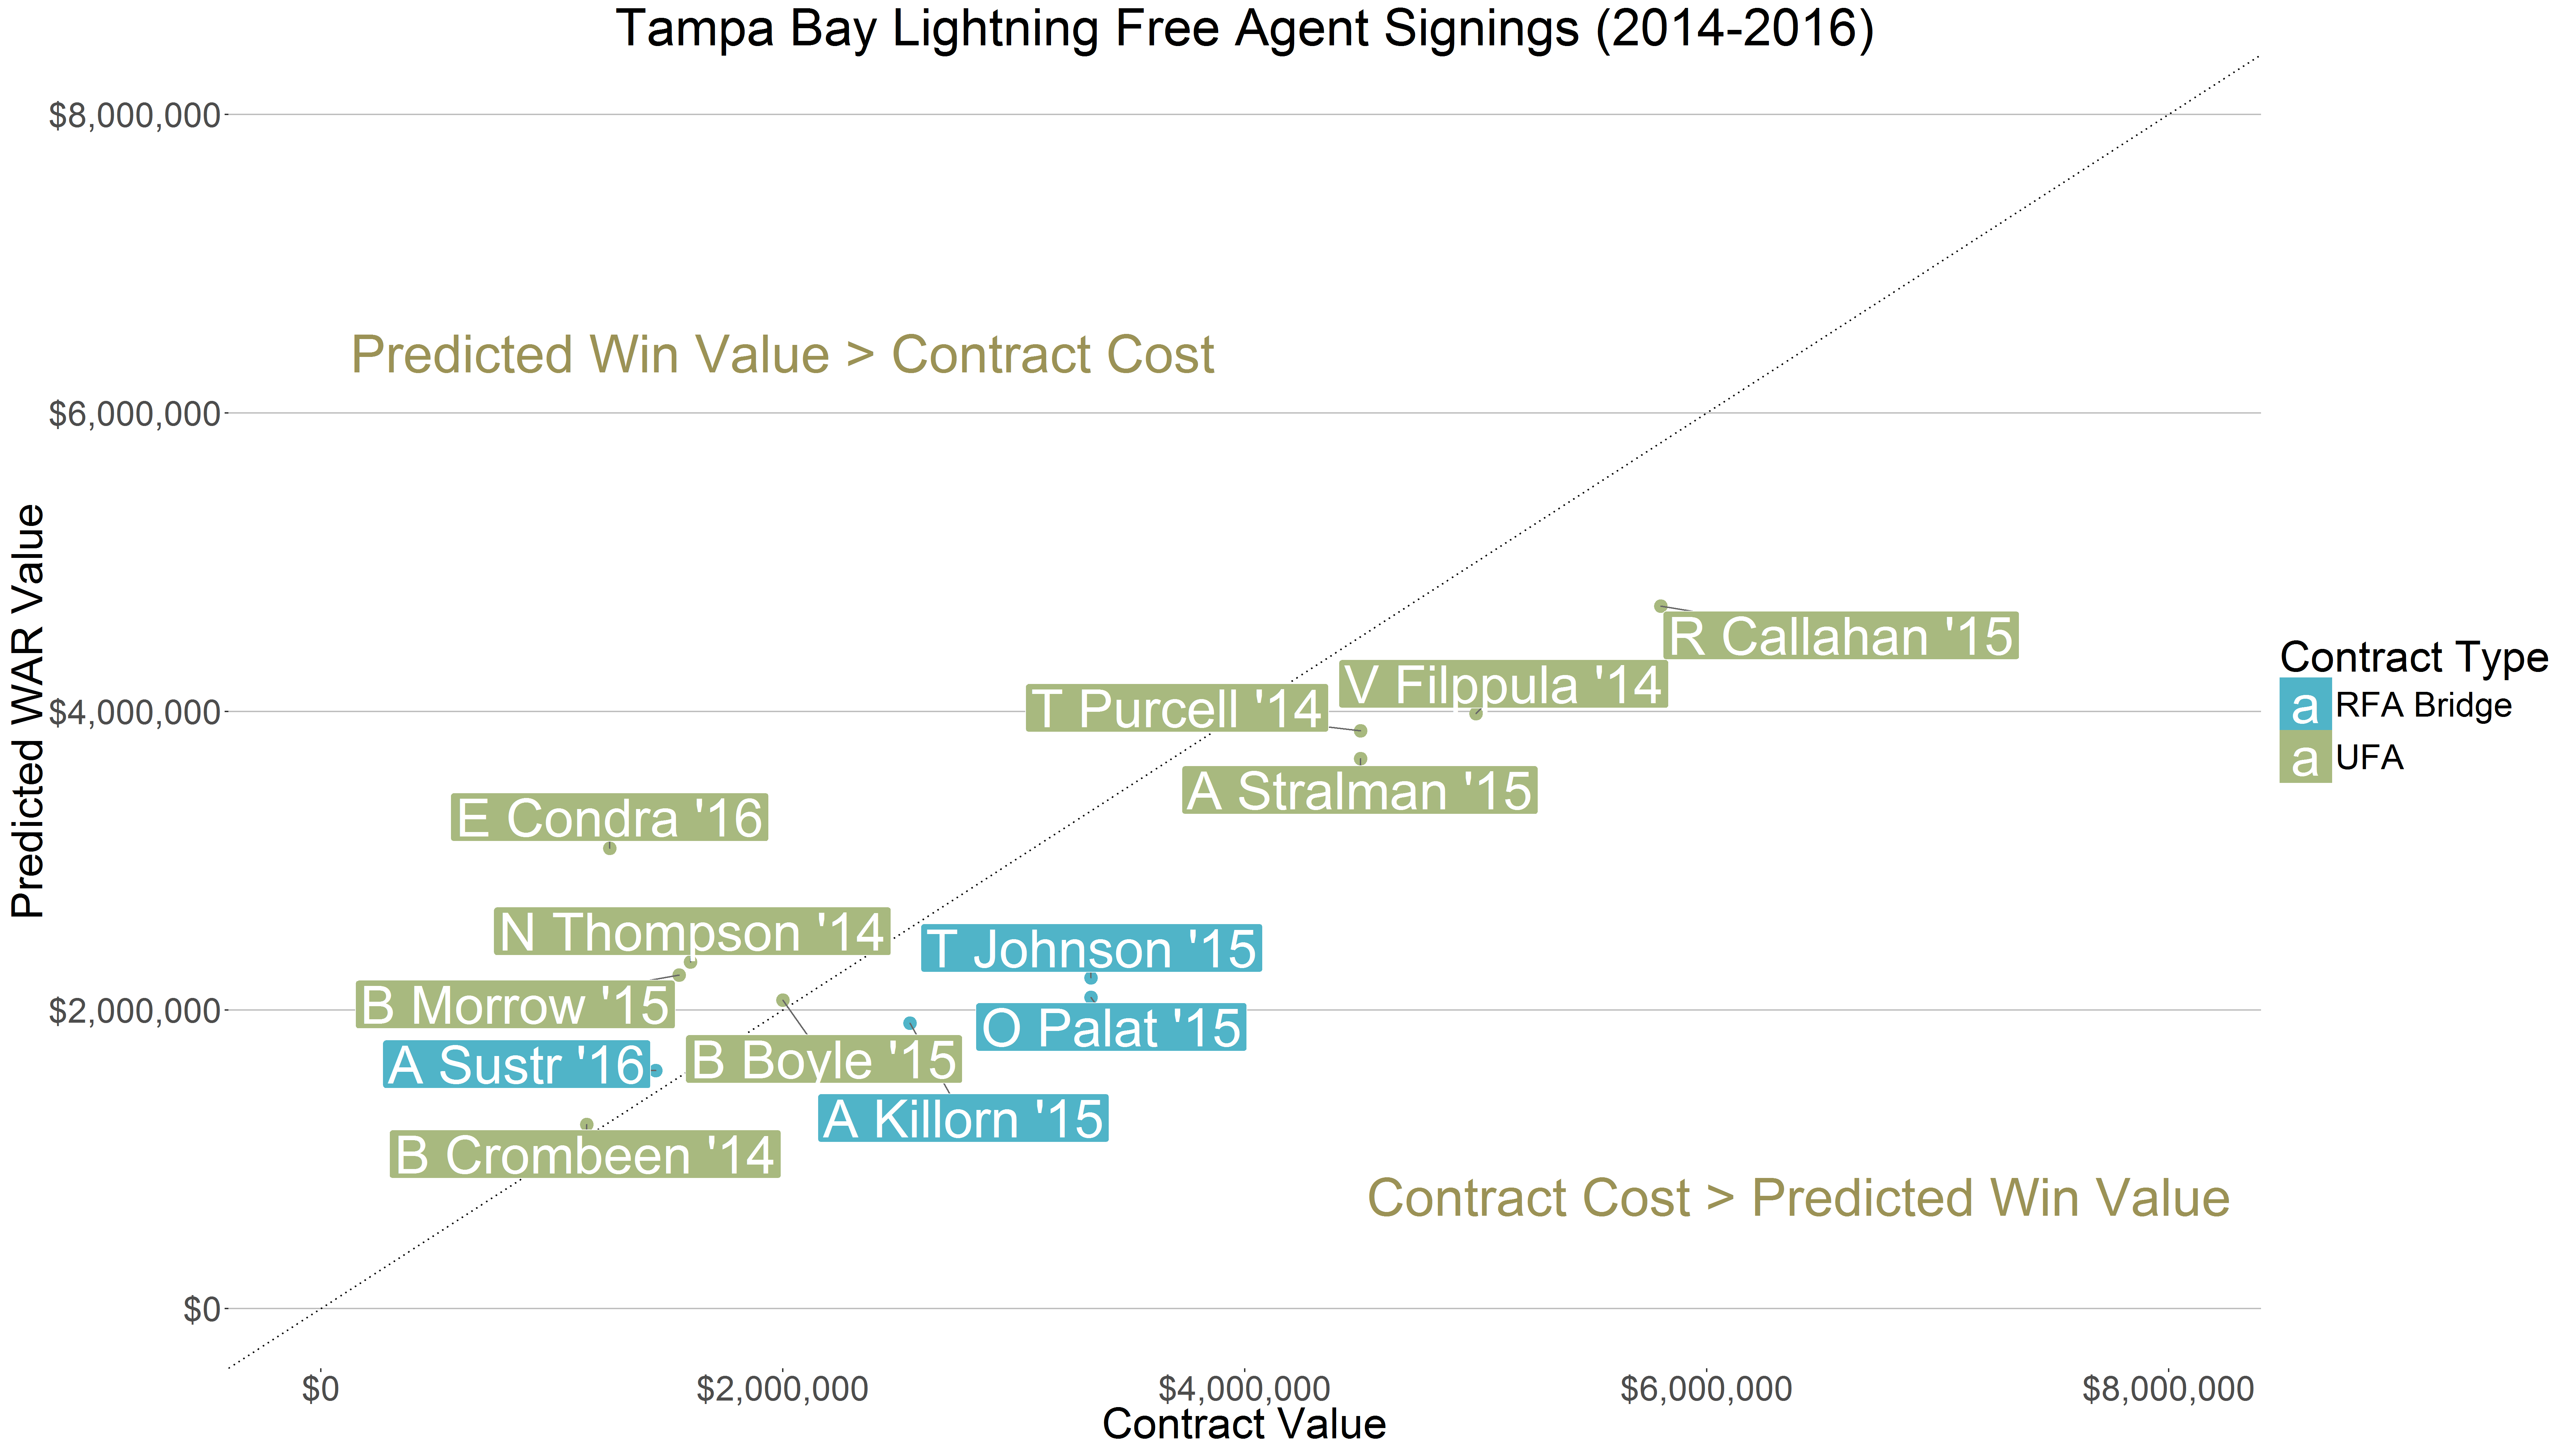
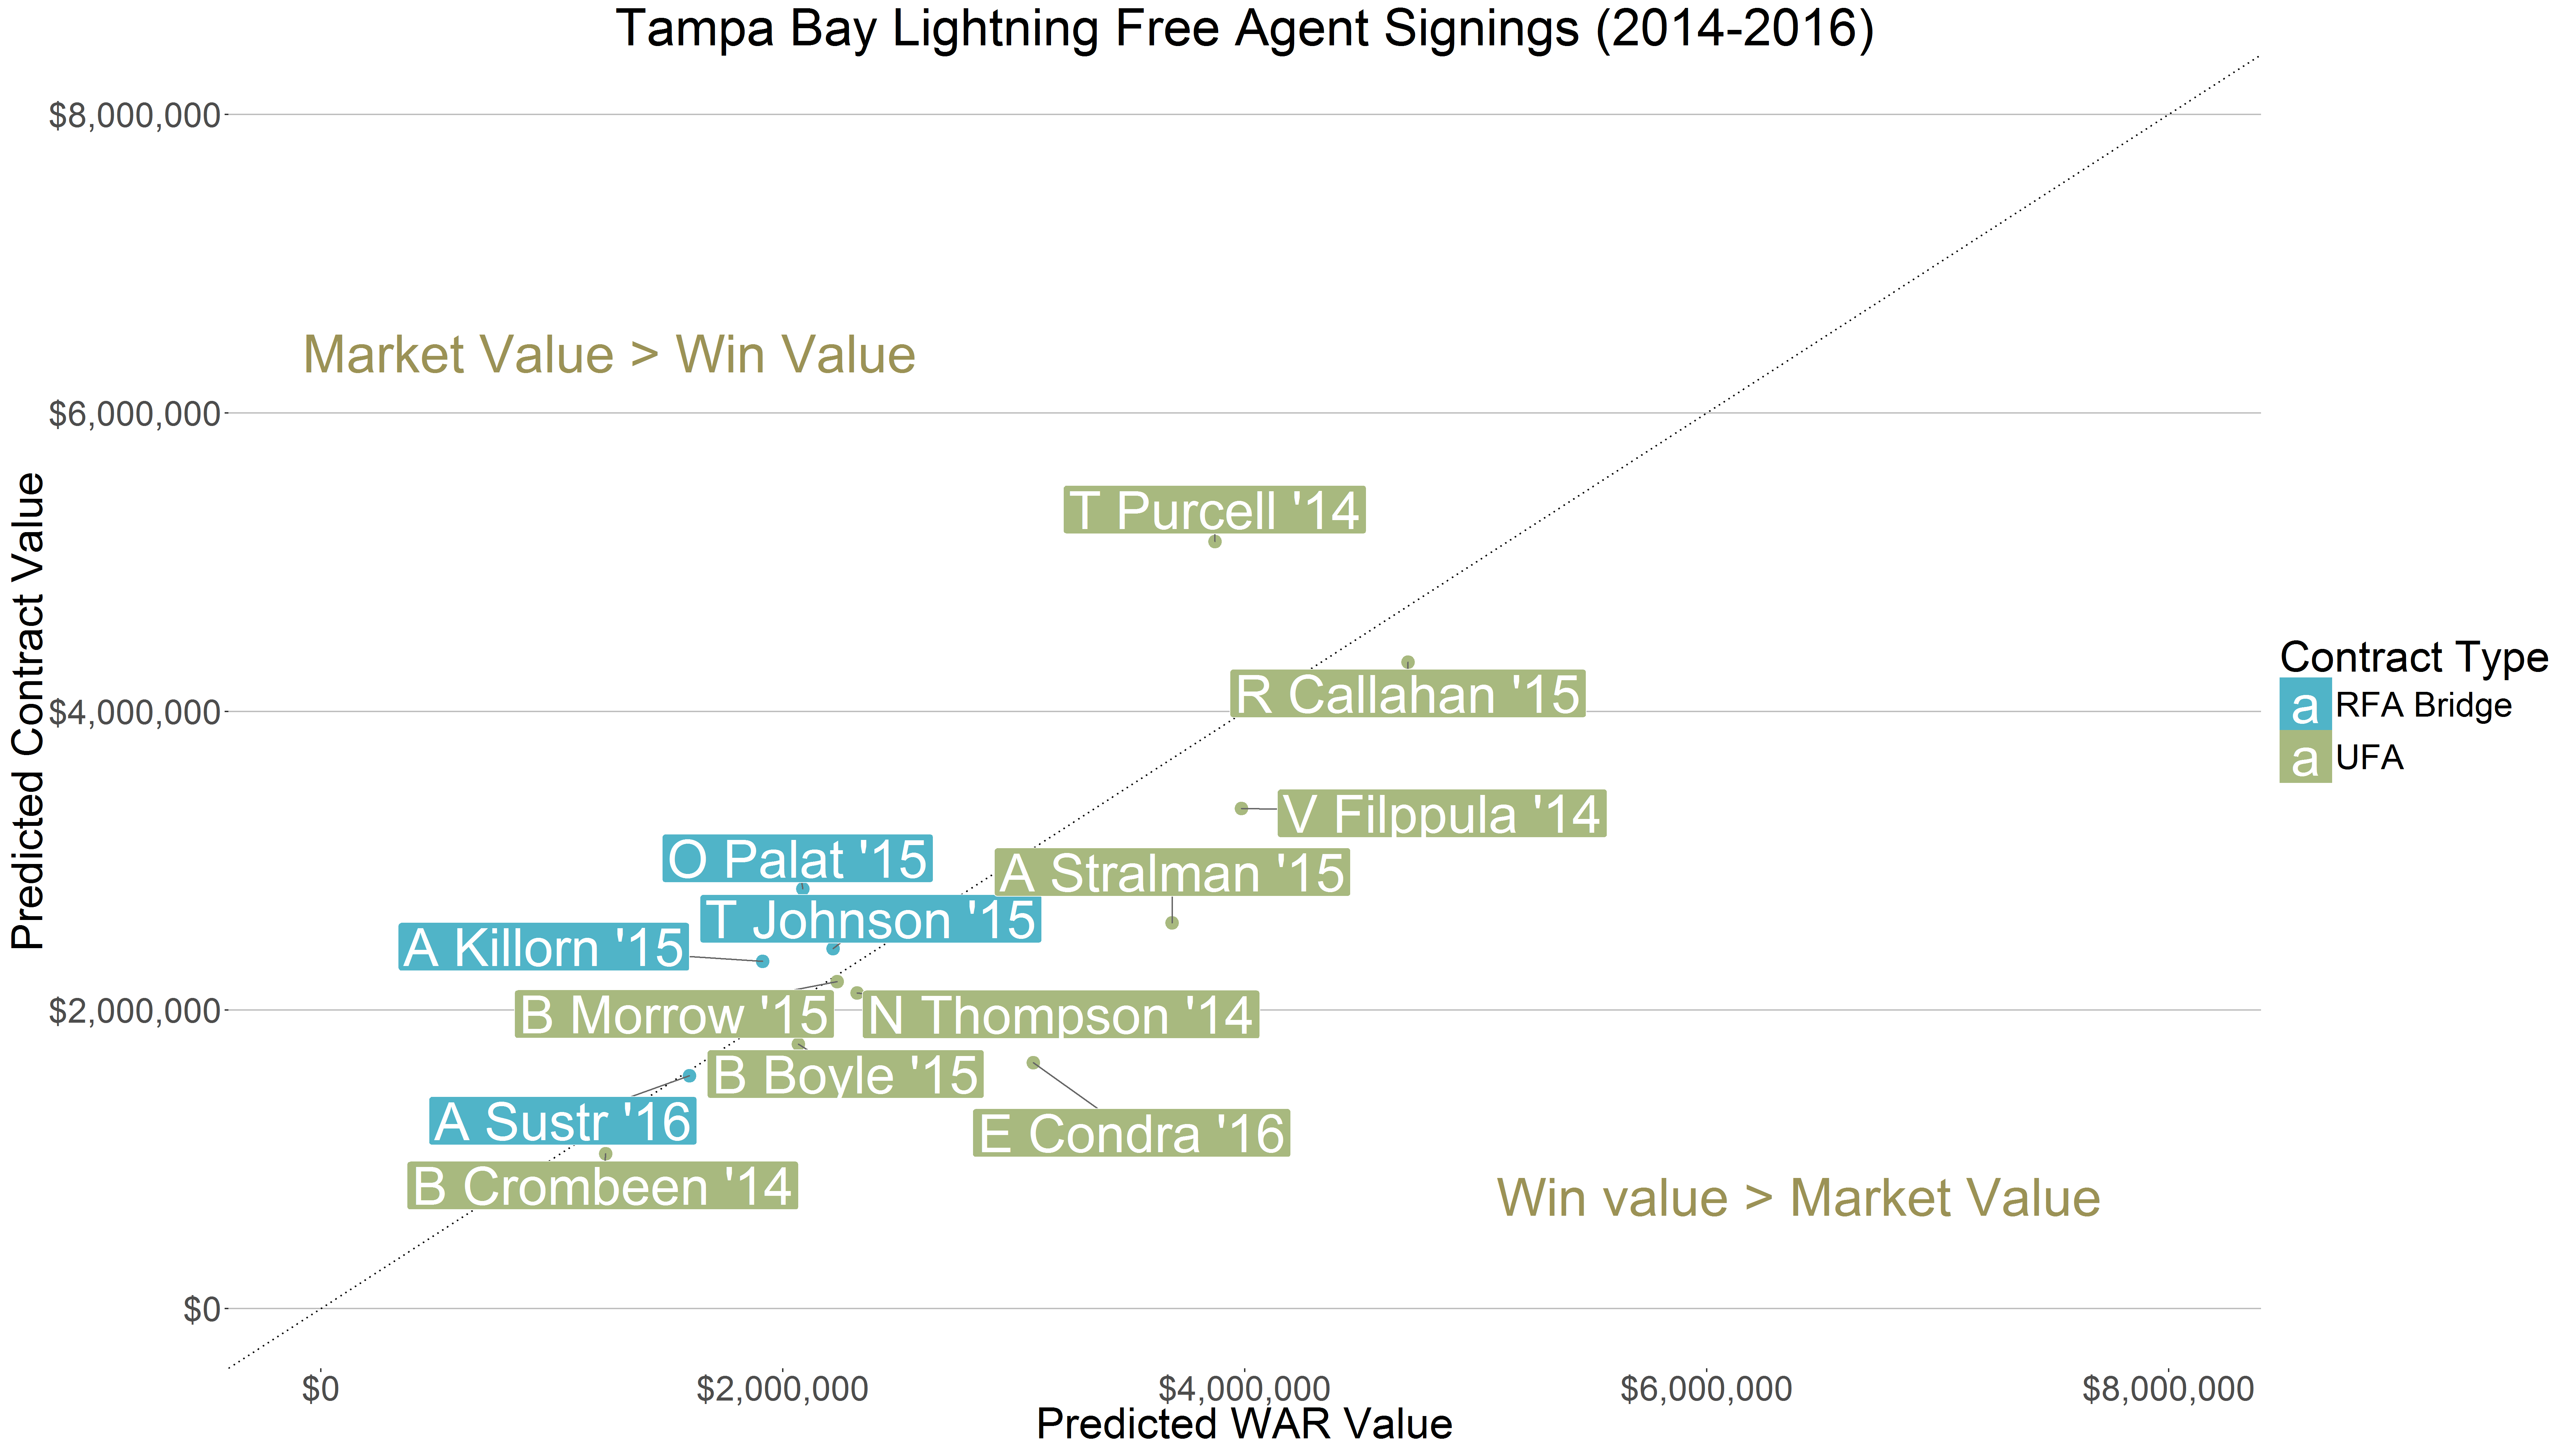
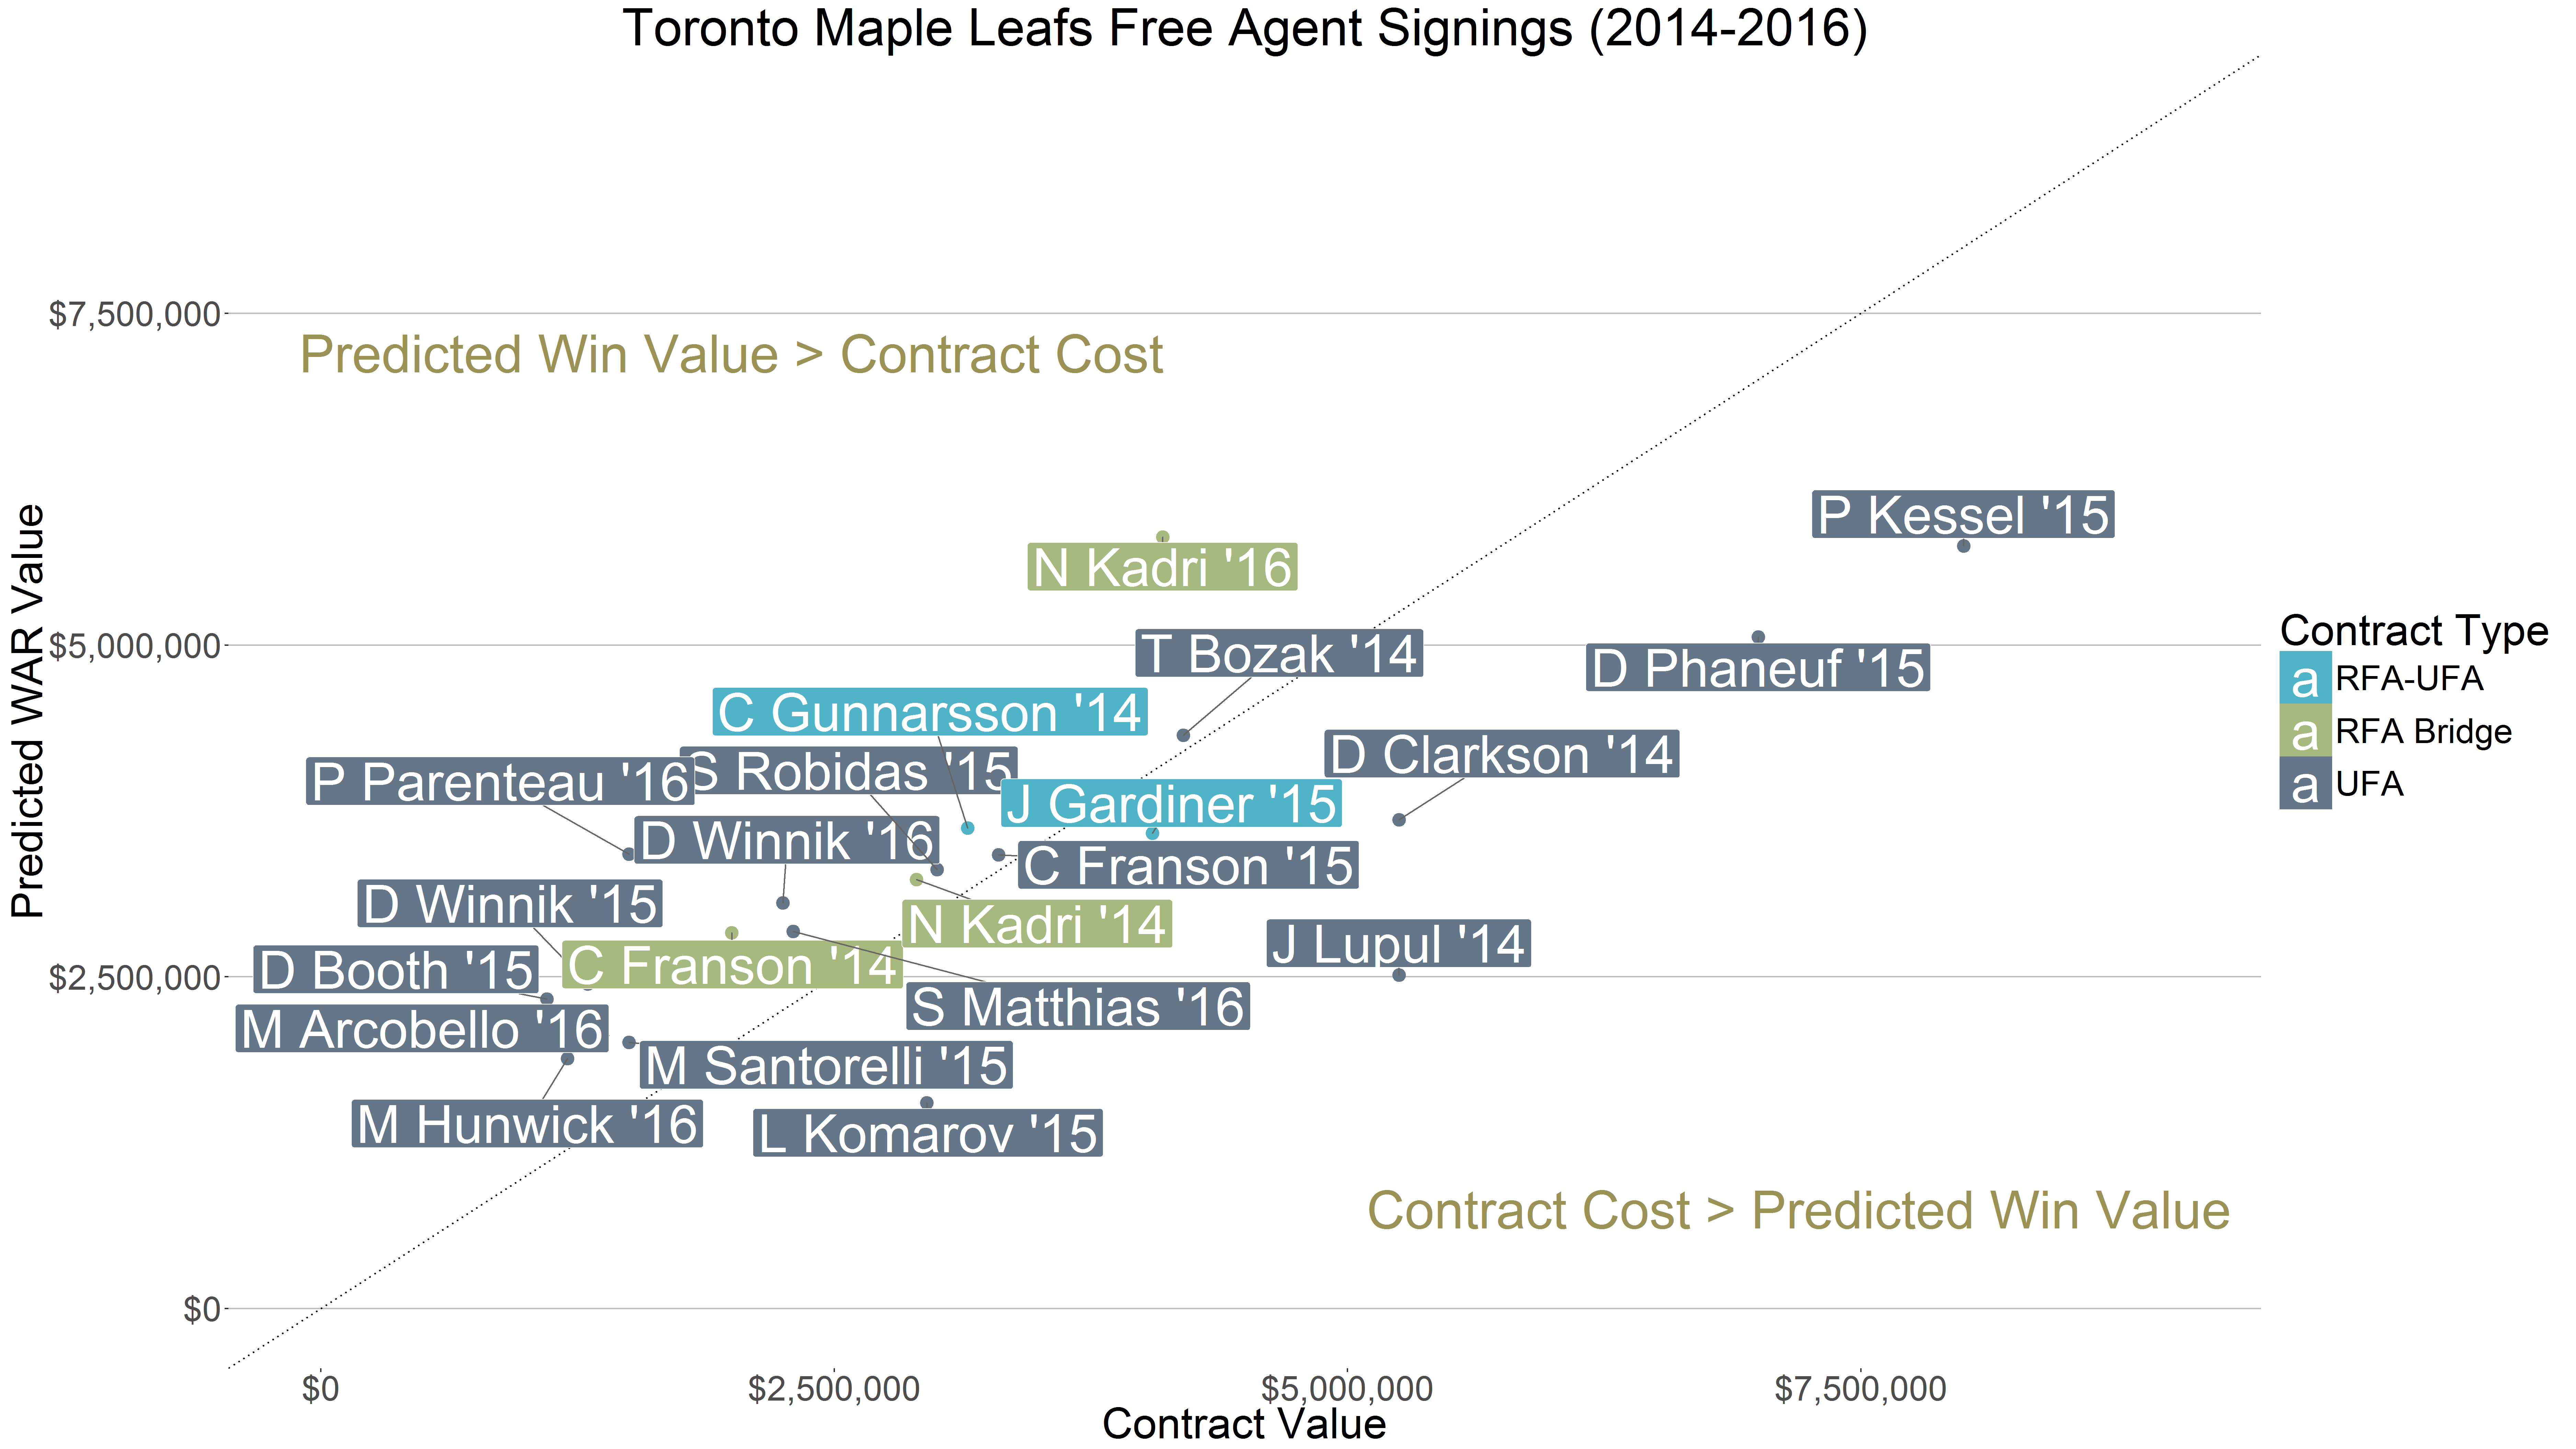
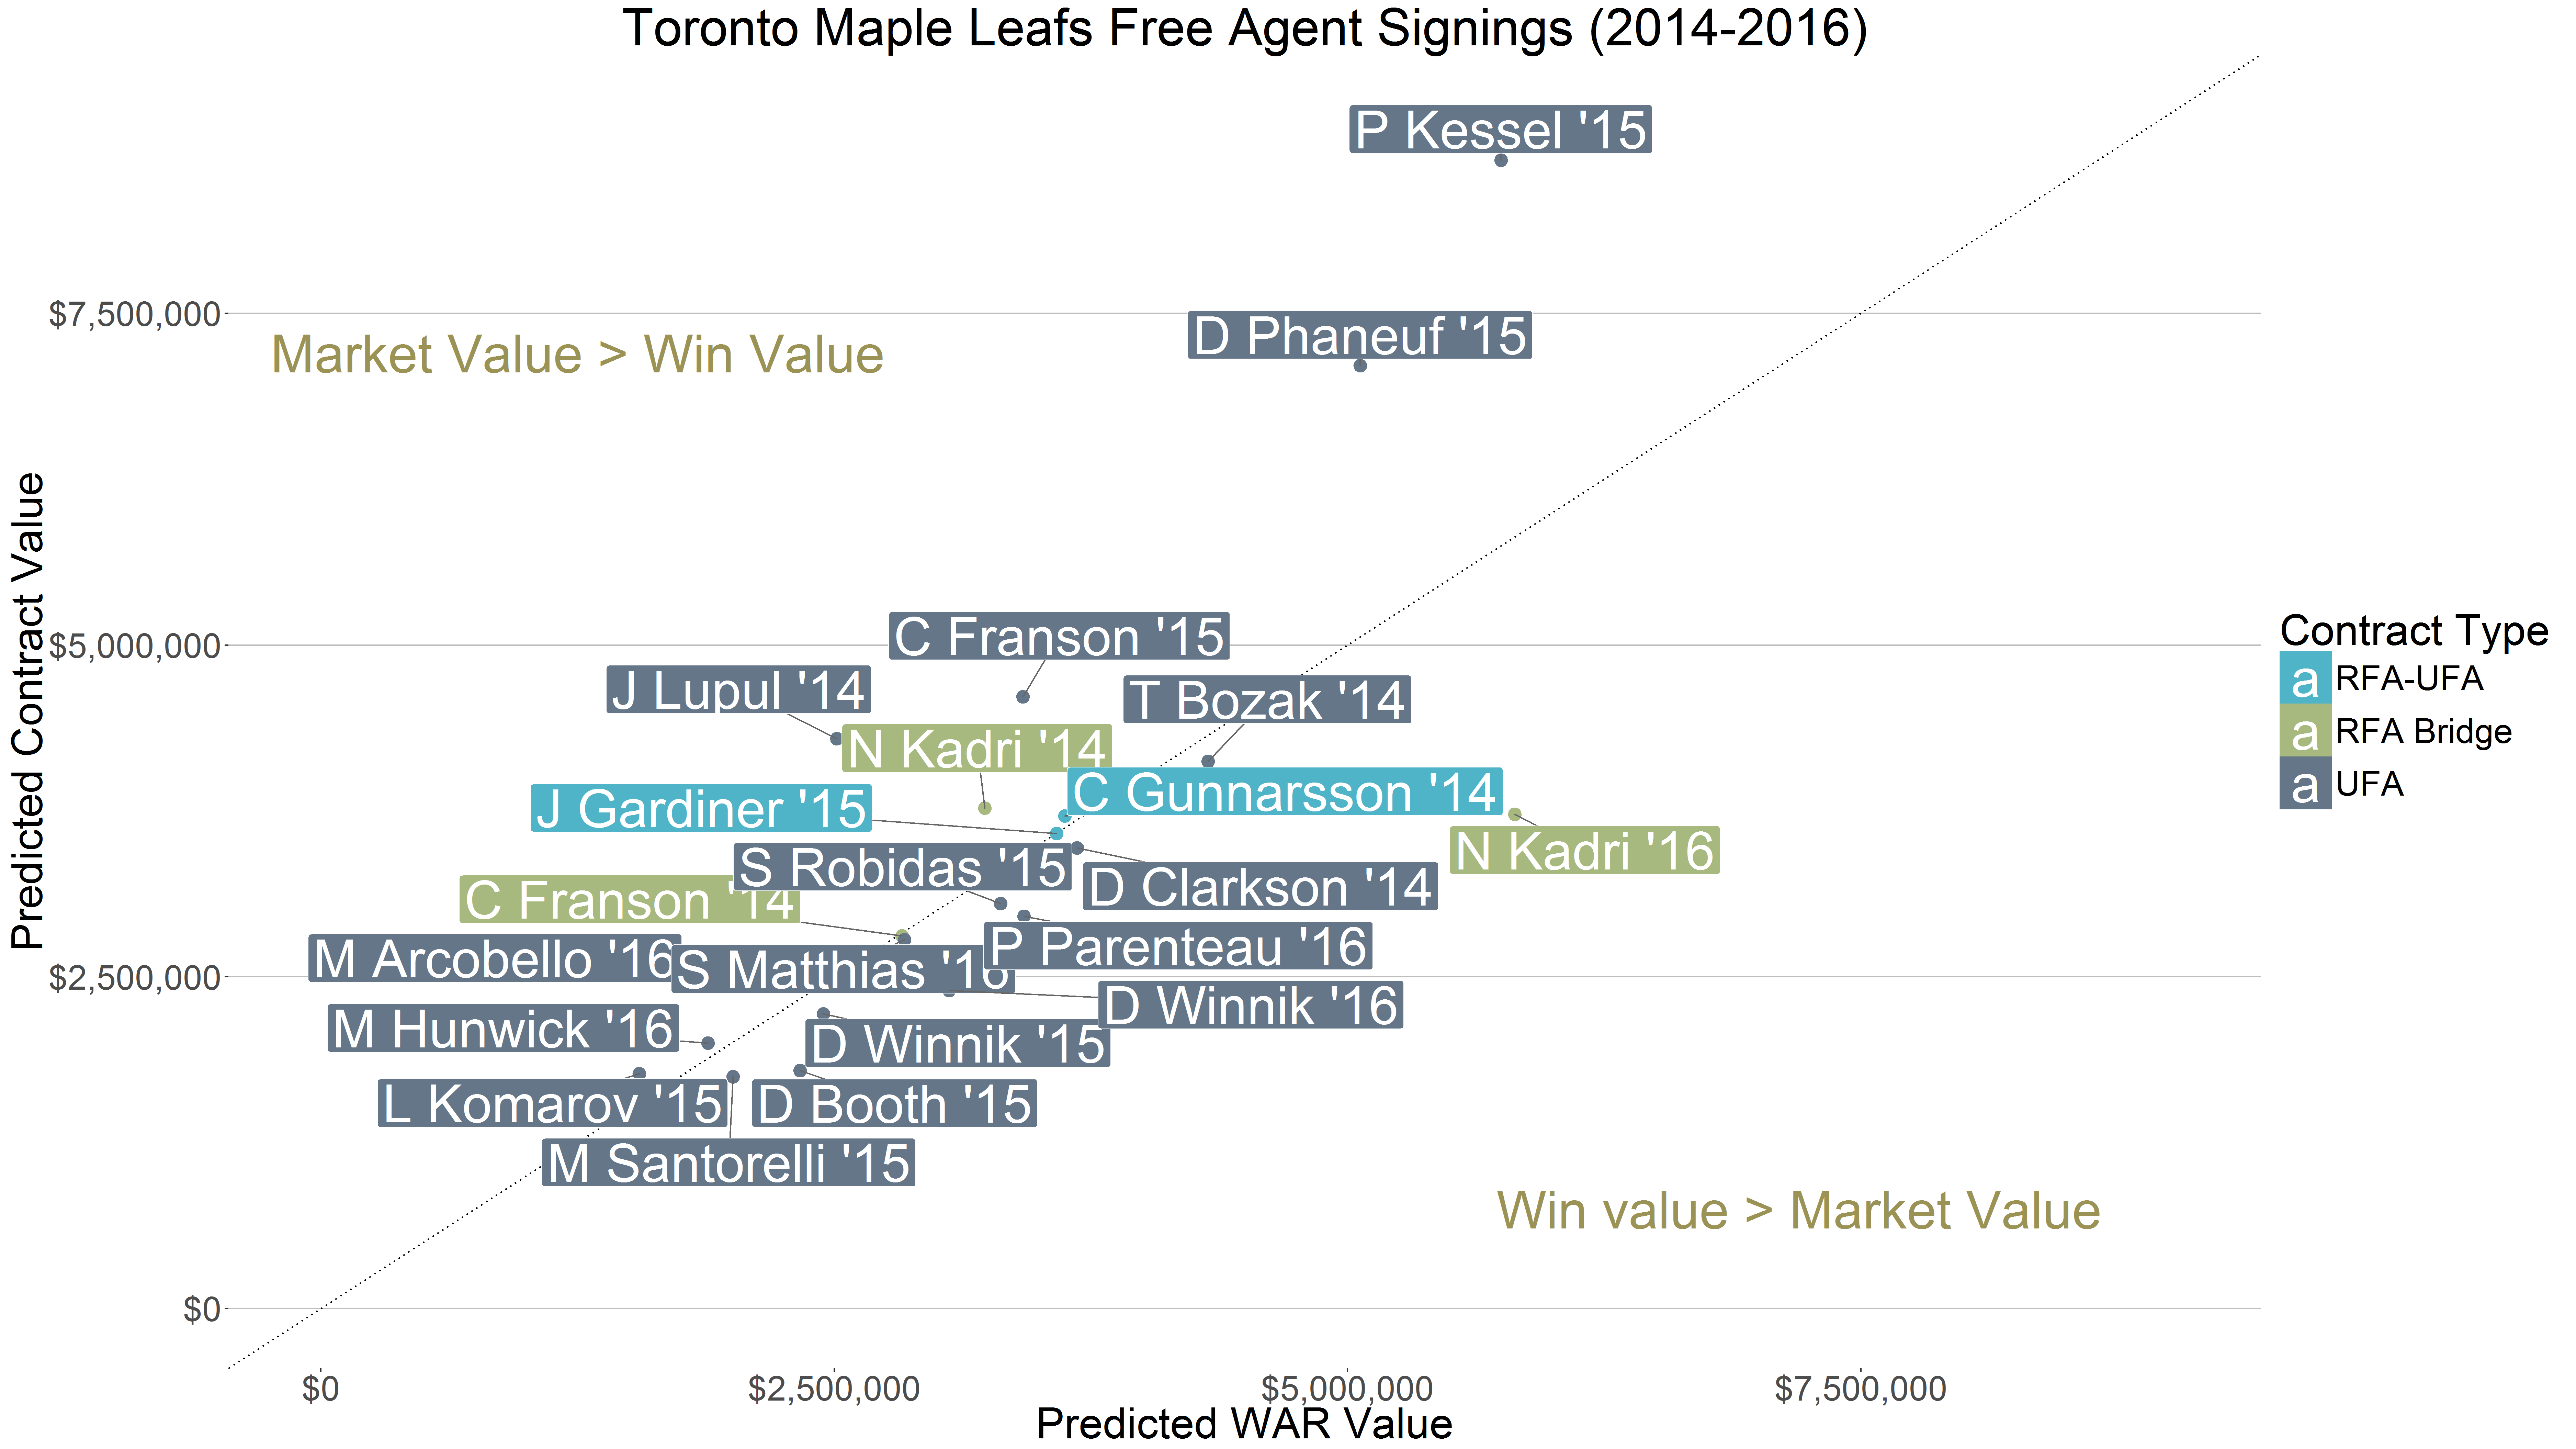
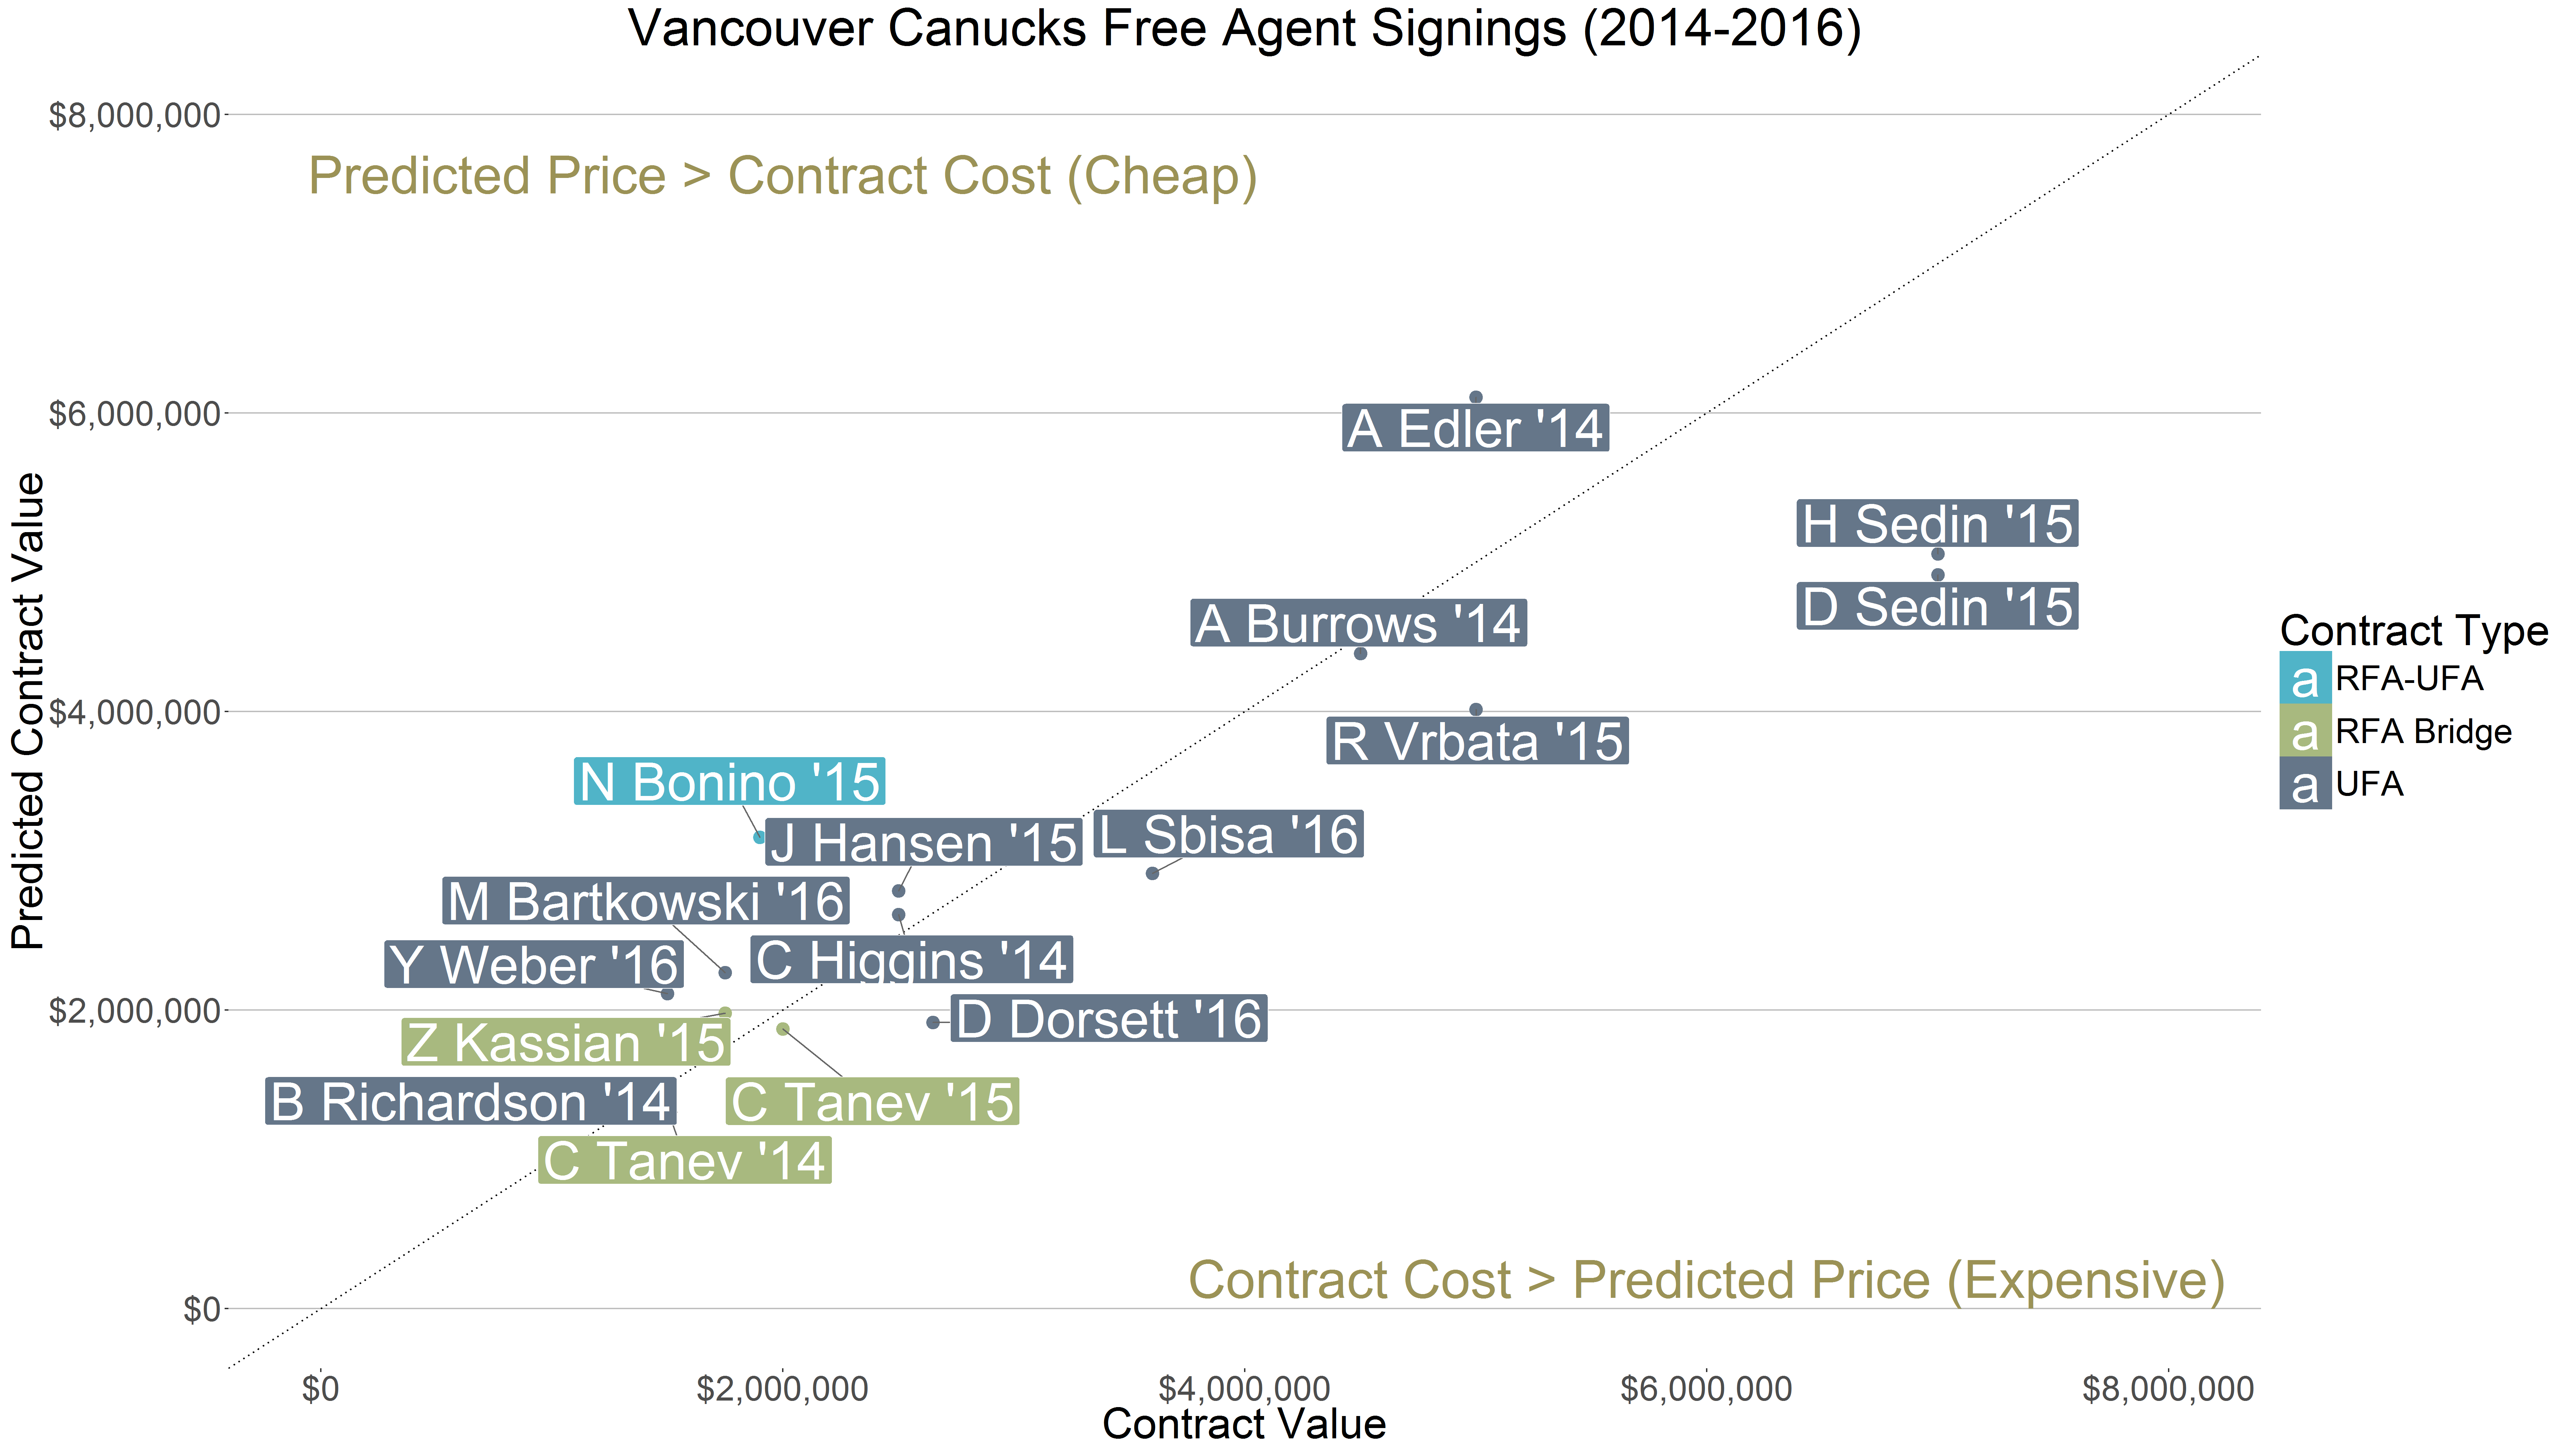
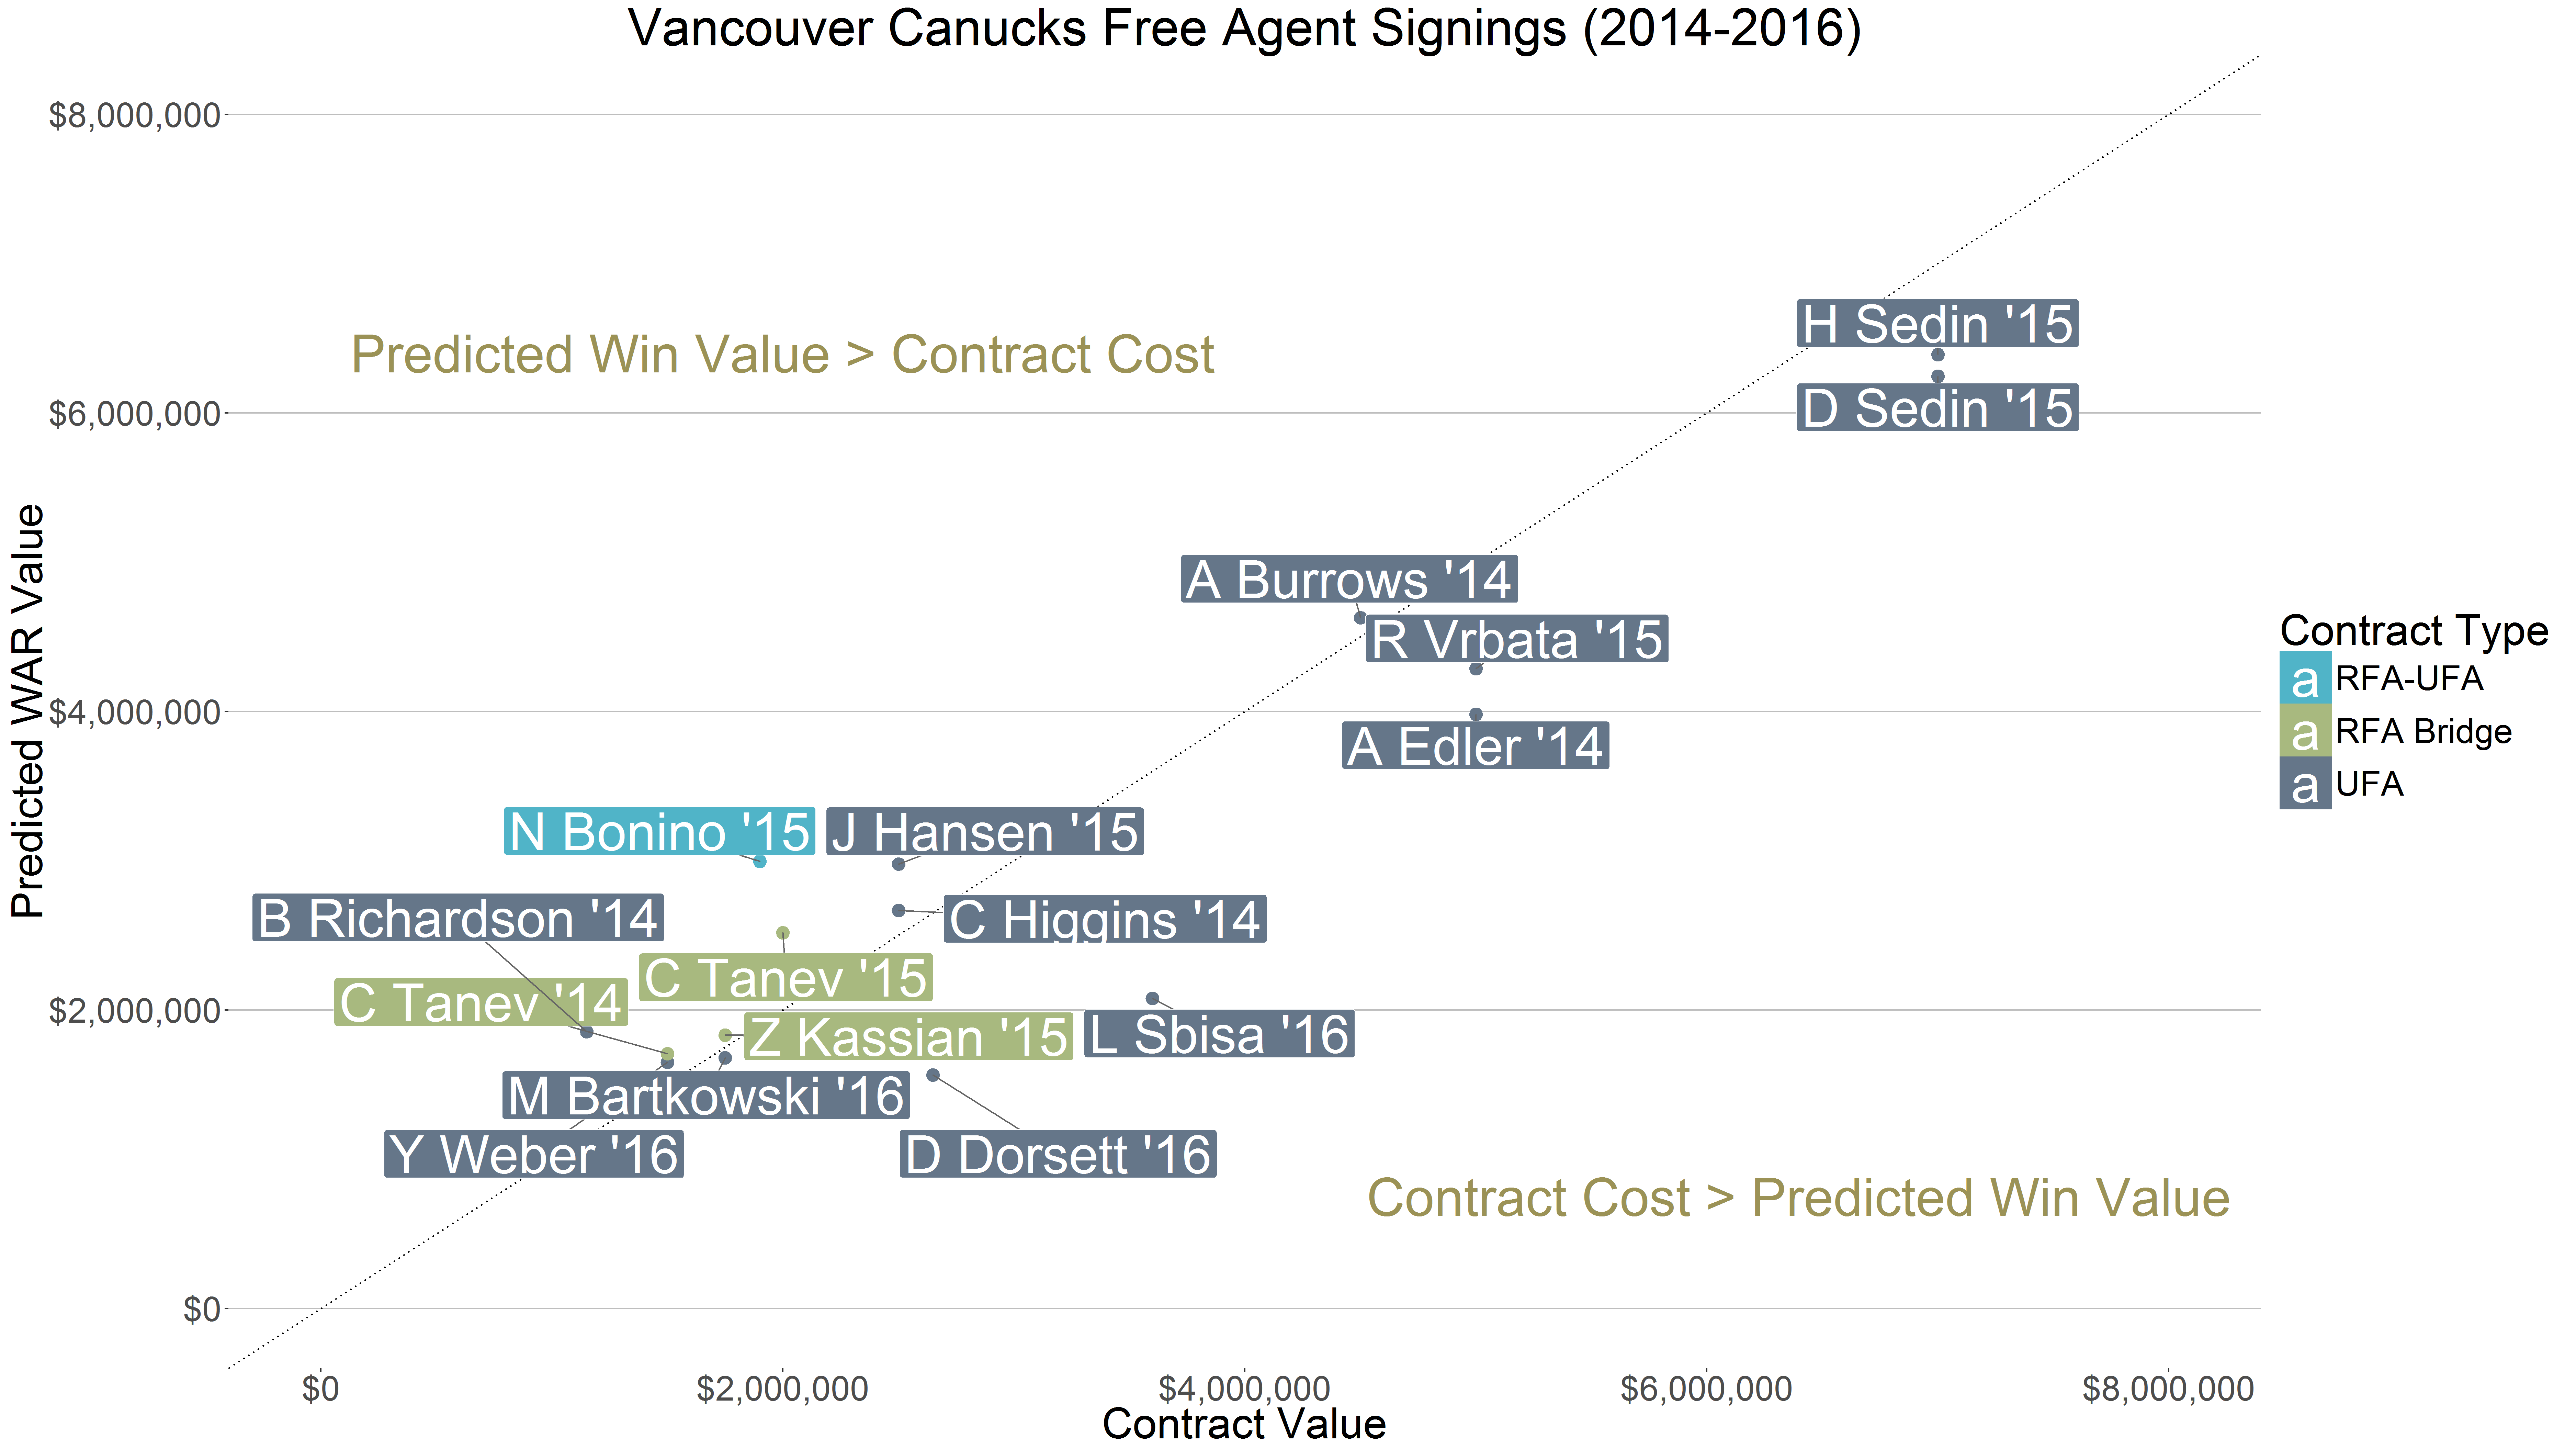
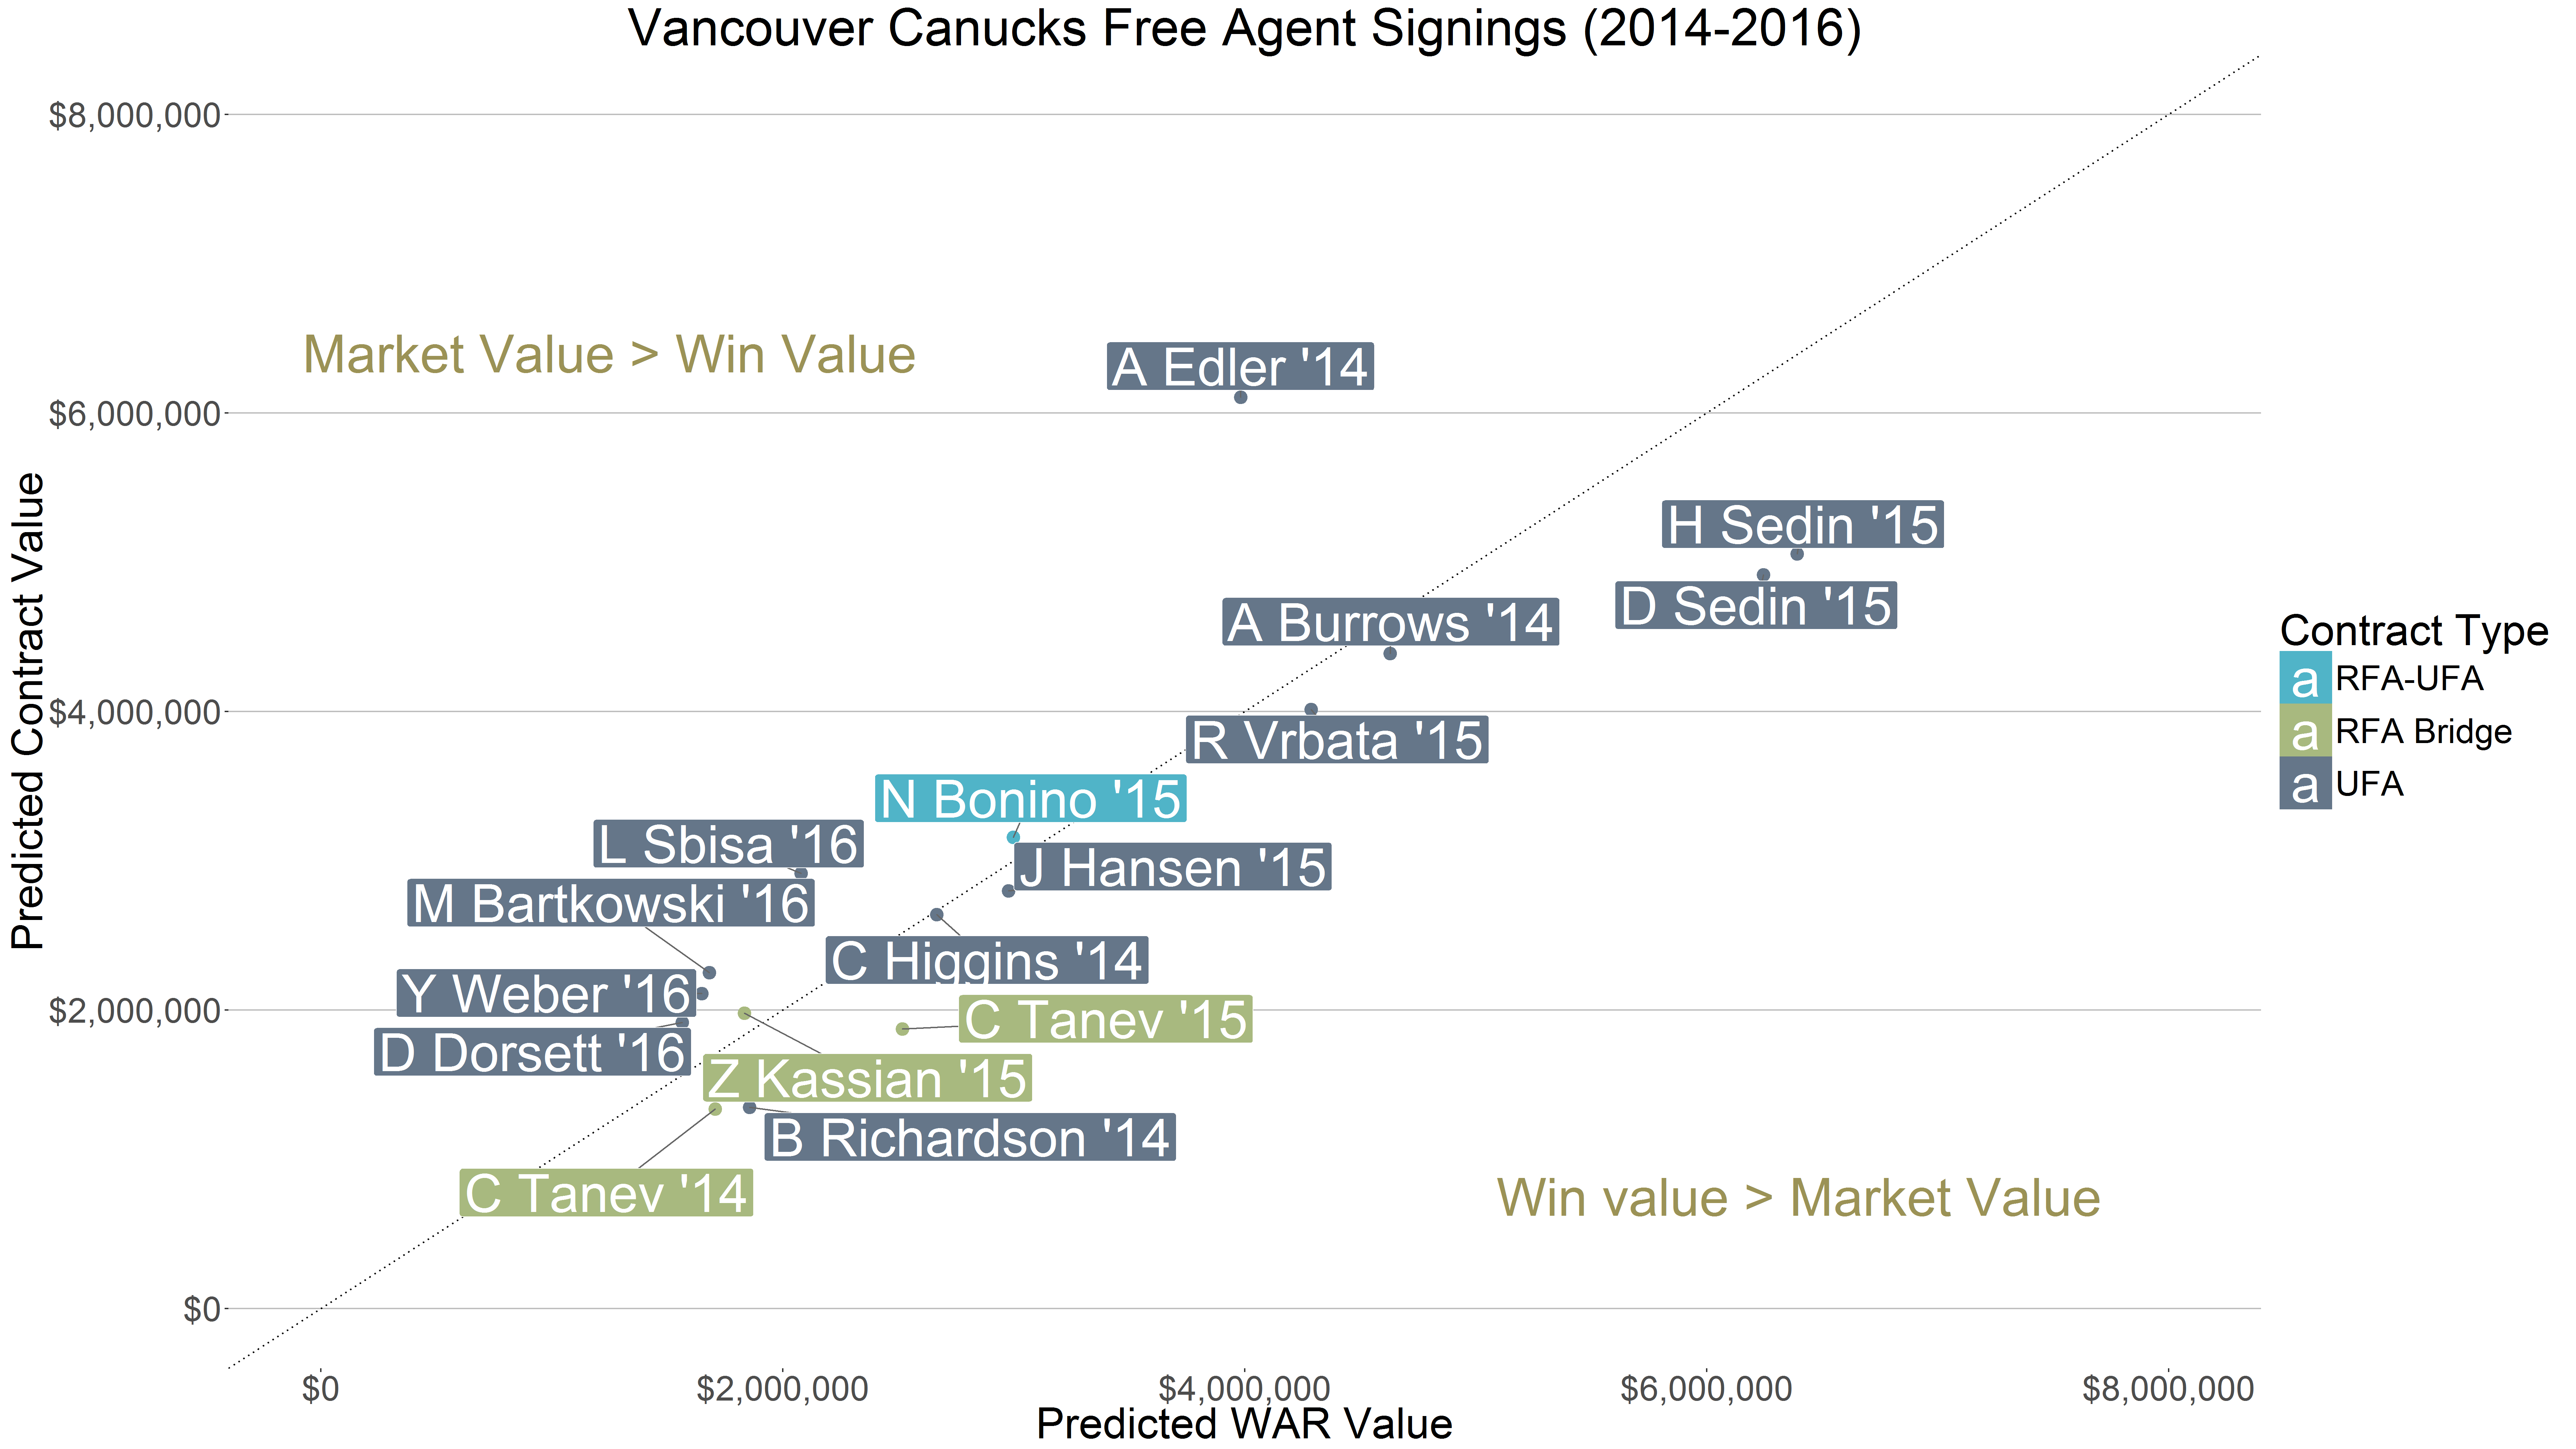
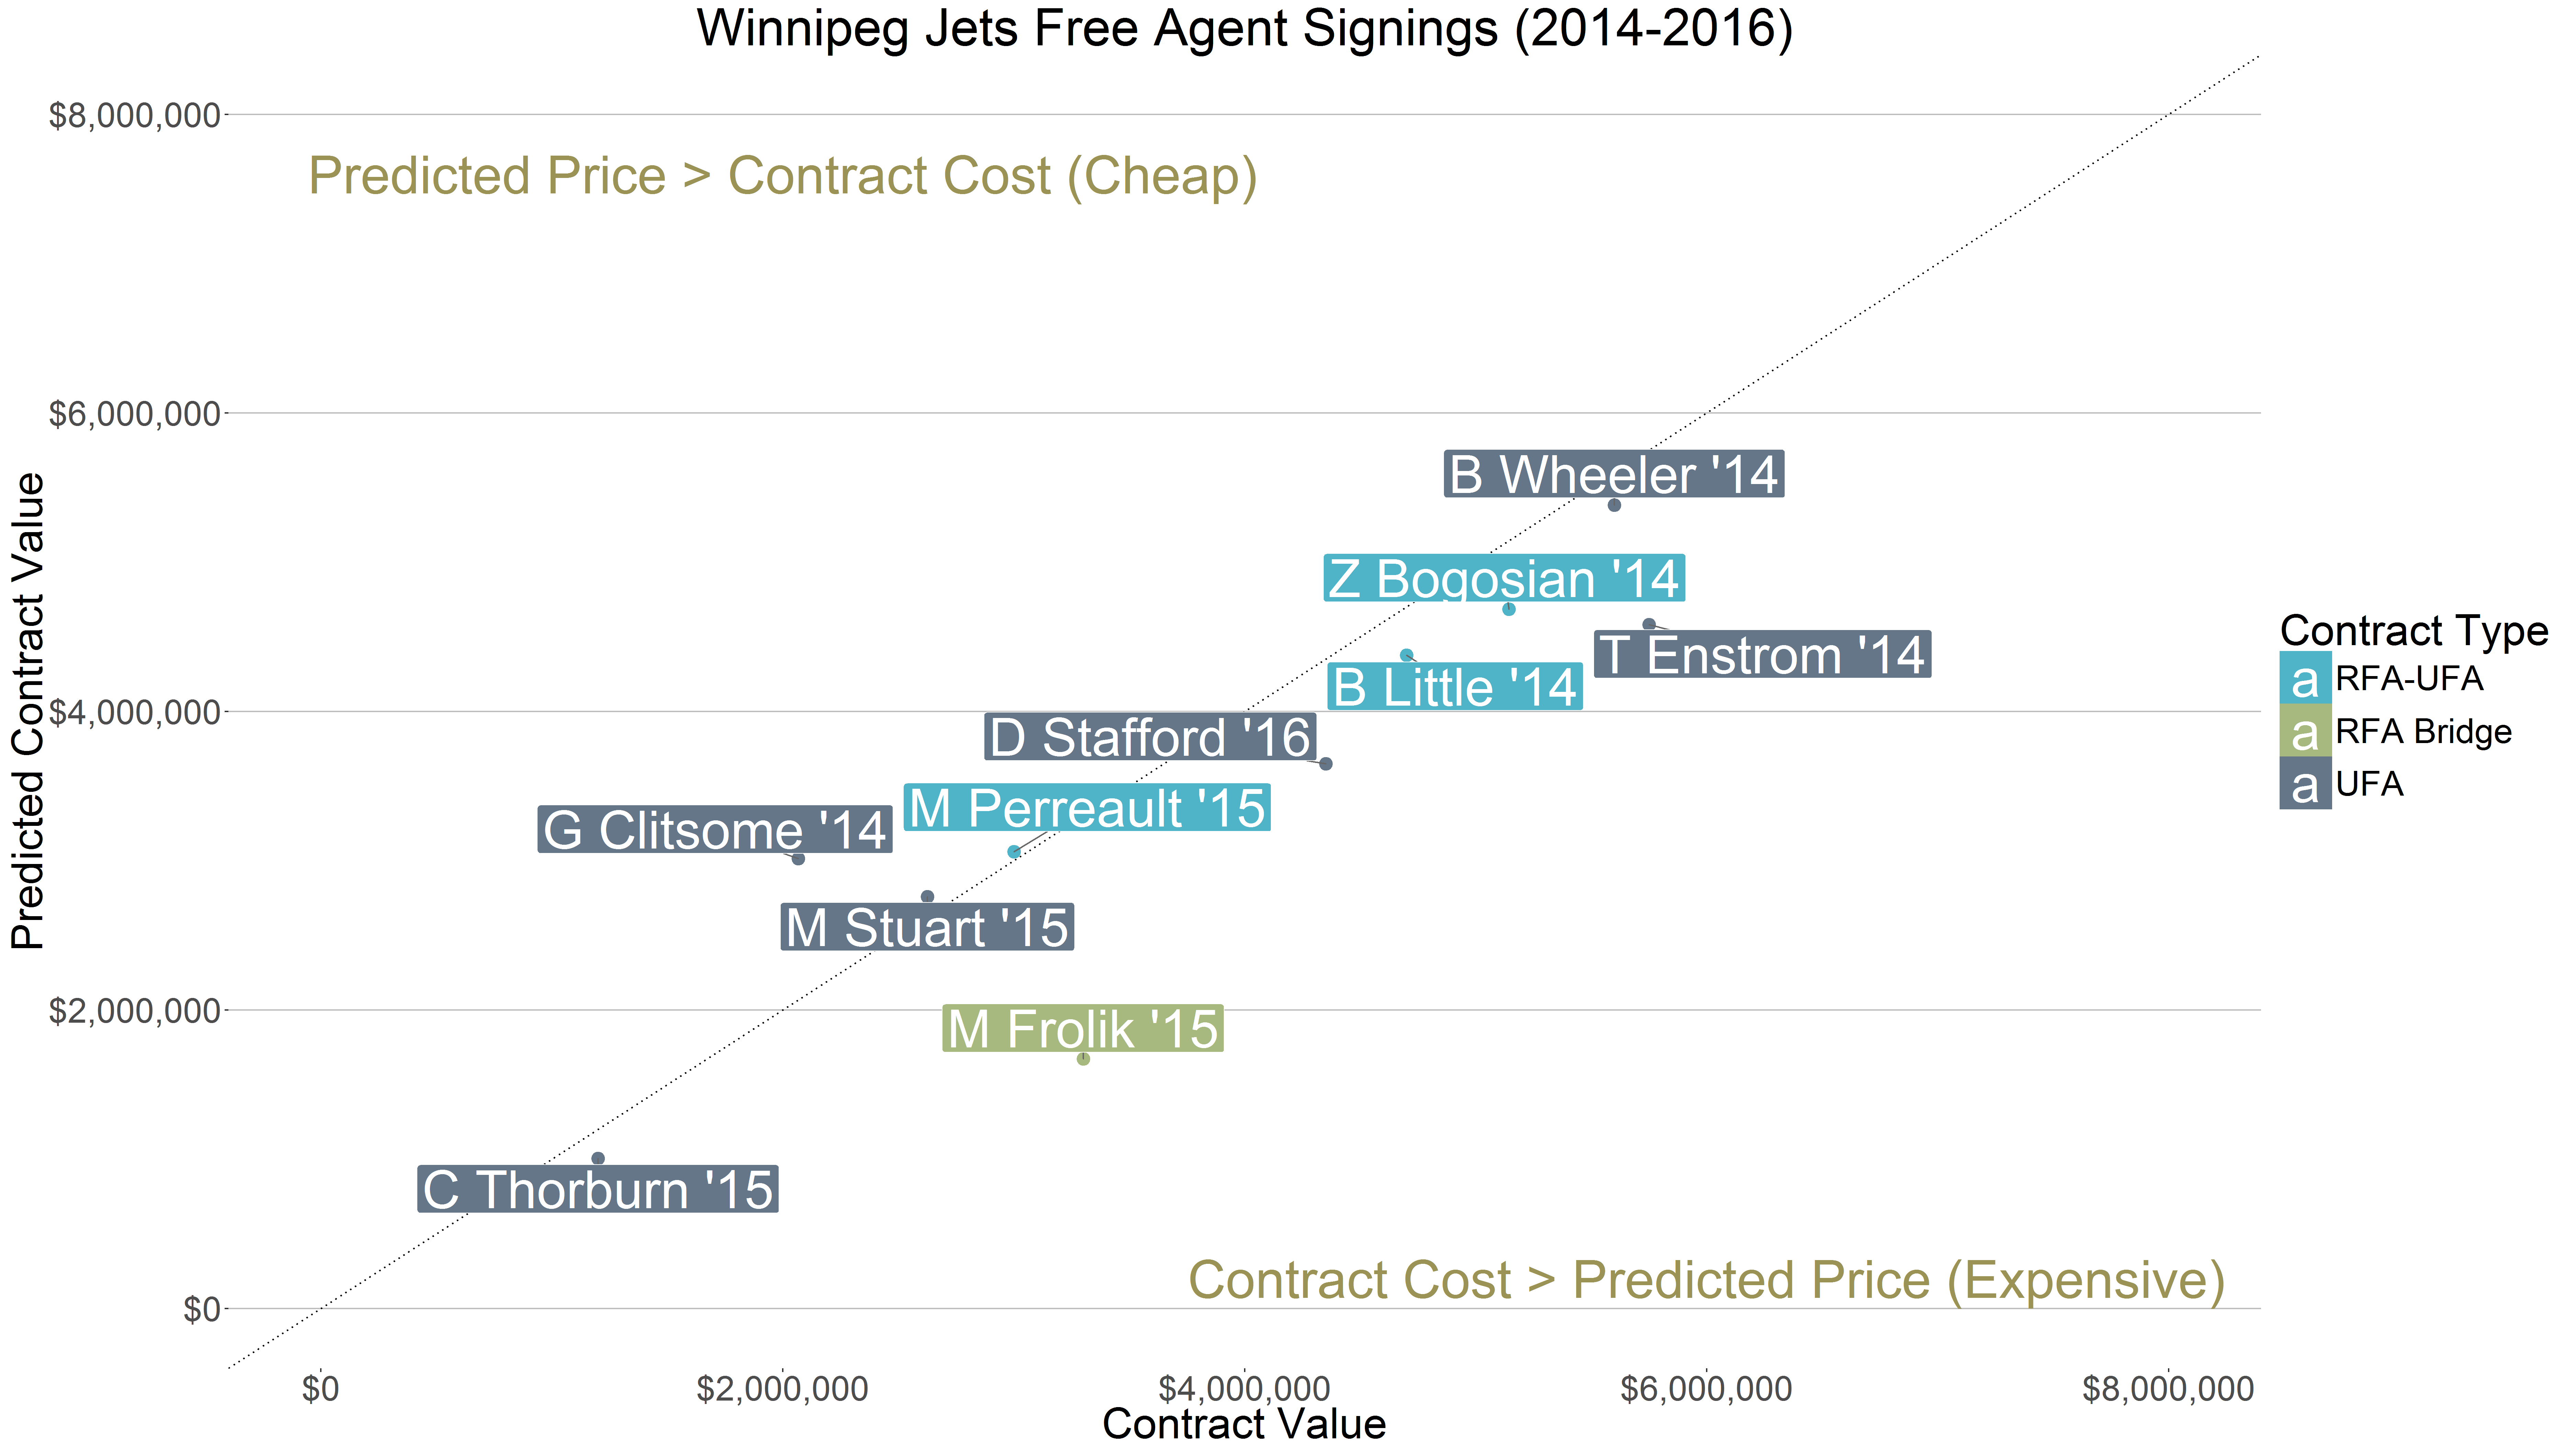
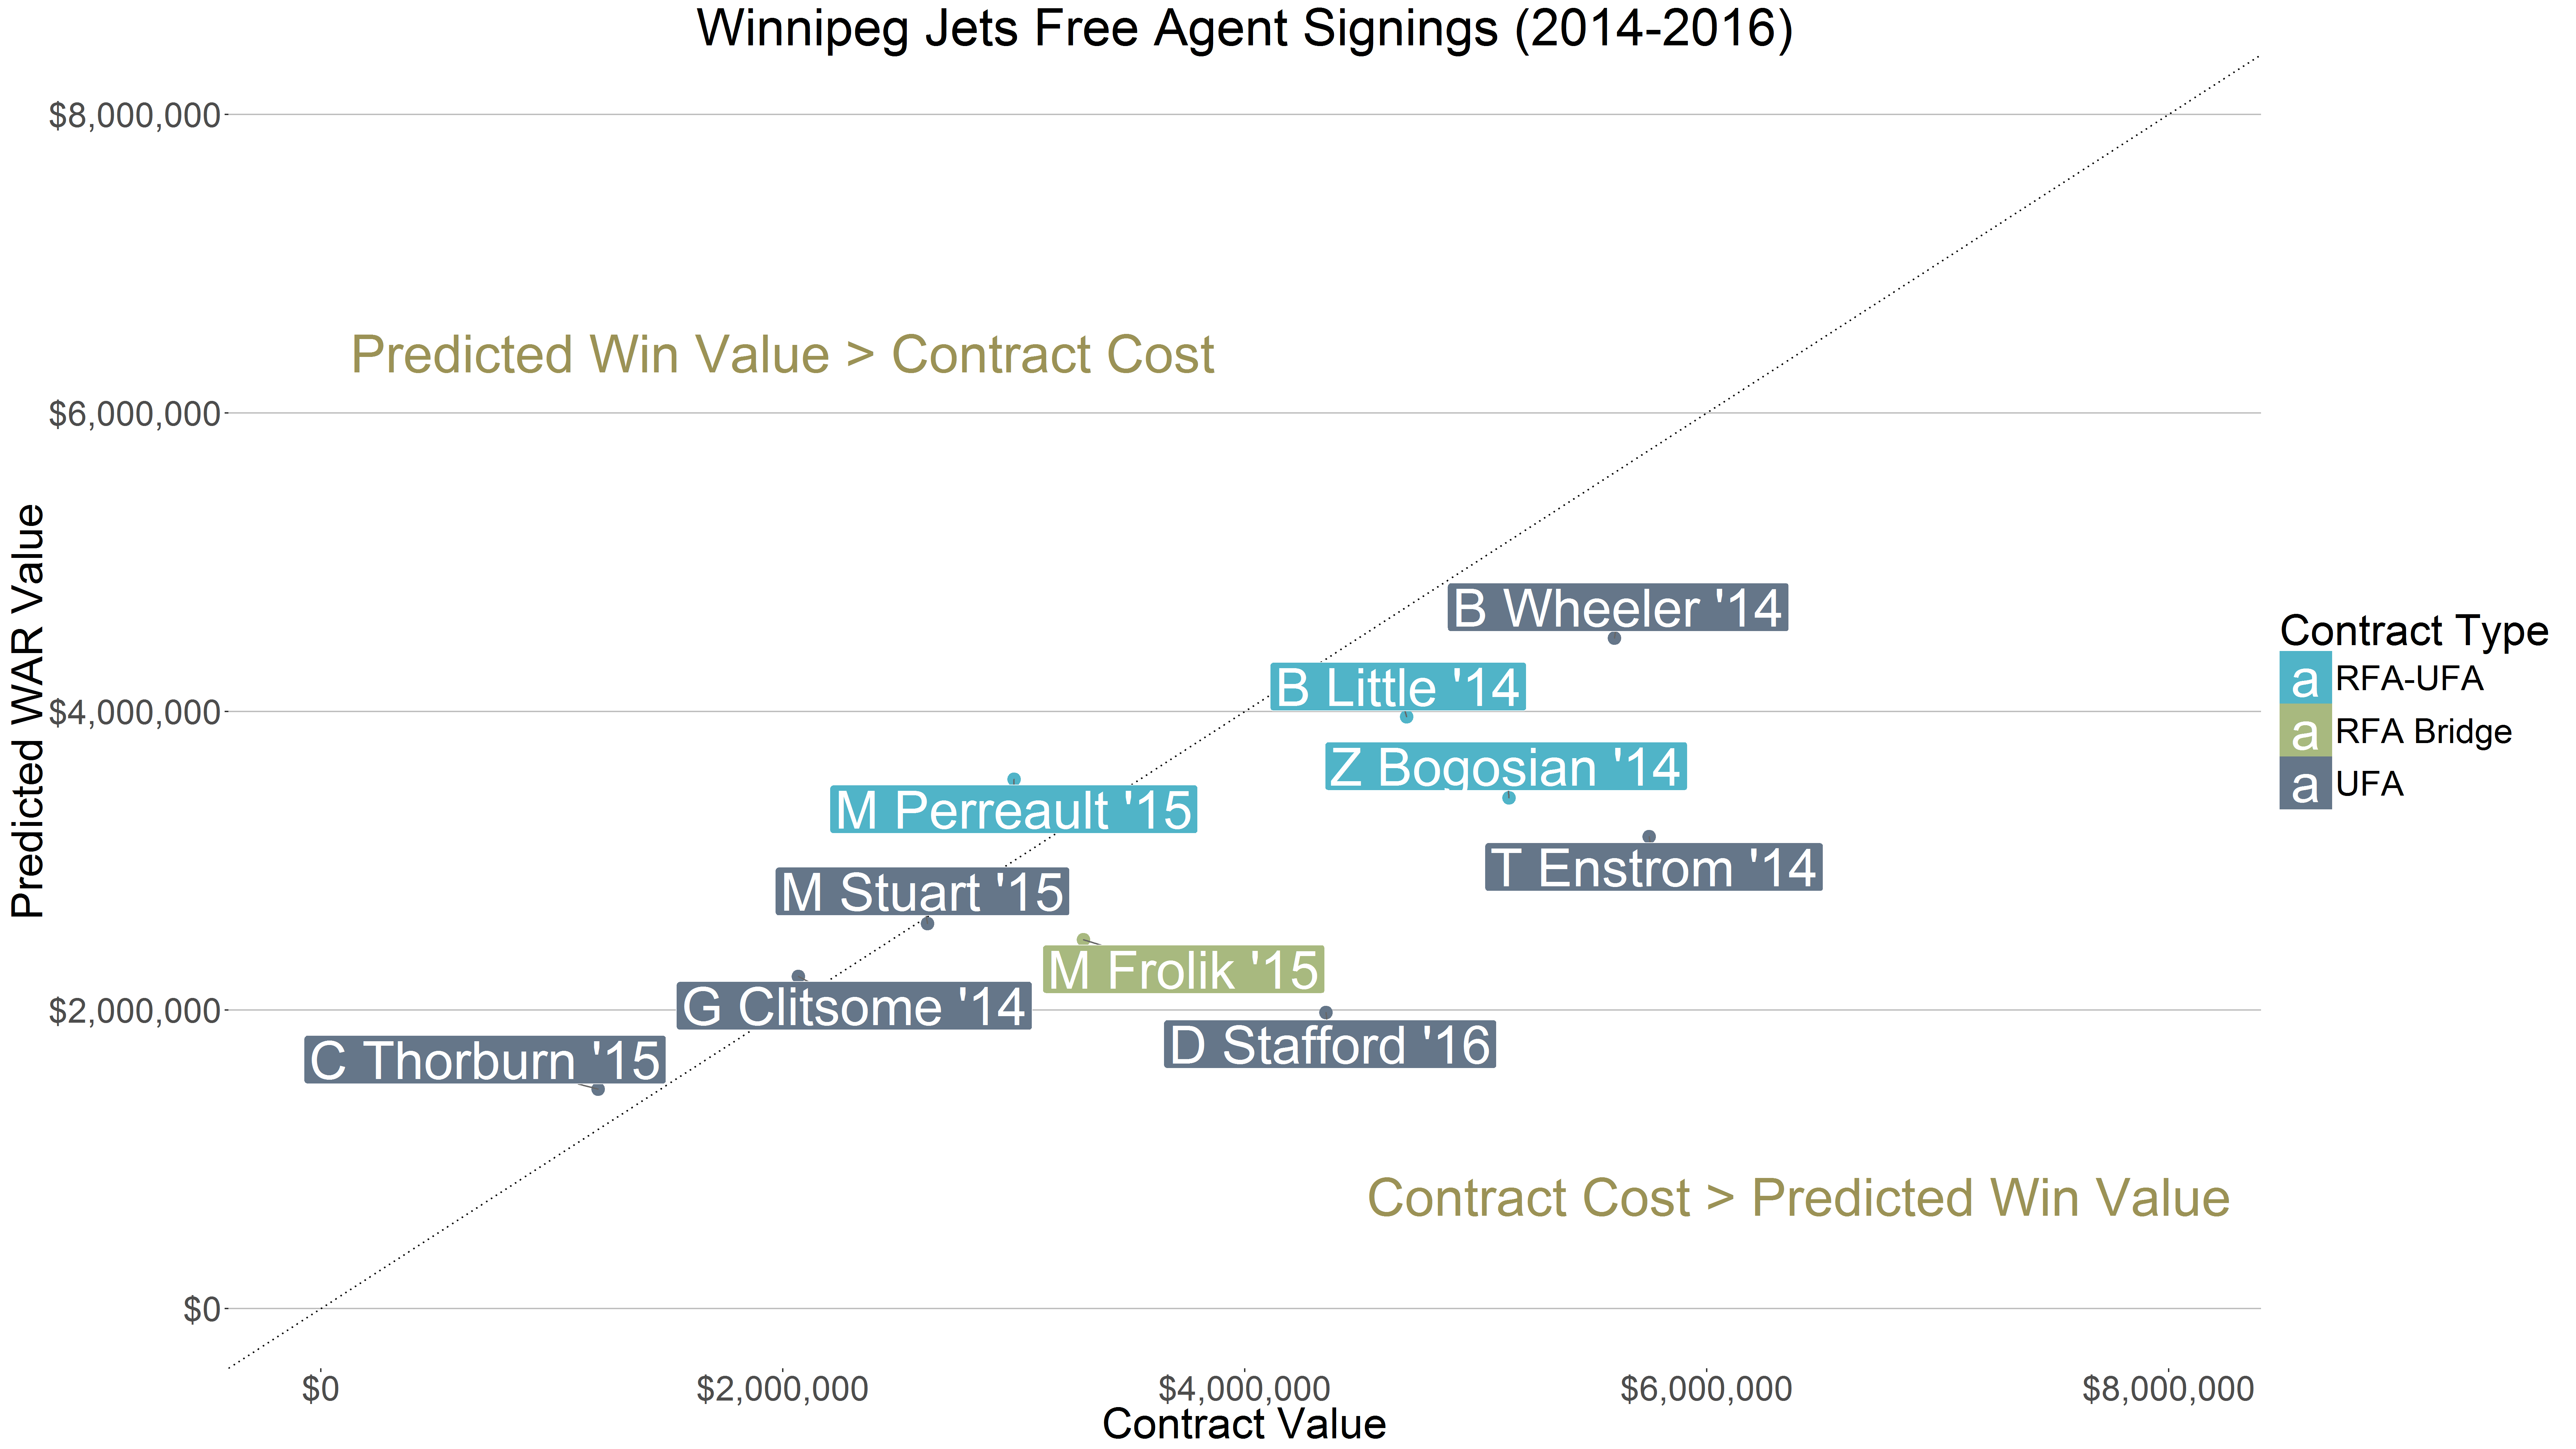
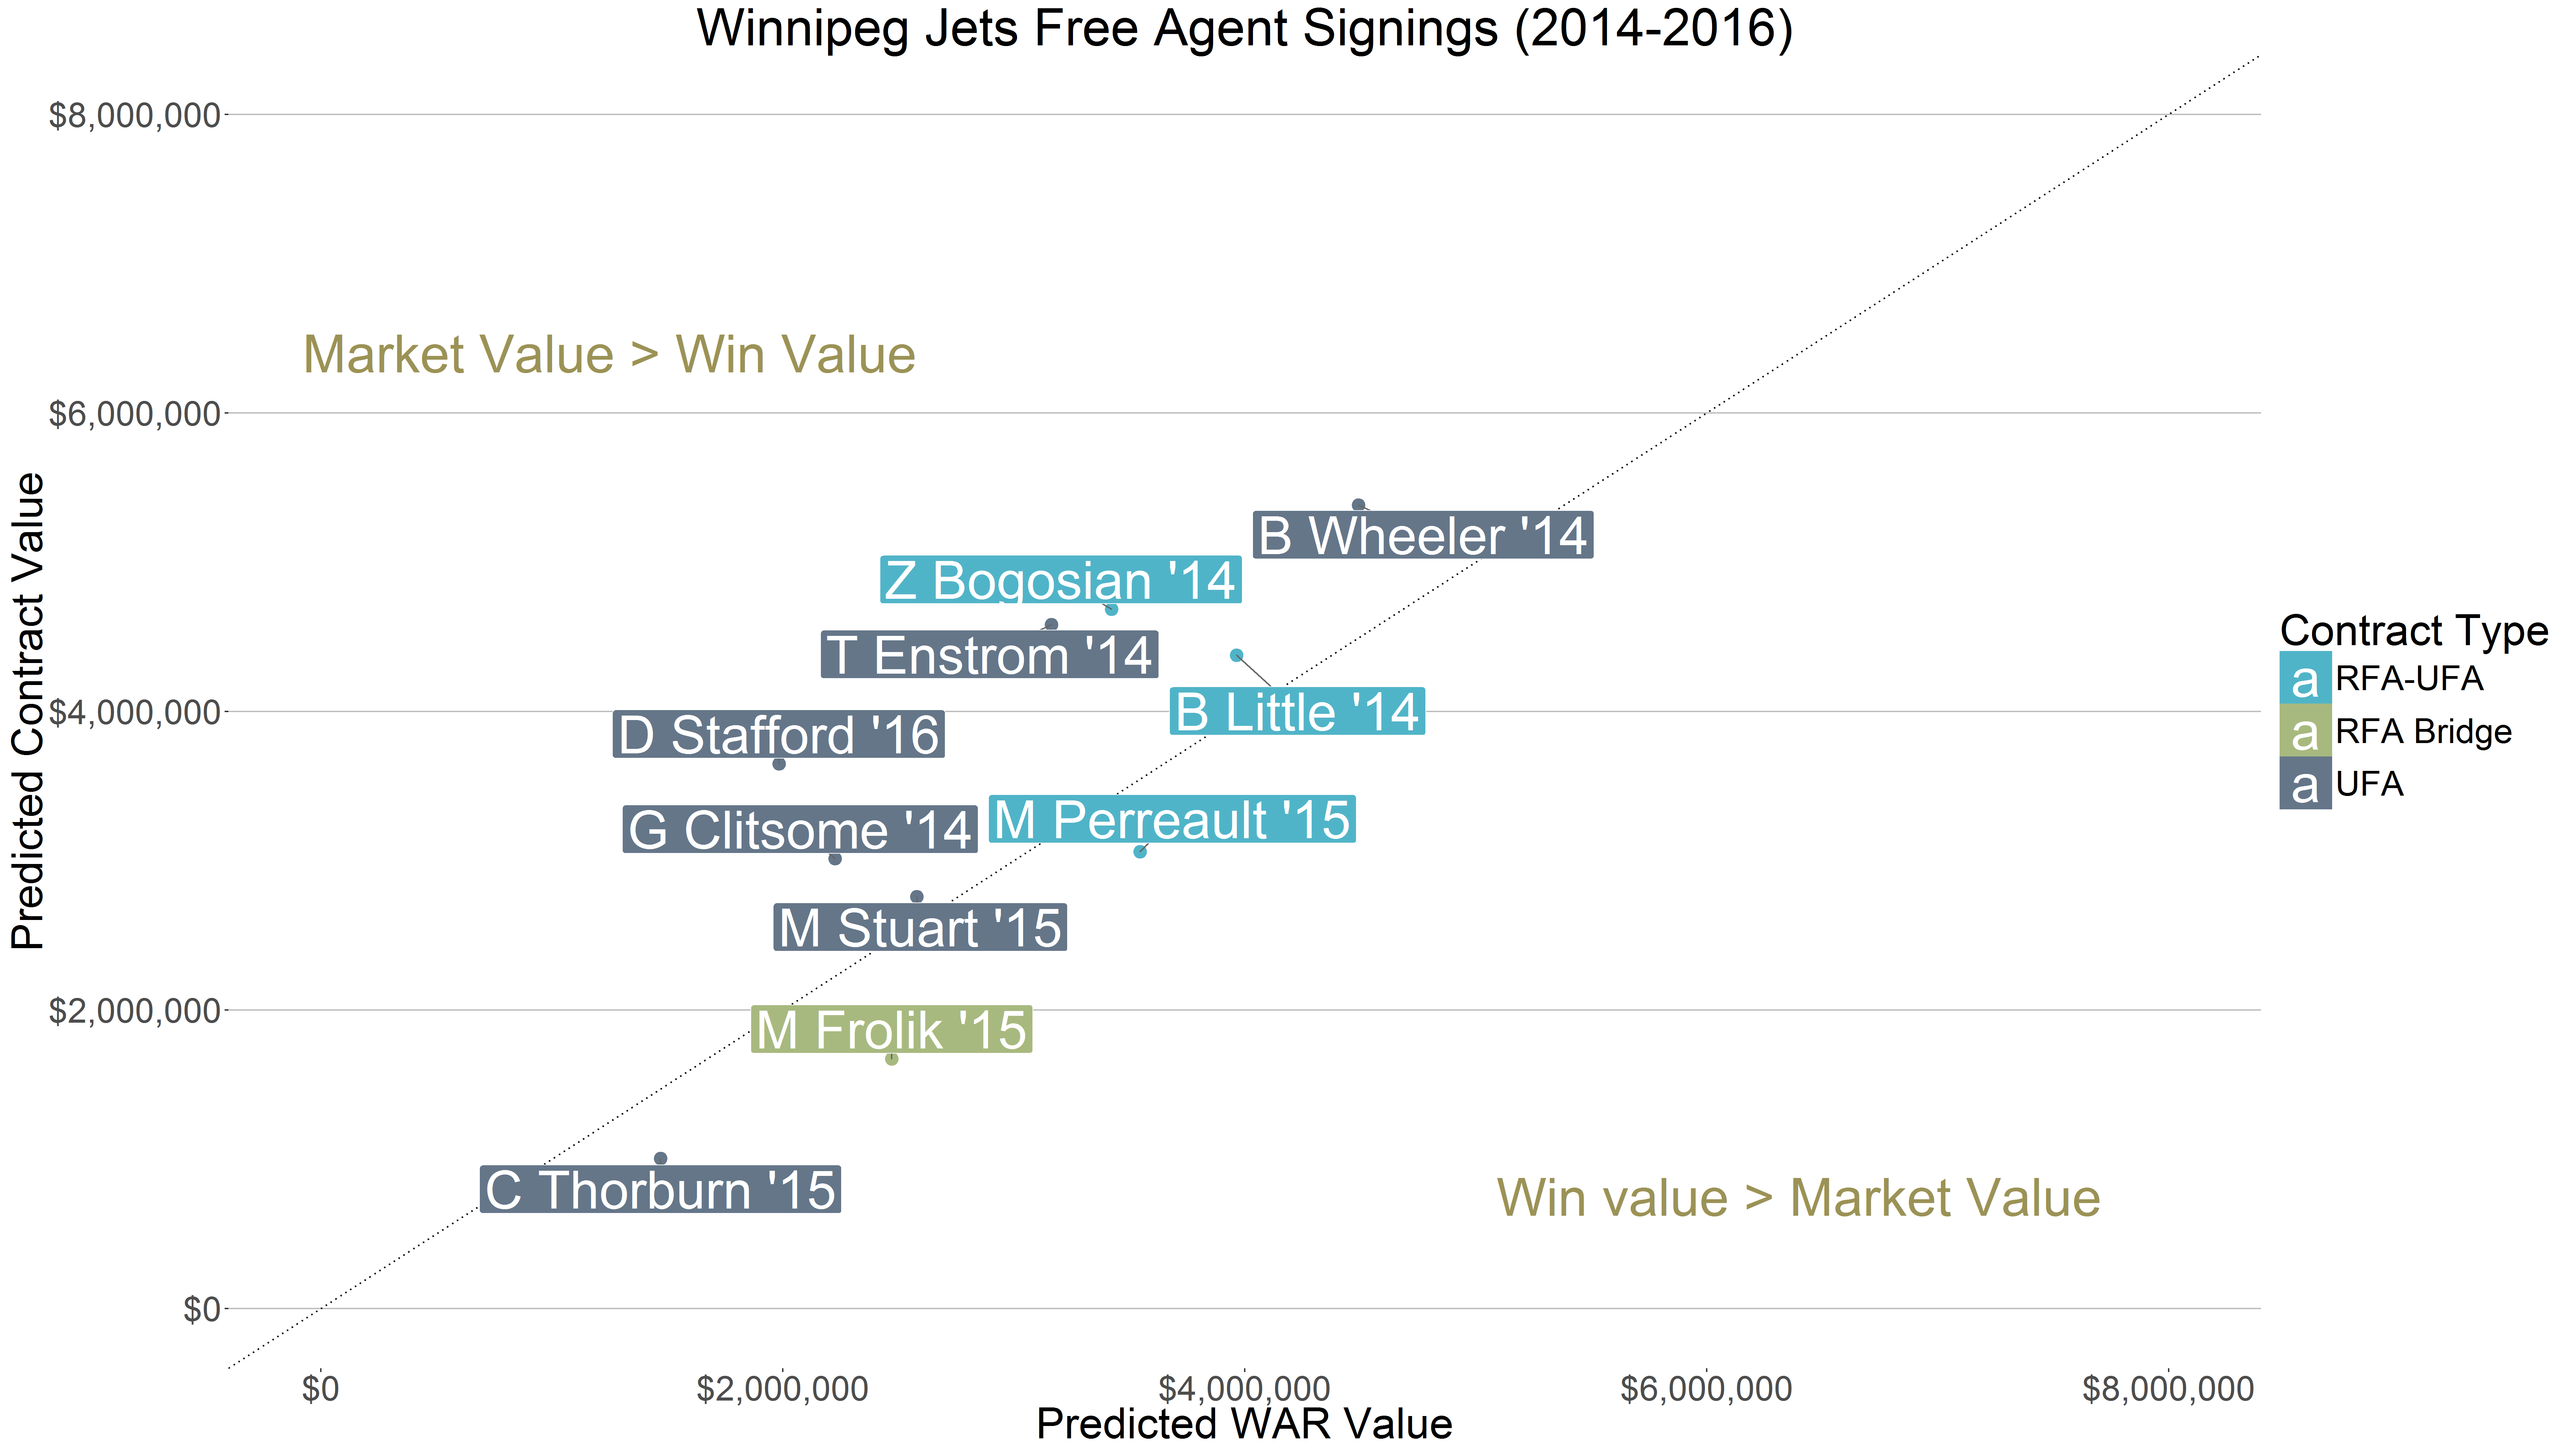
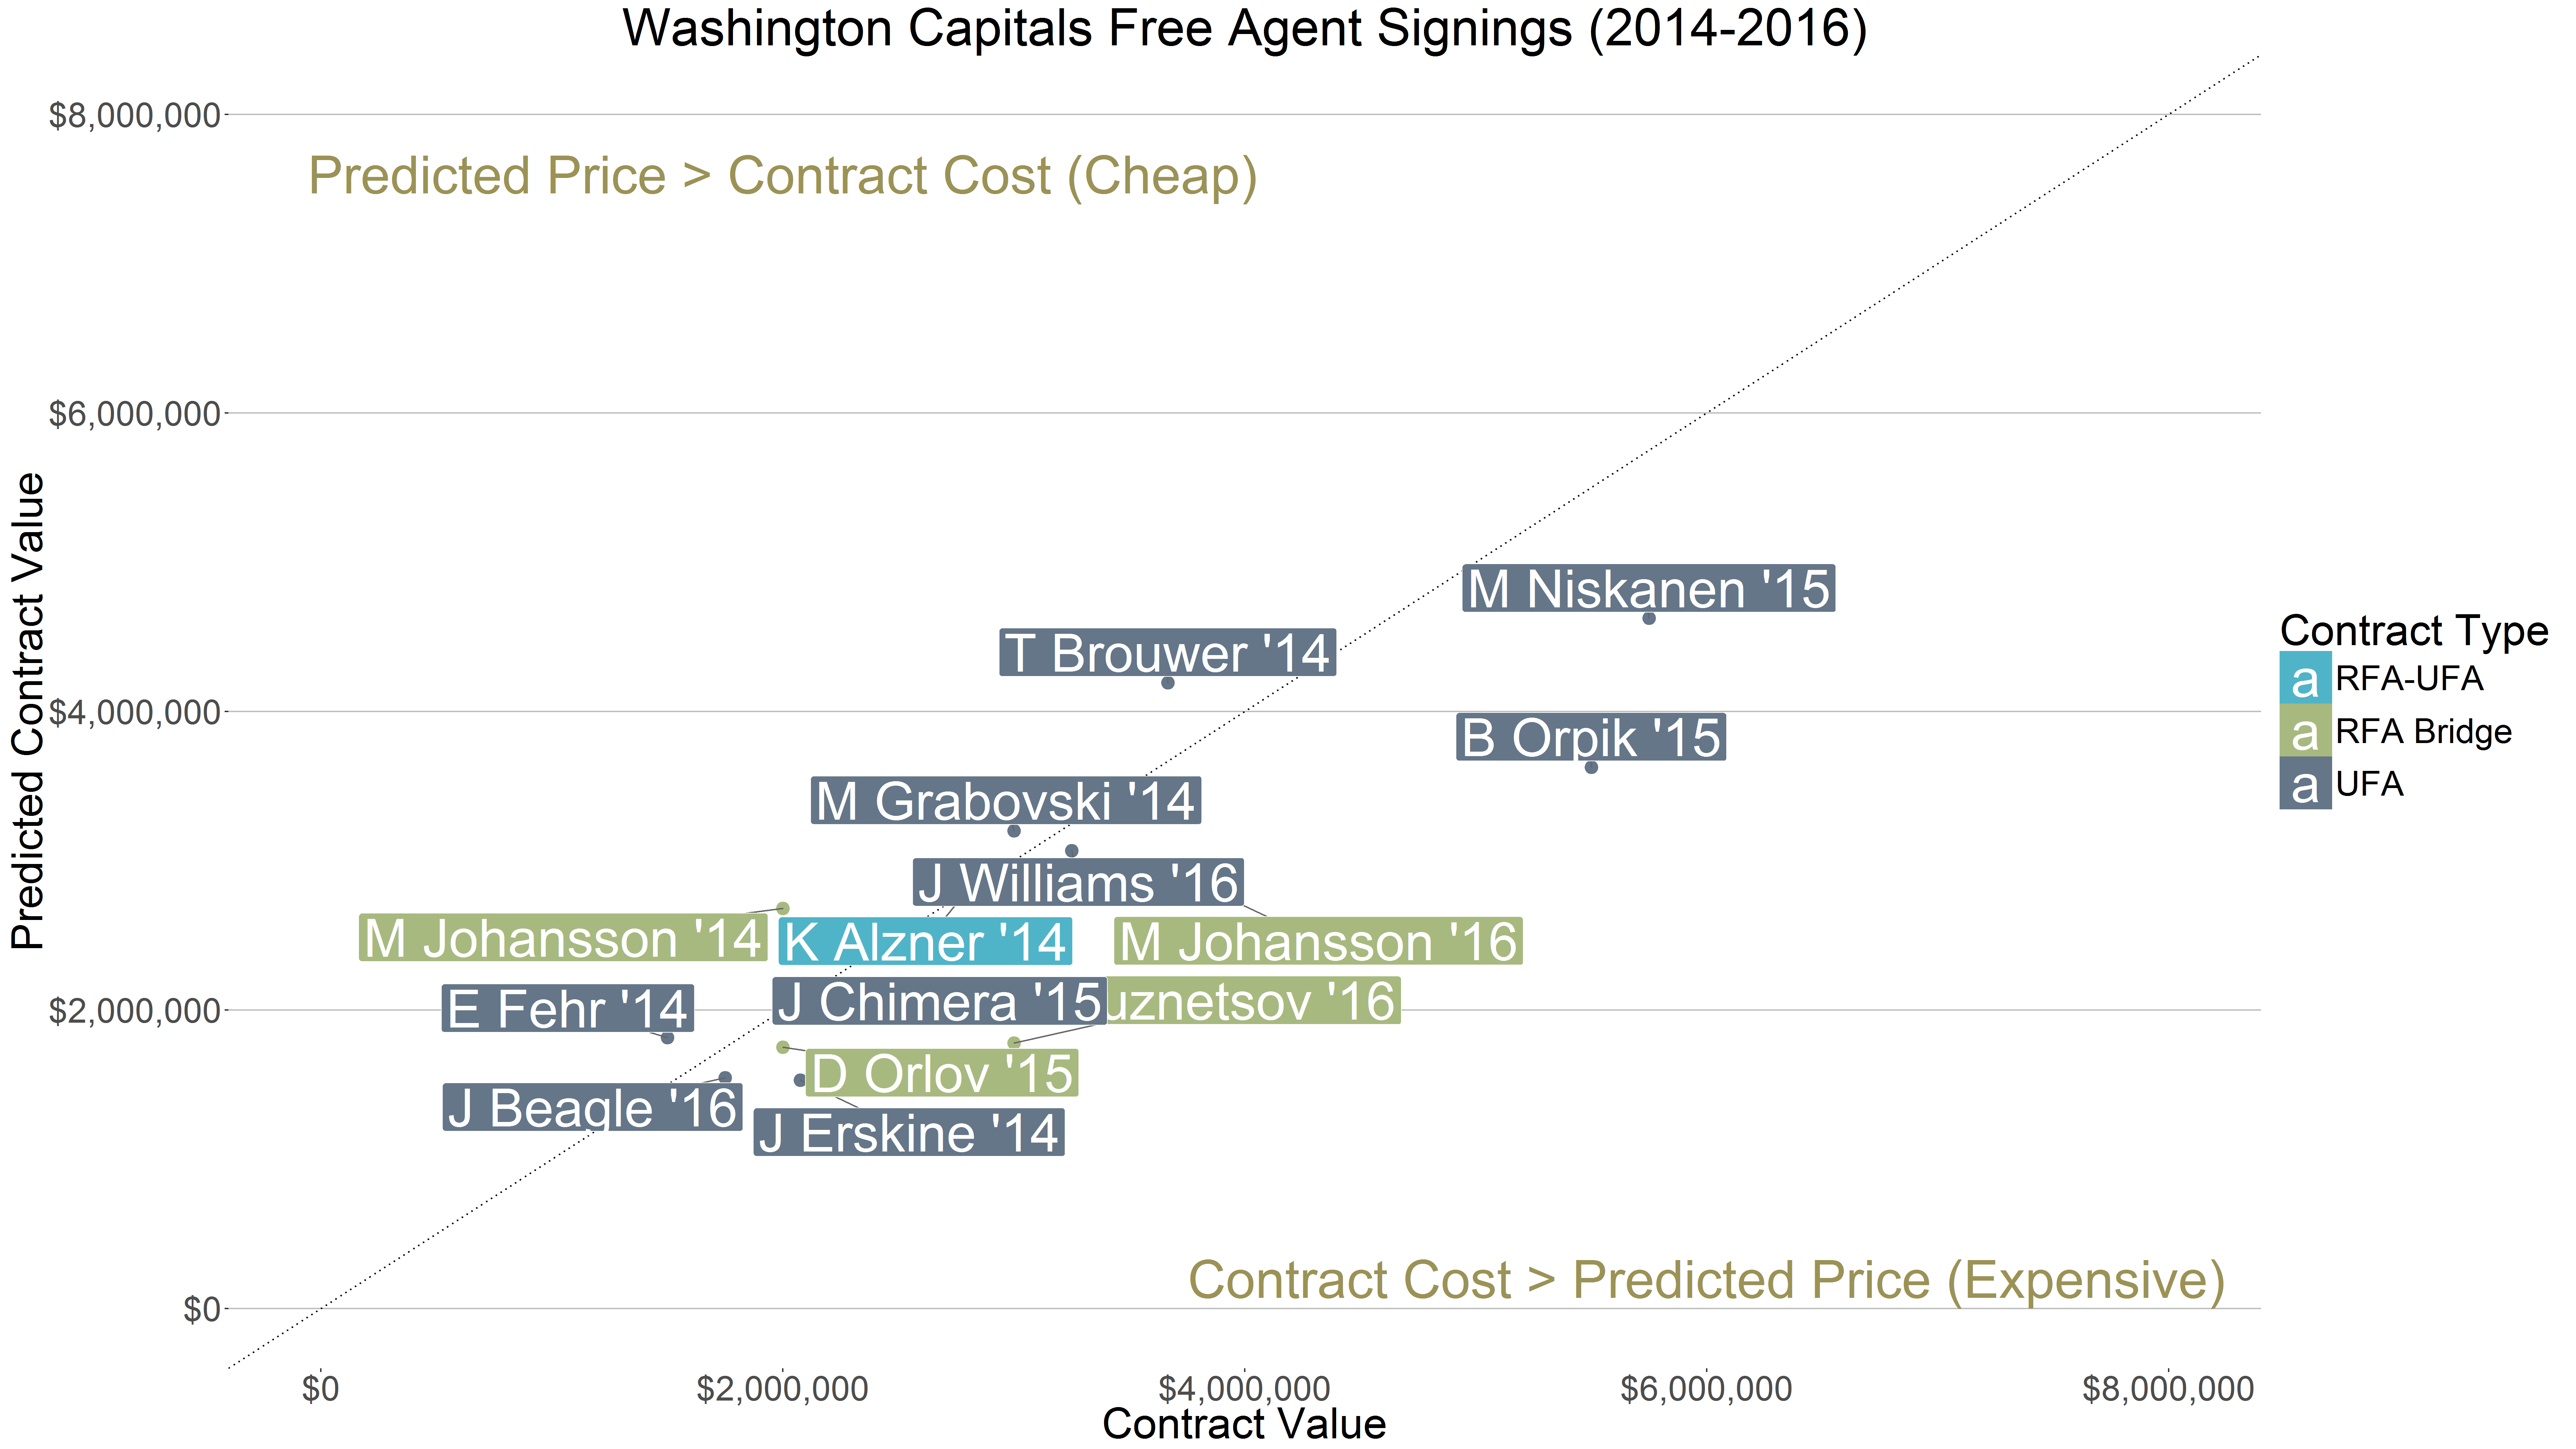
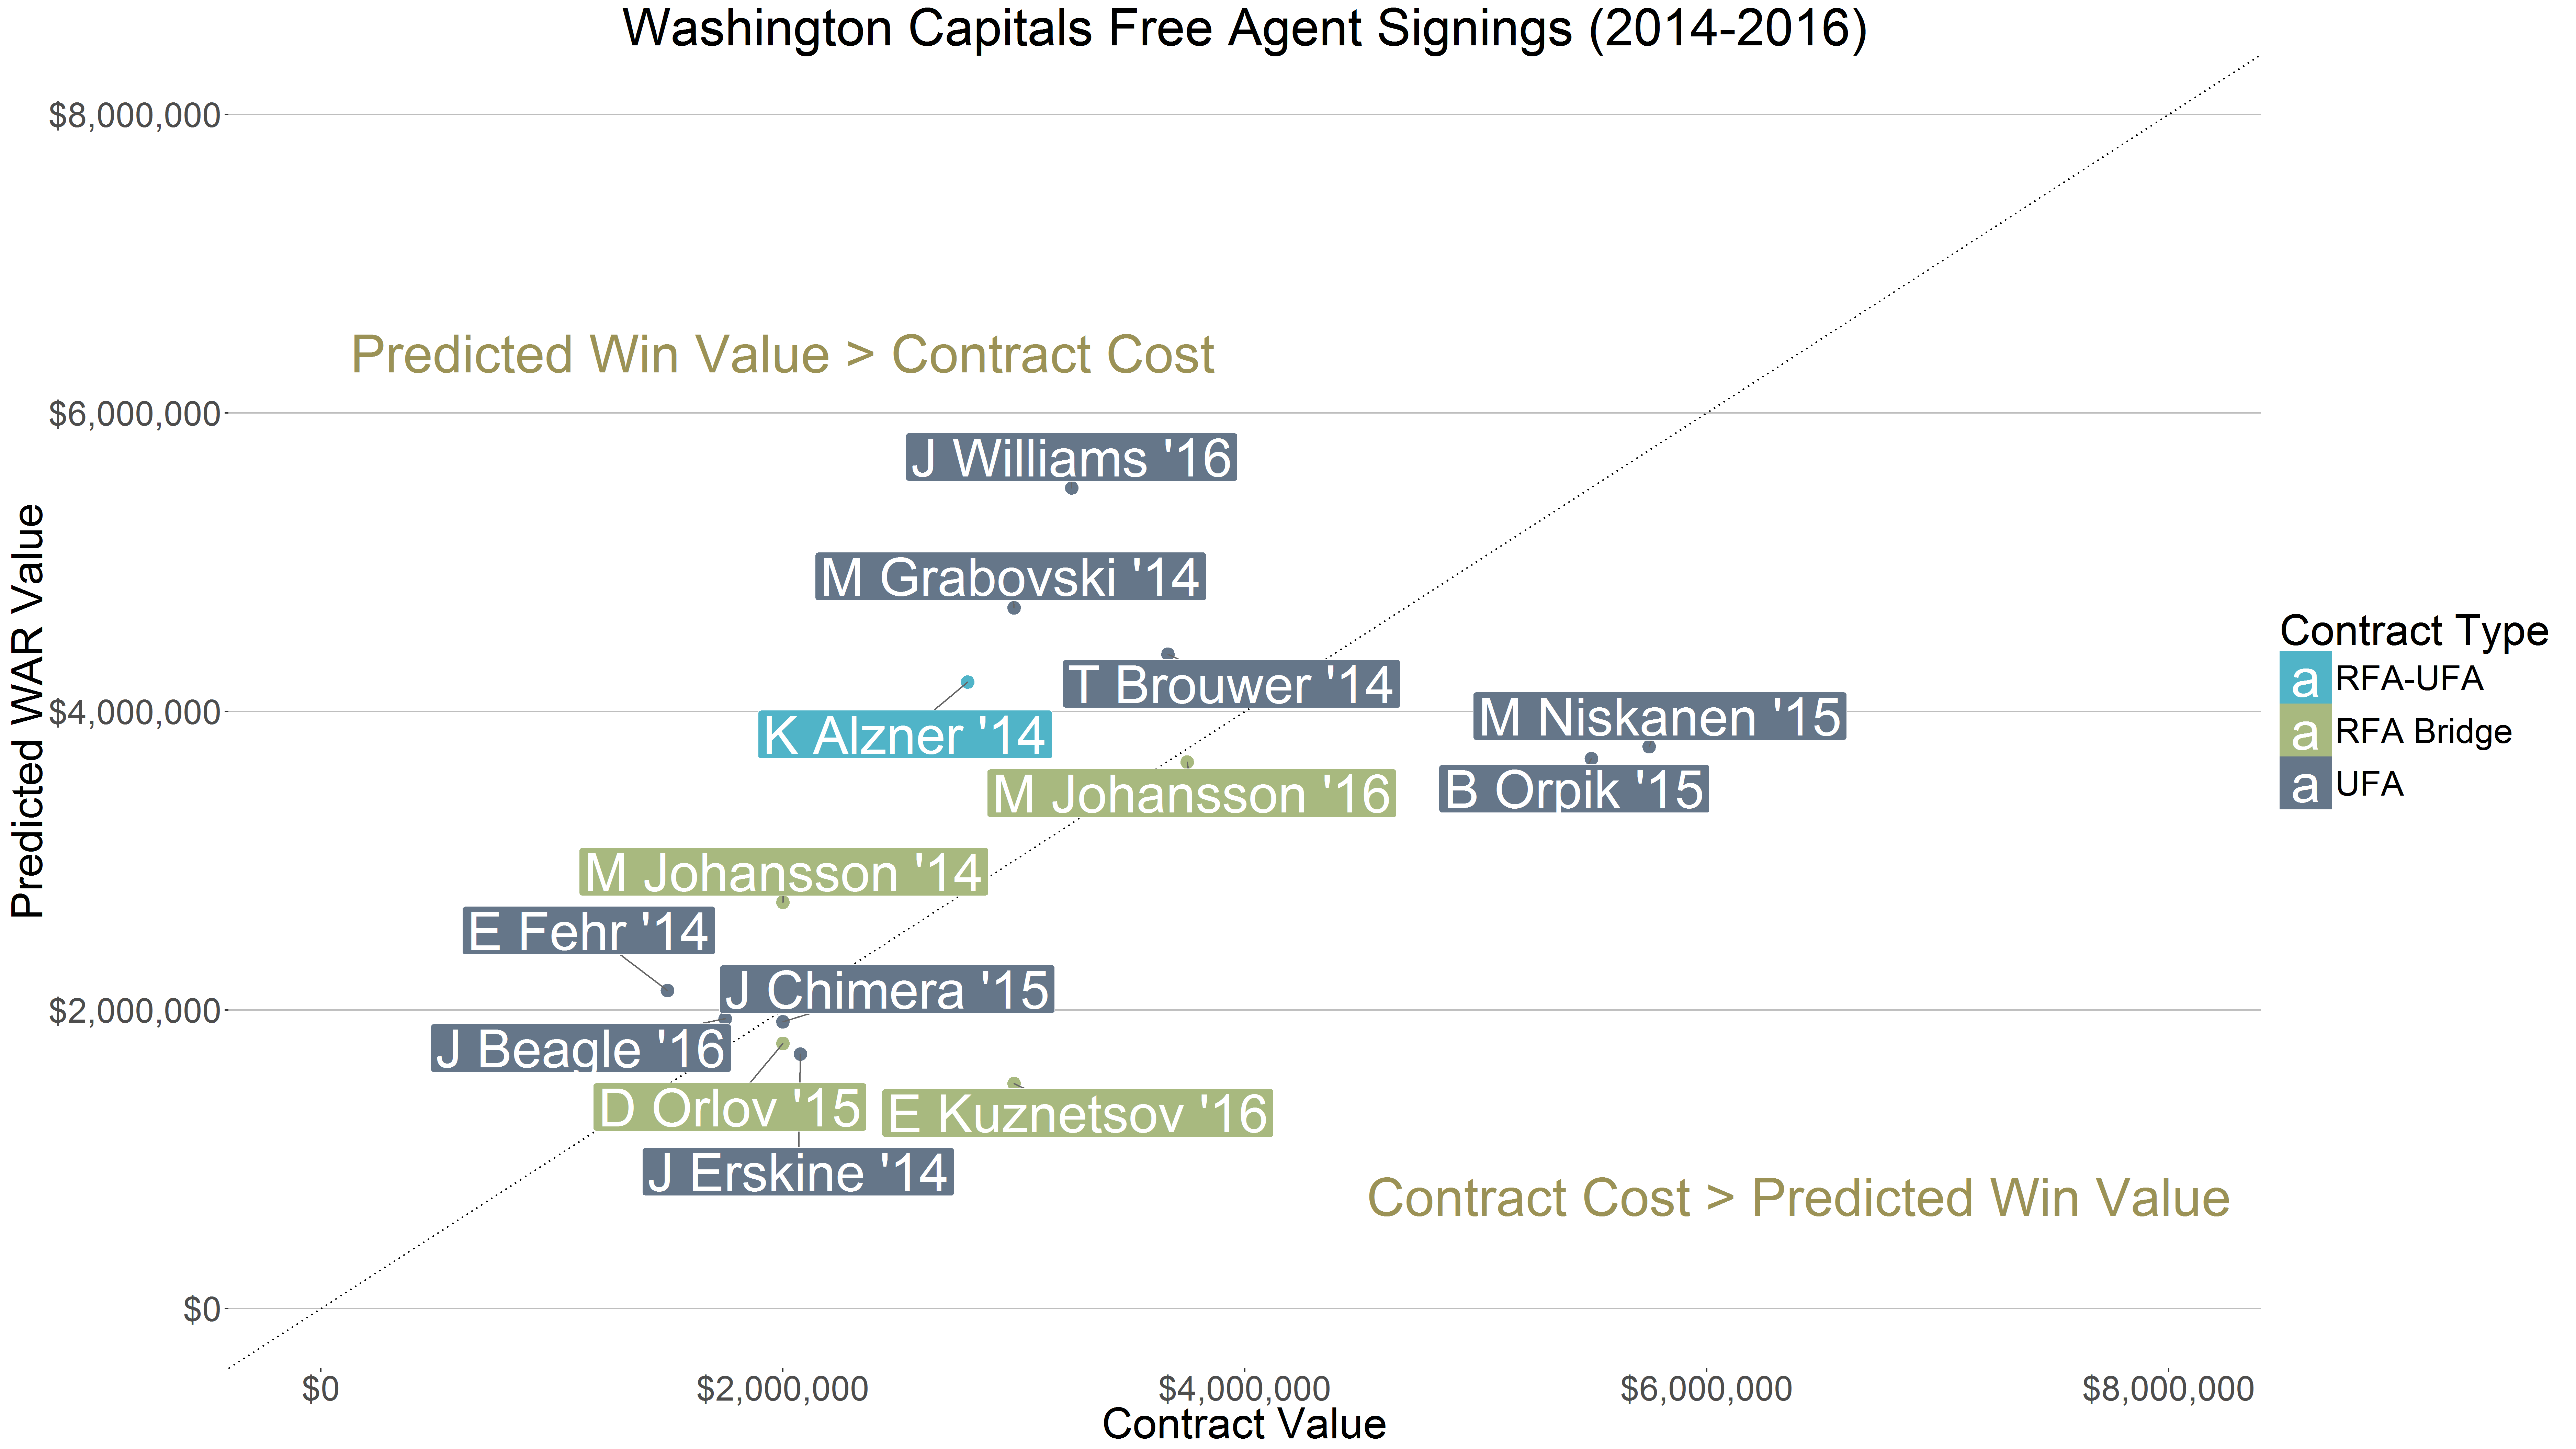
Each team has 3 charts available that show:
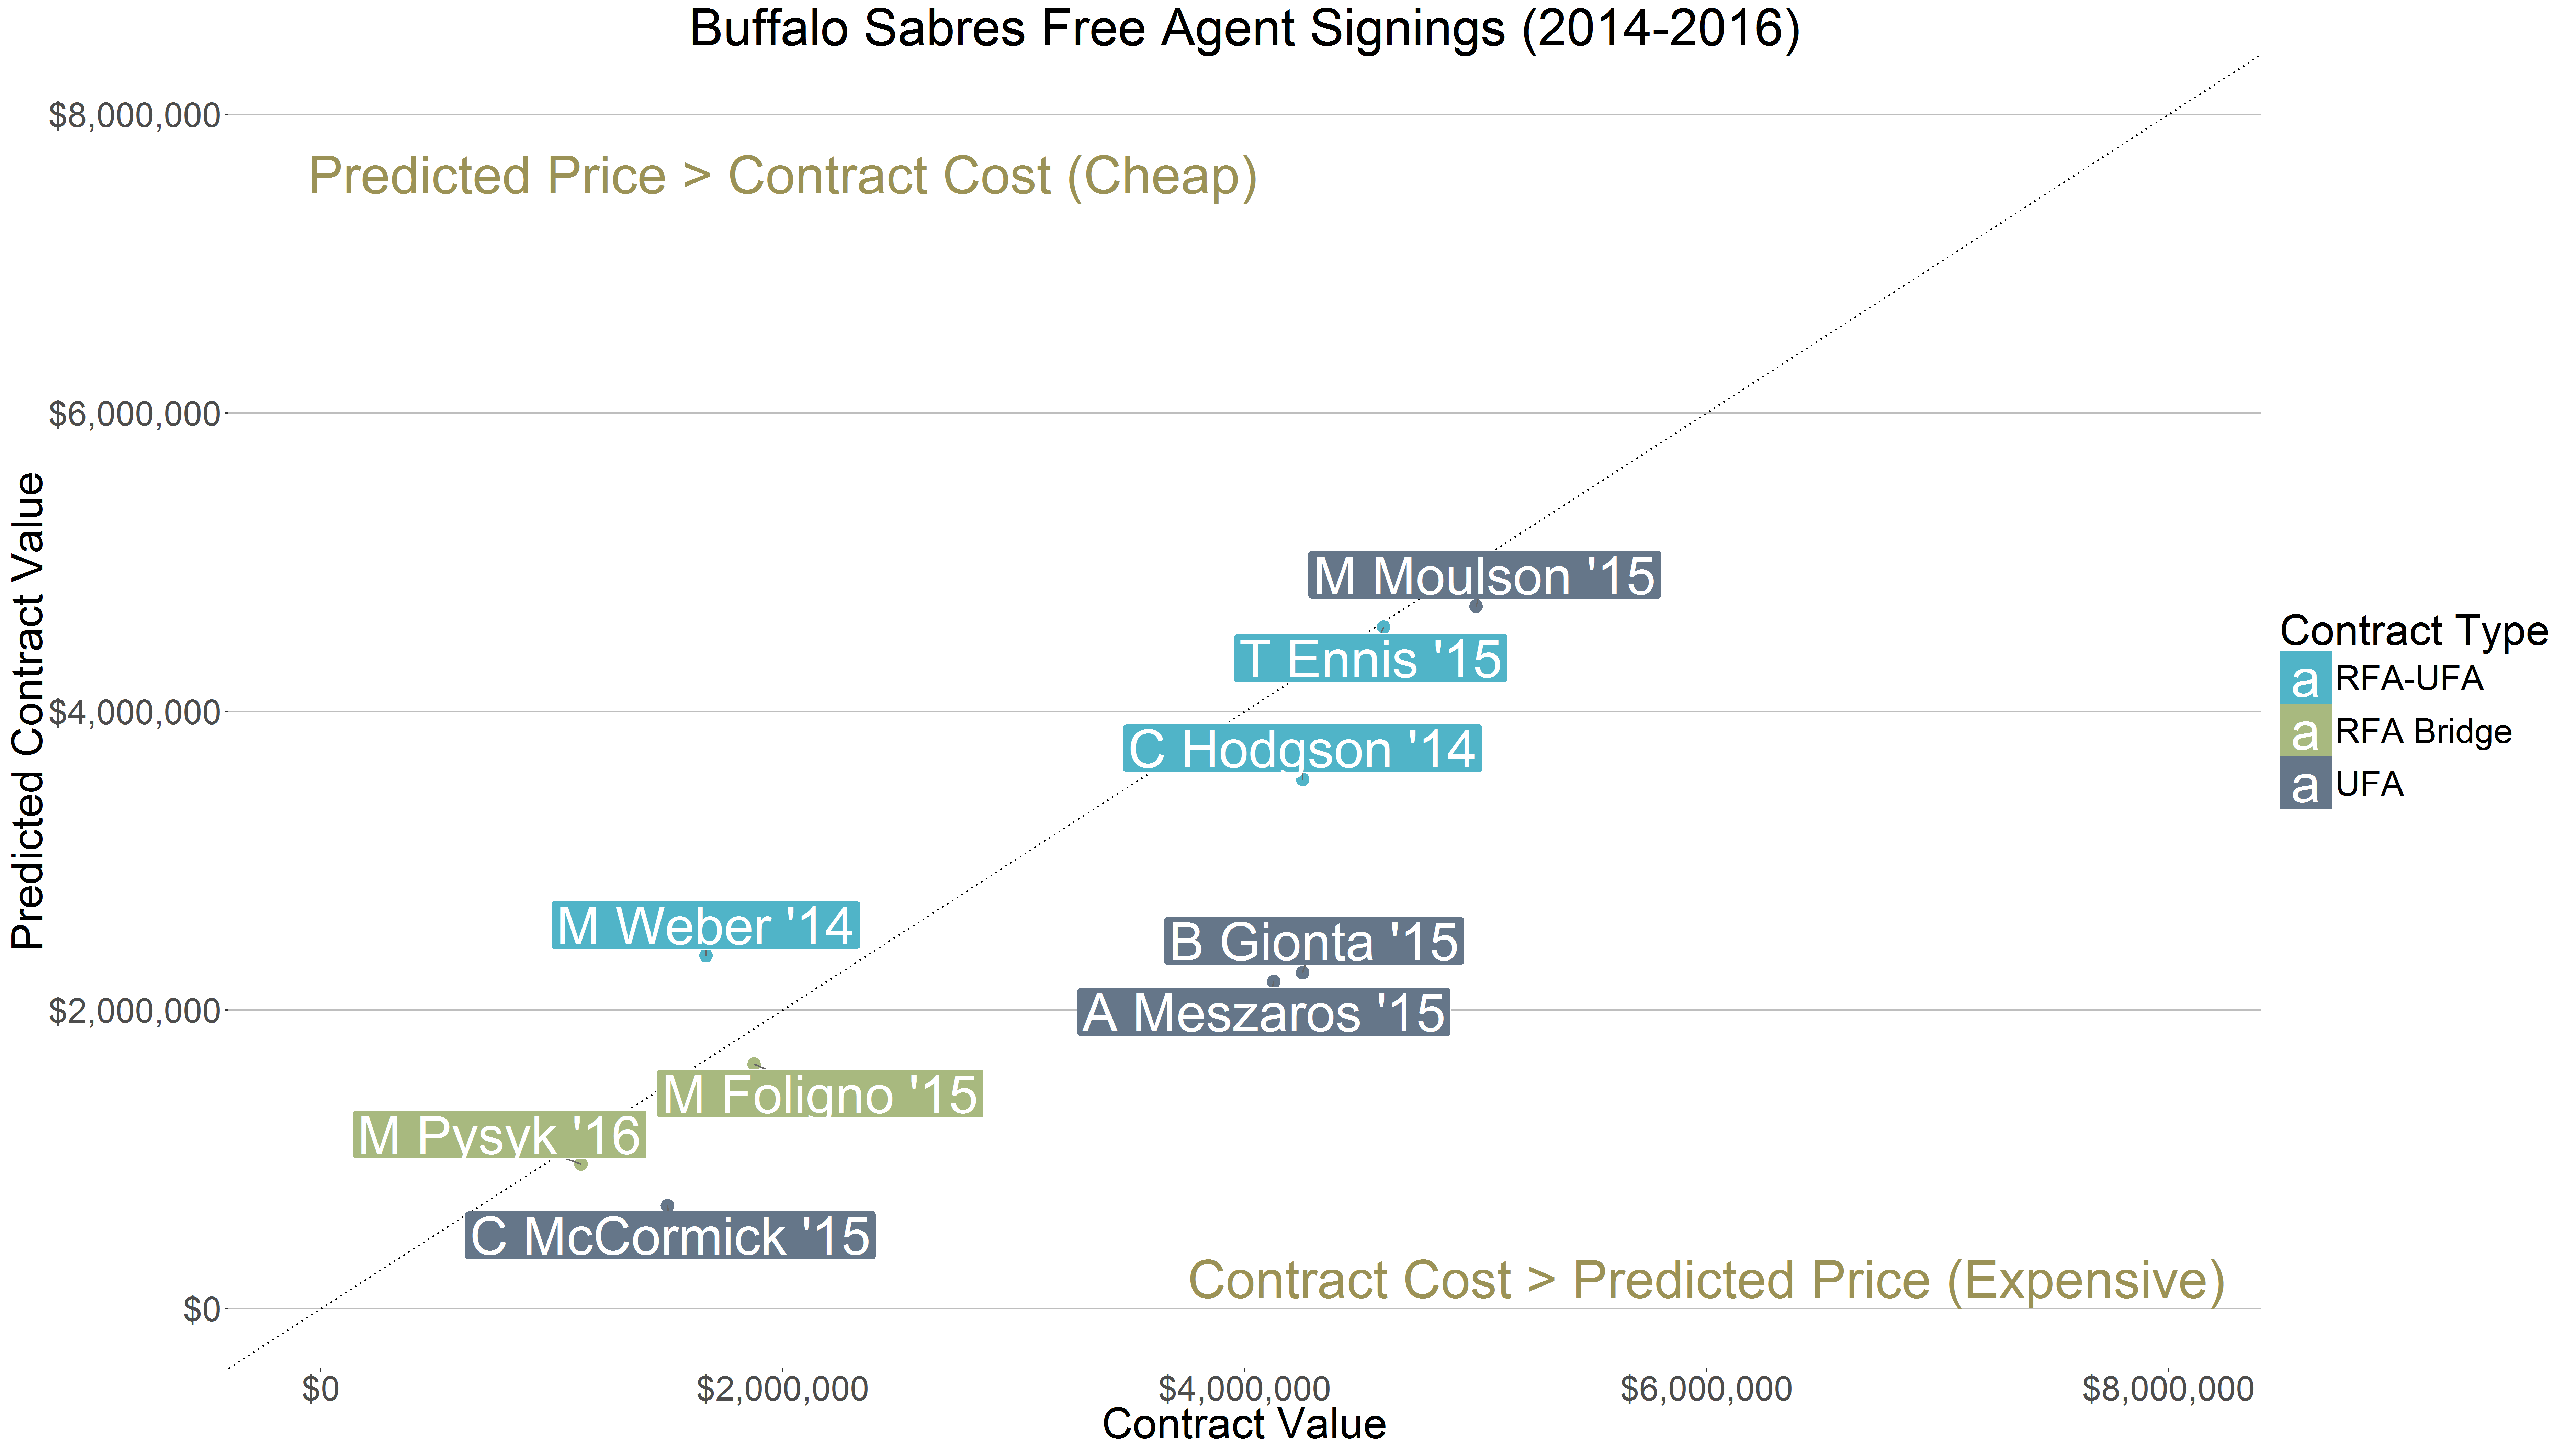
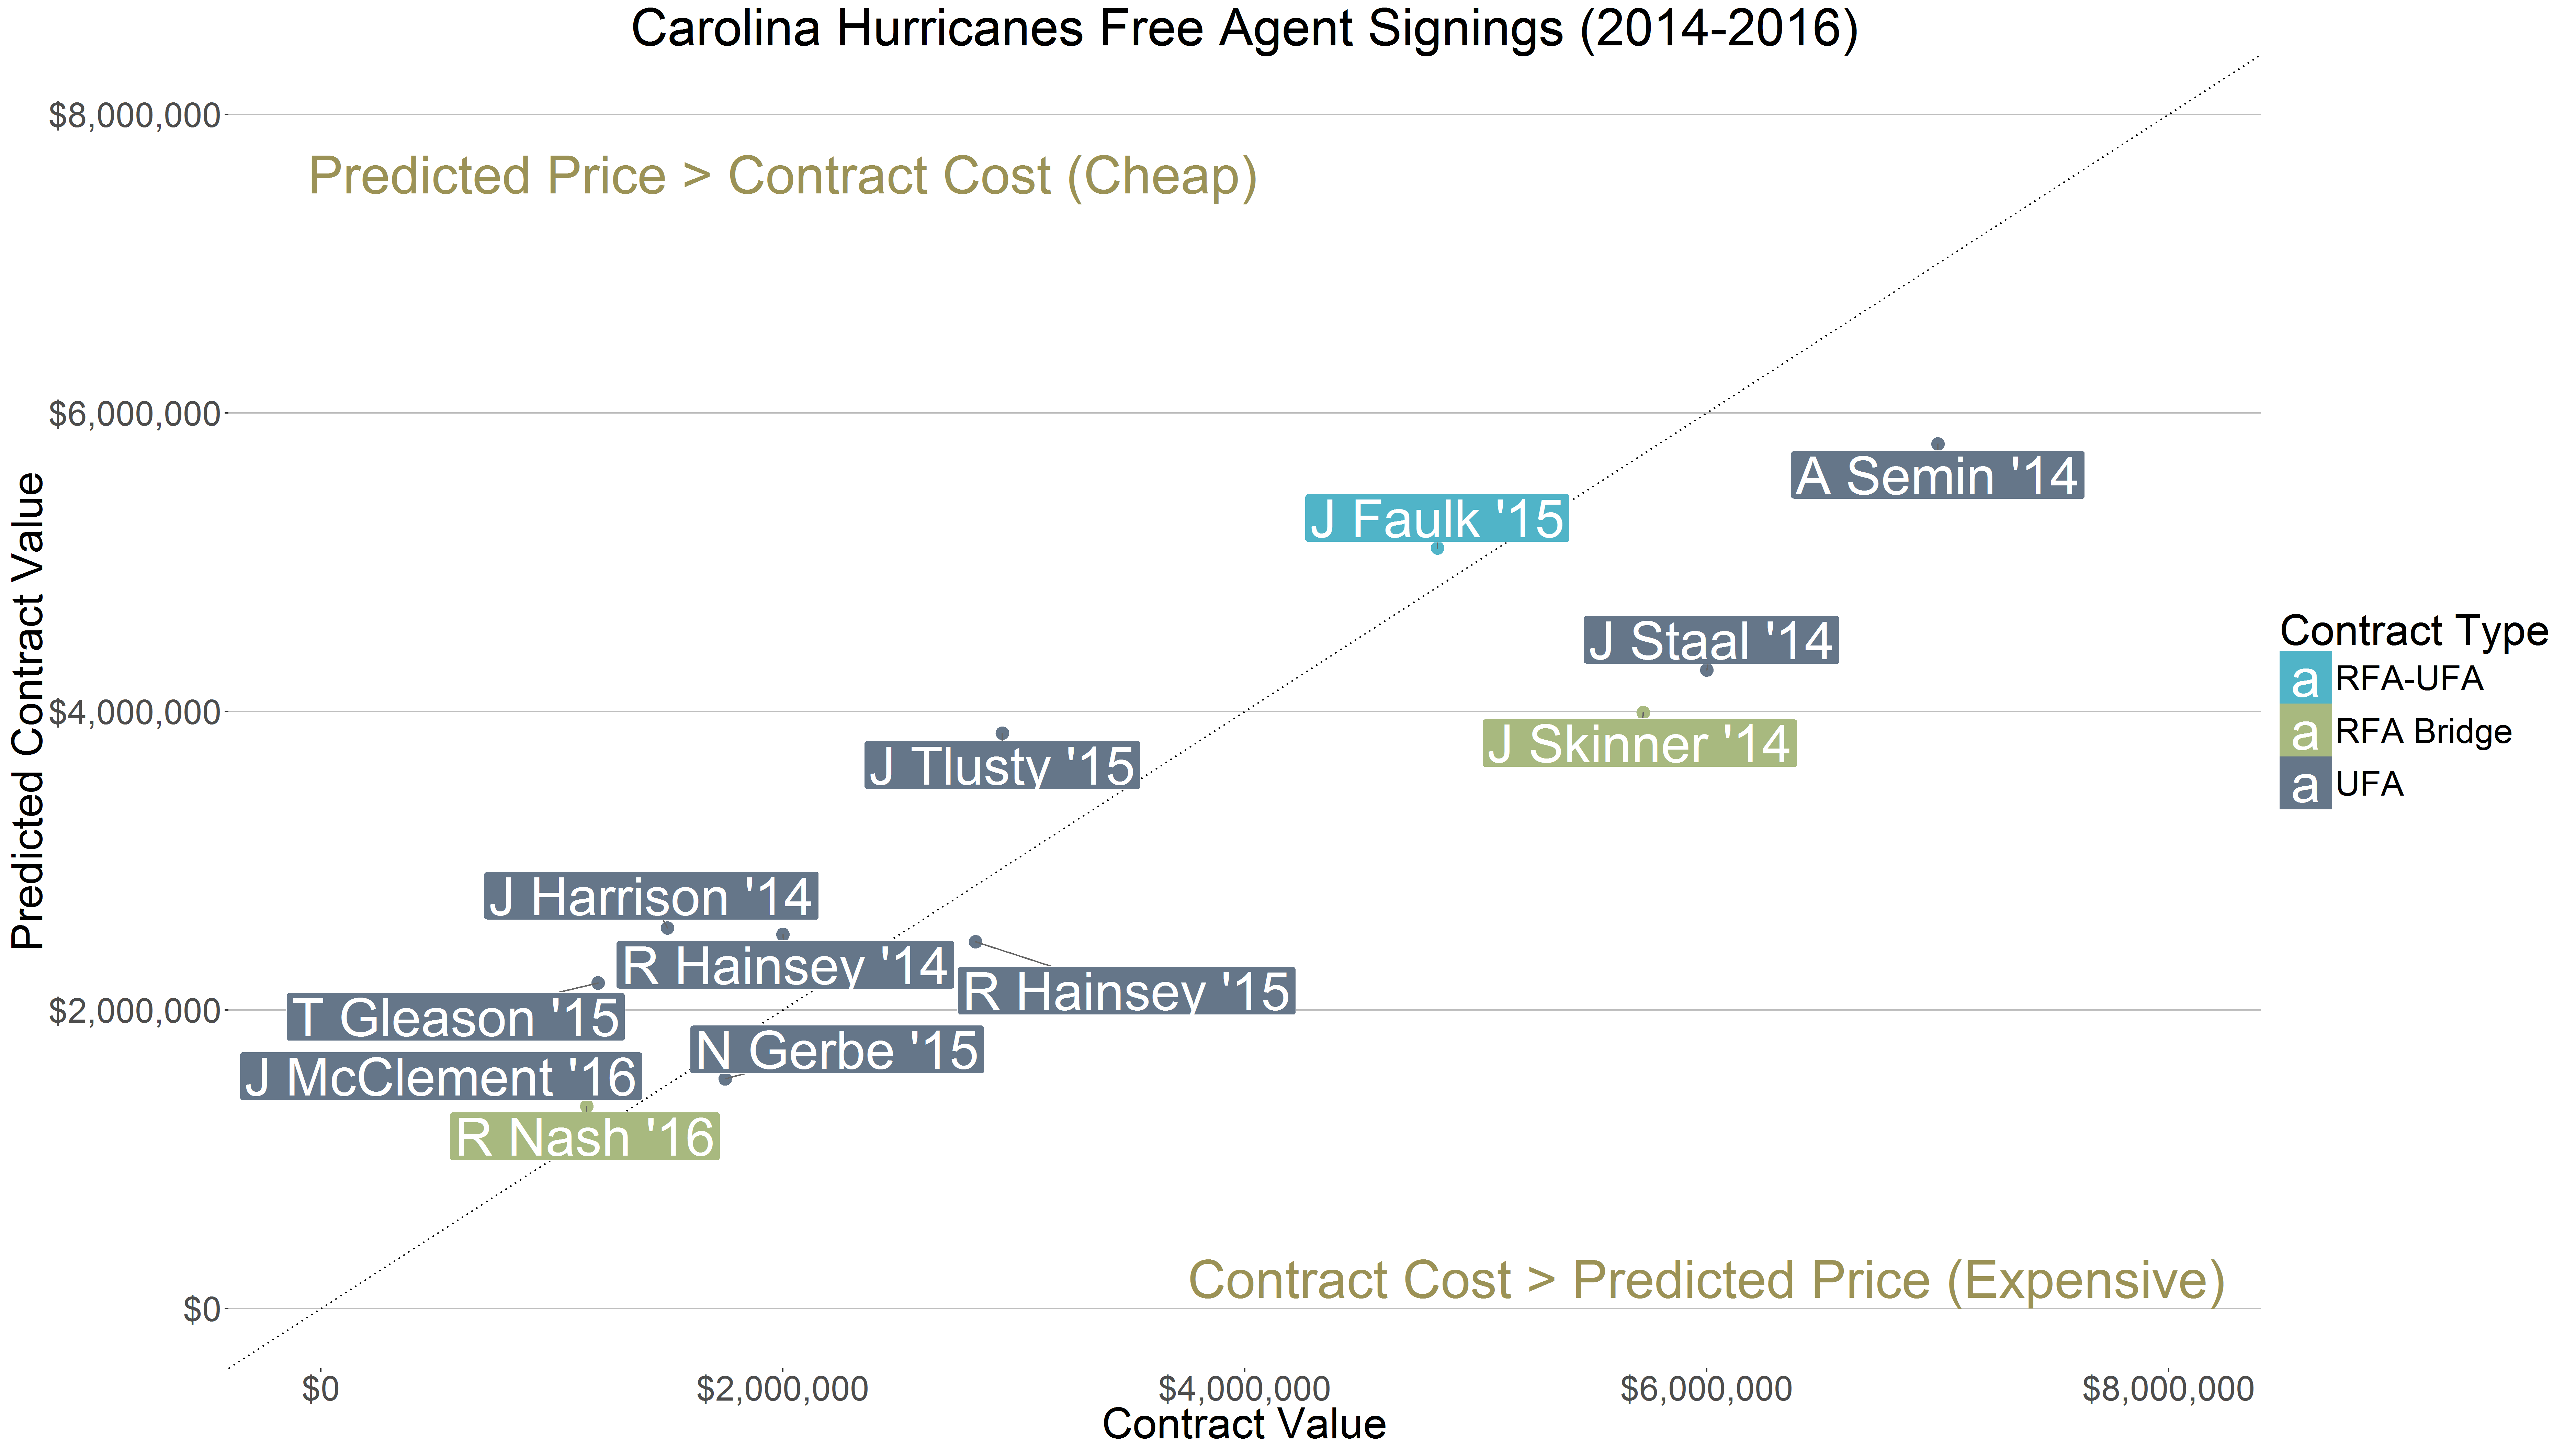
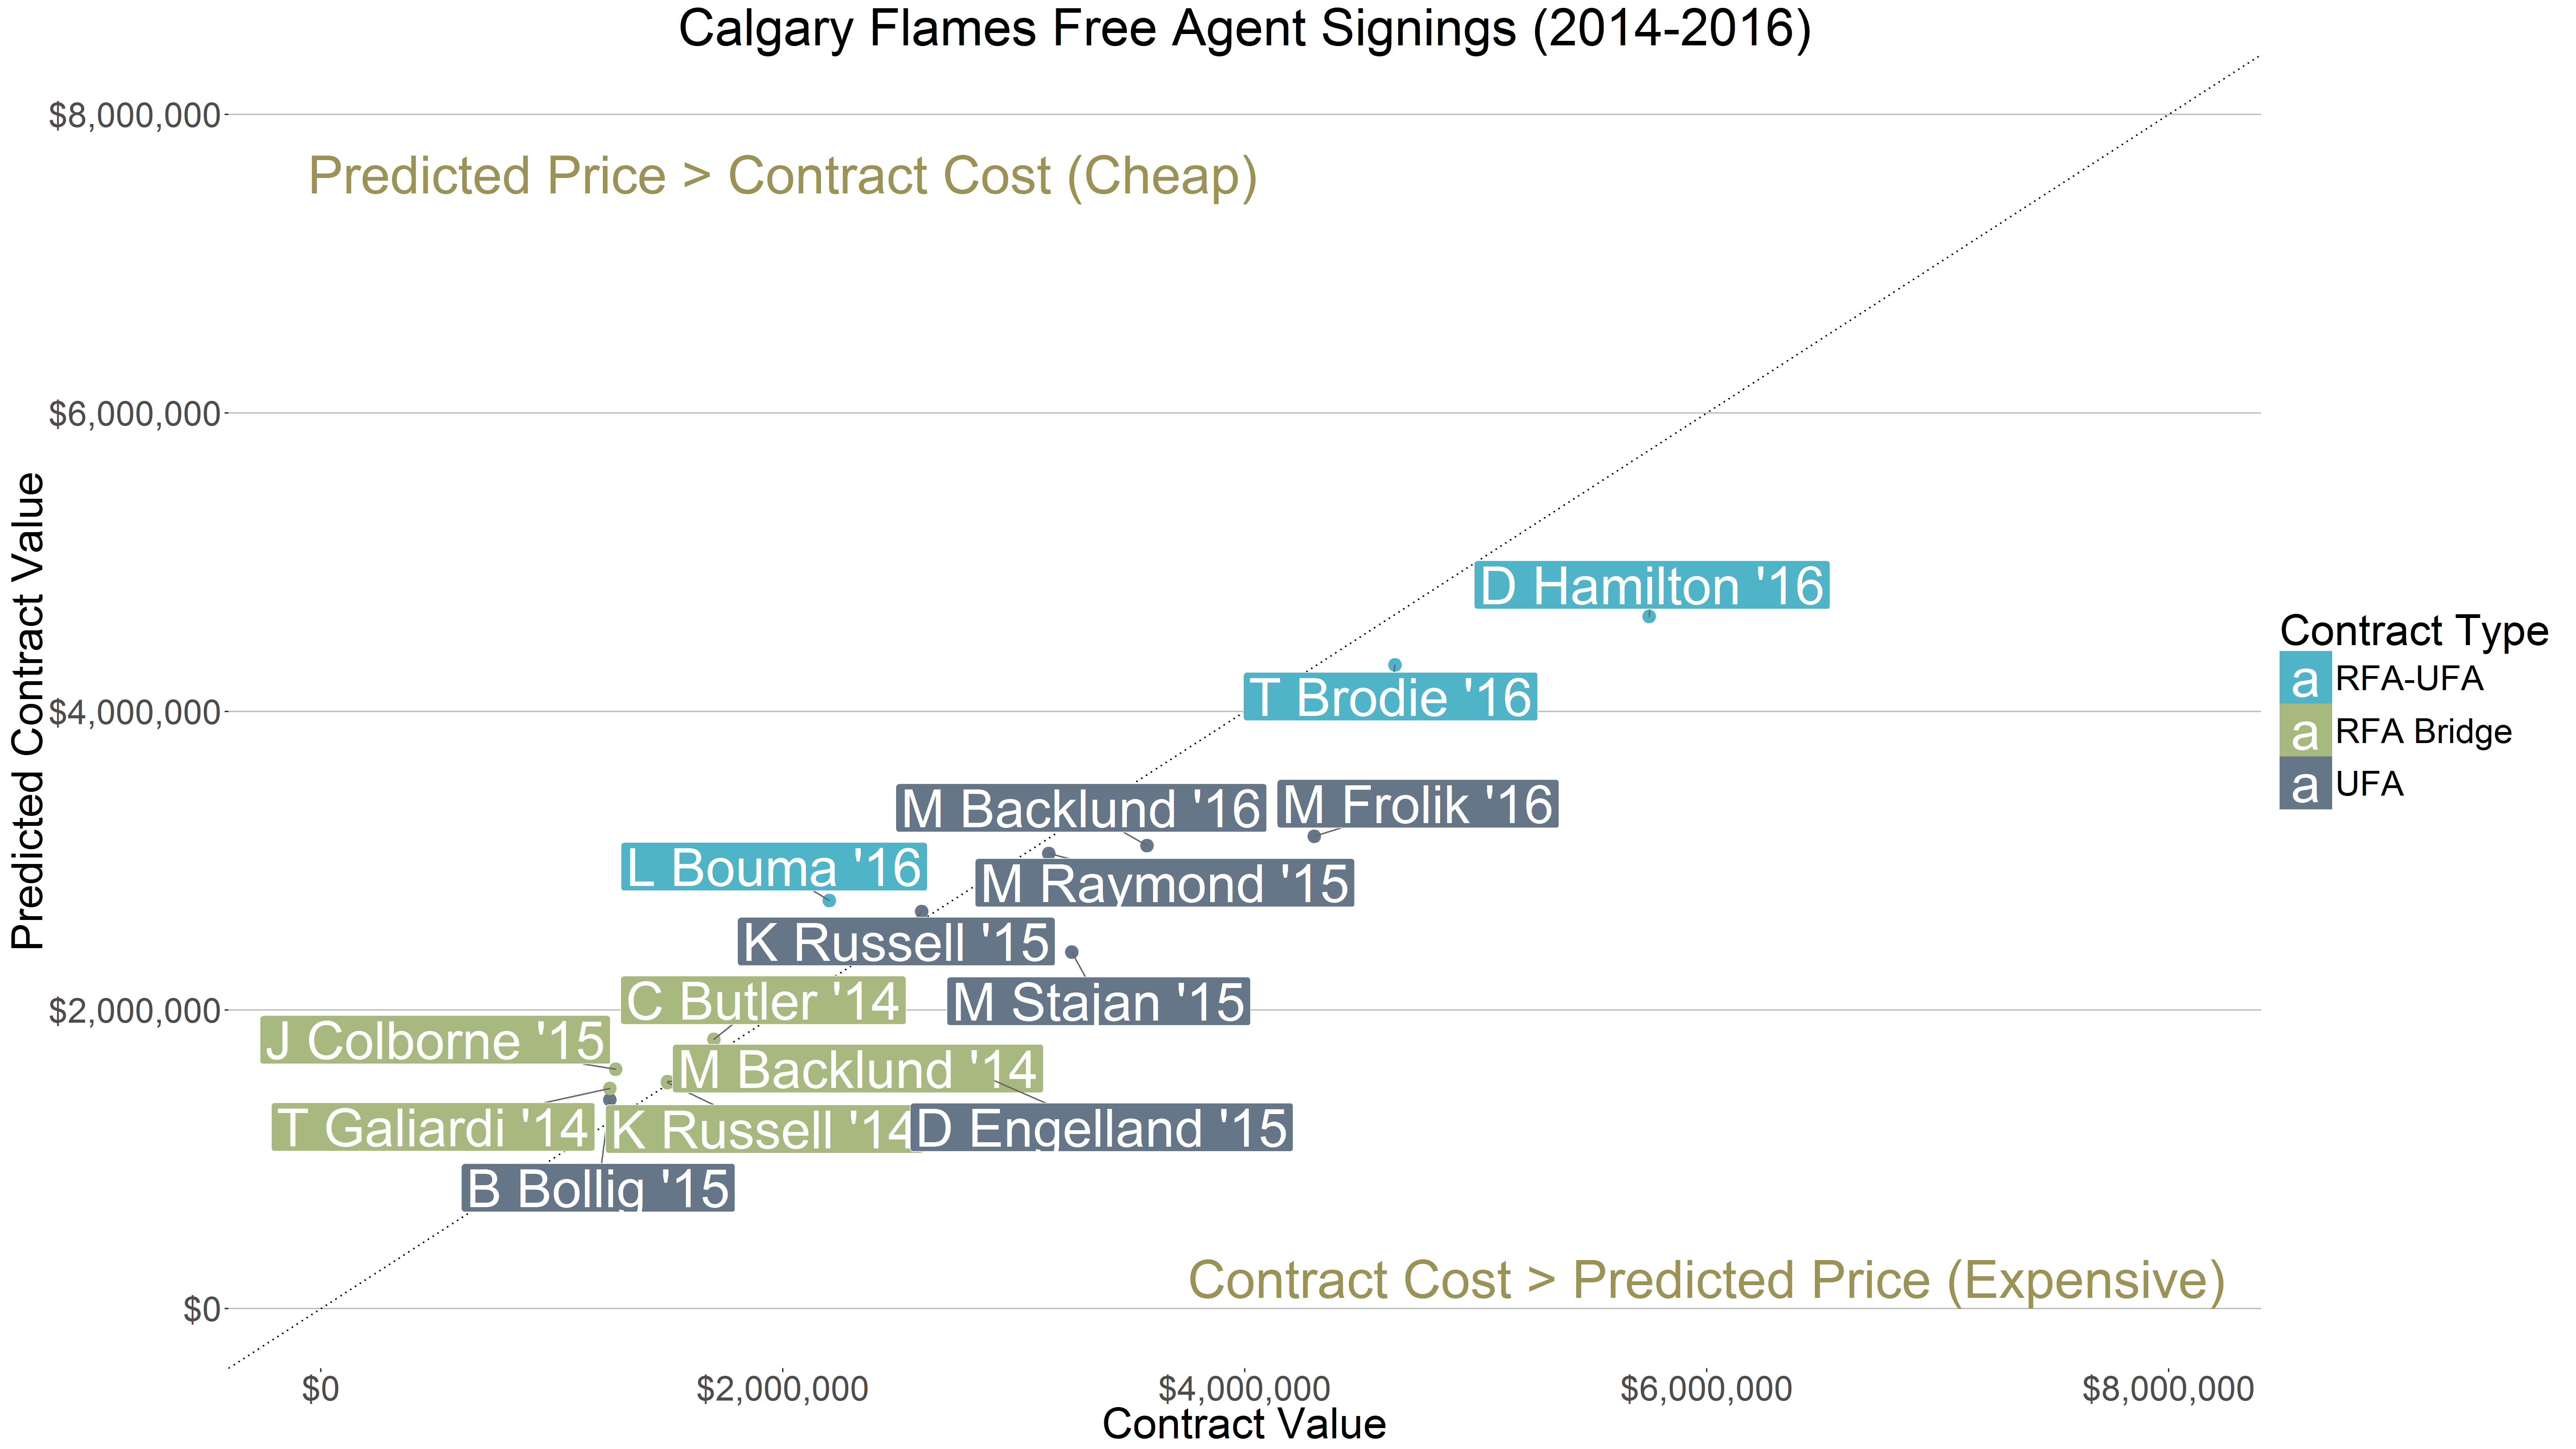
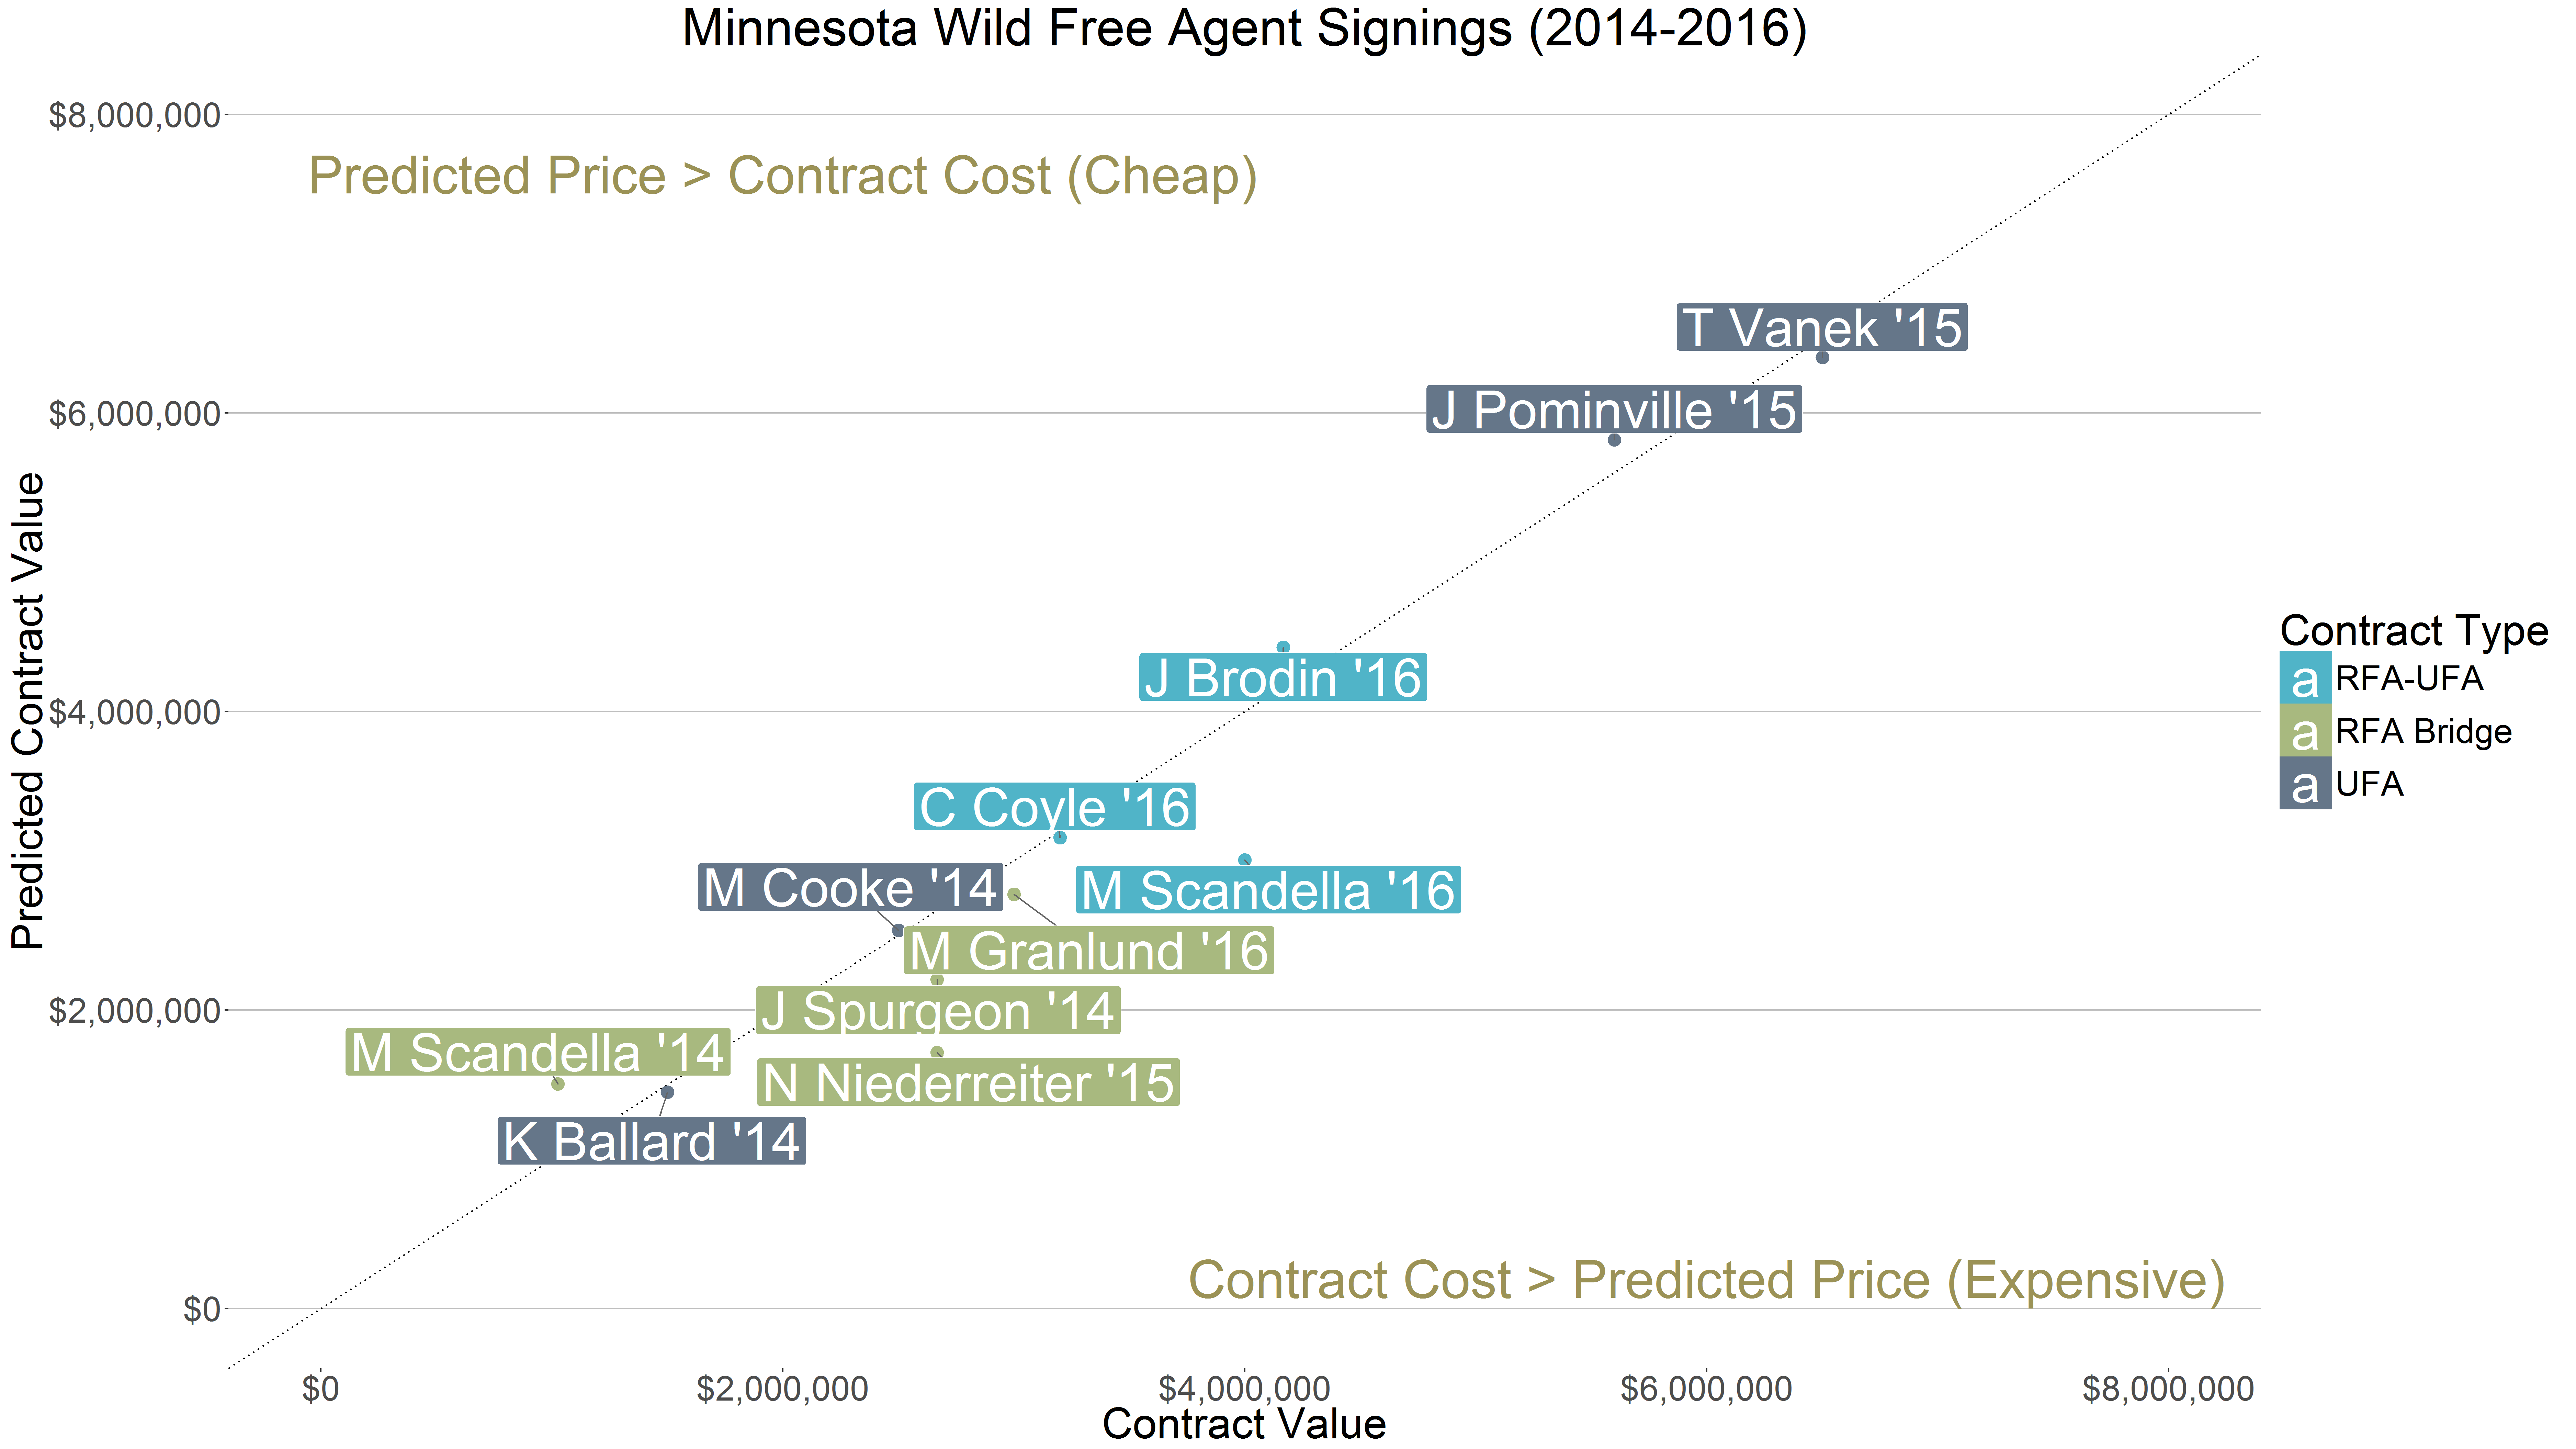
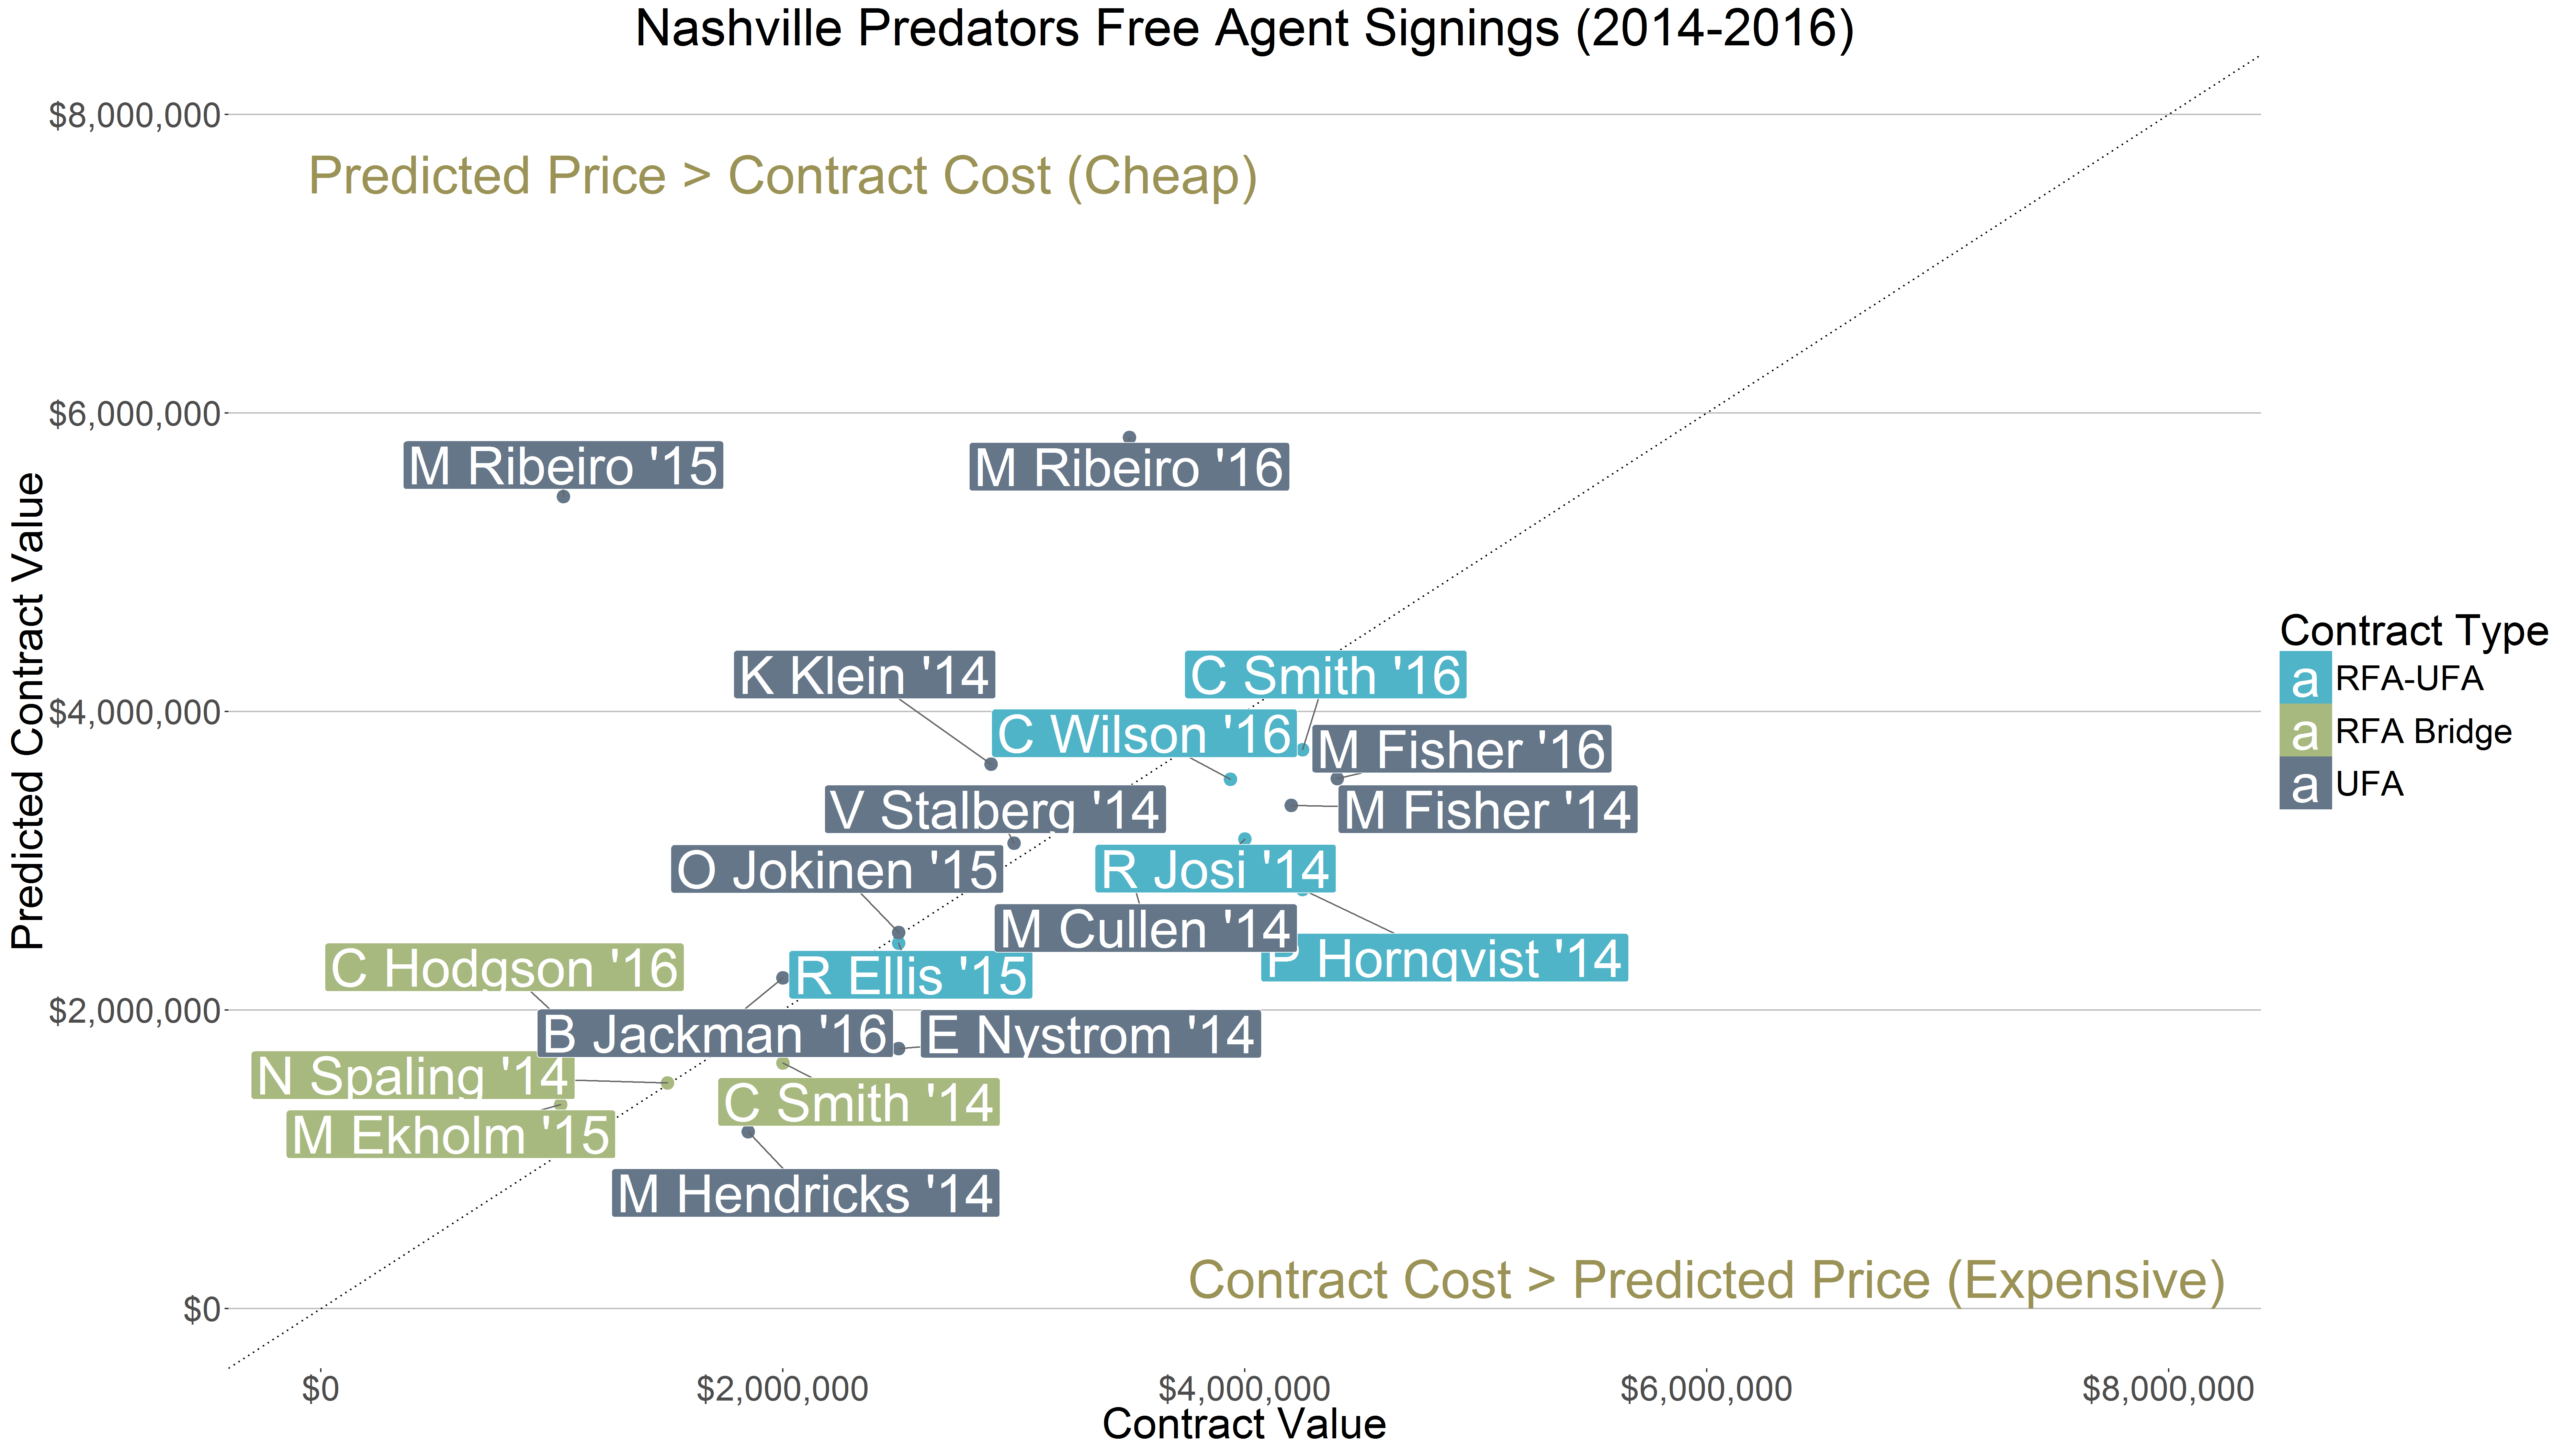
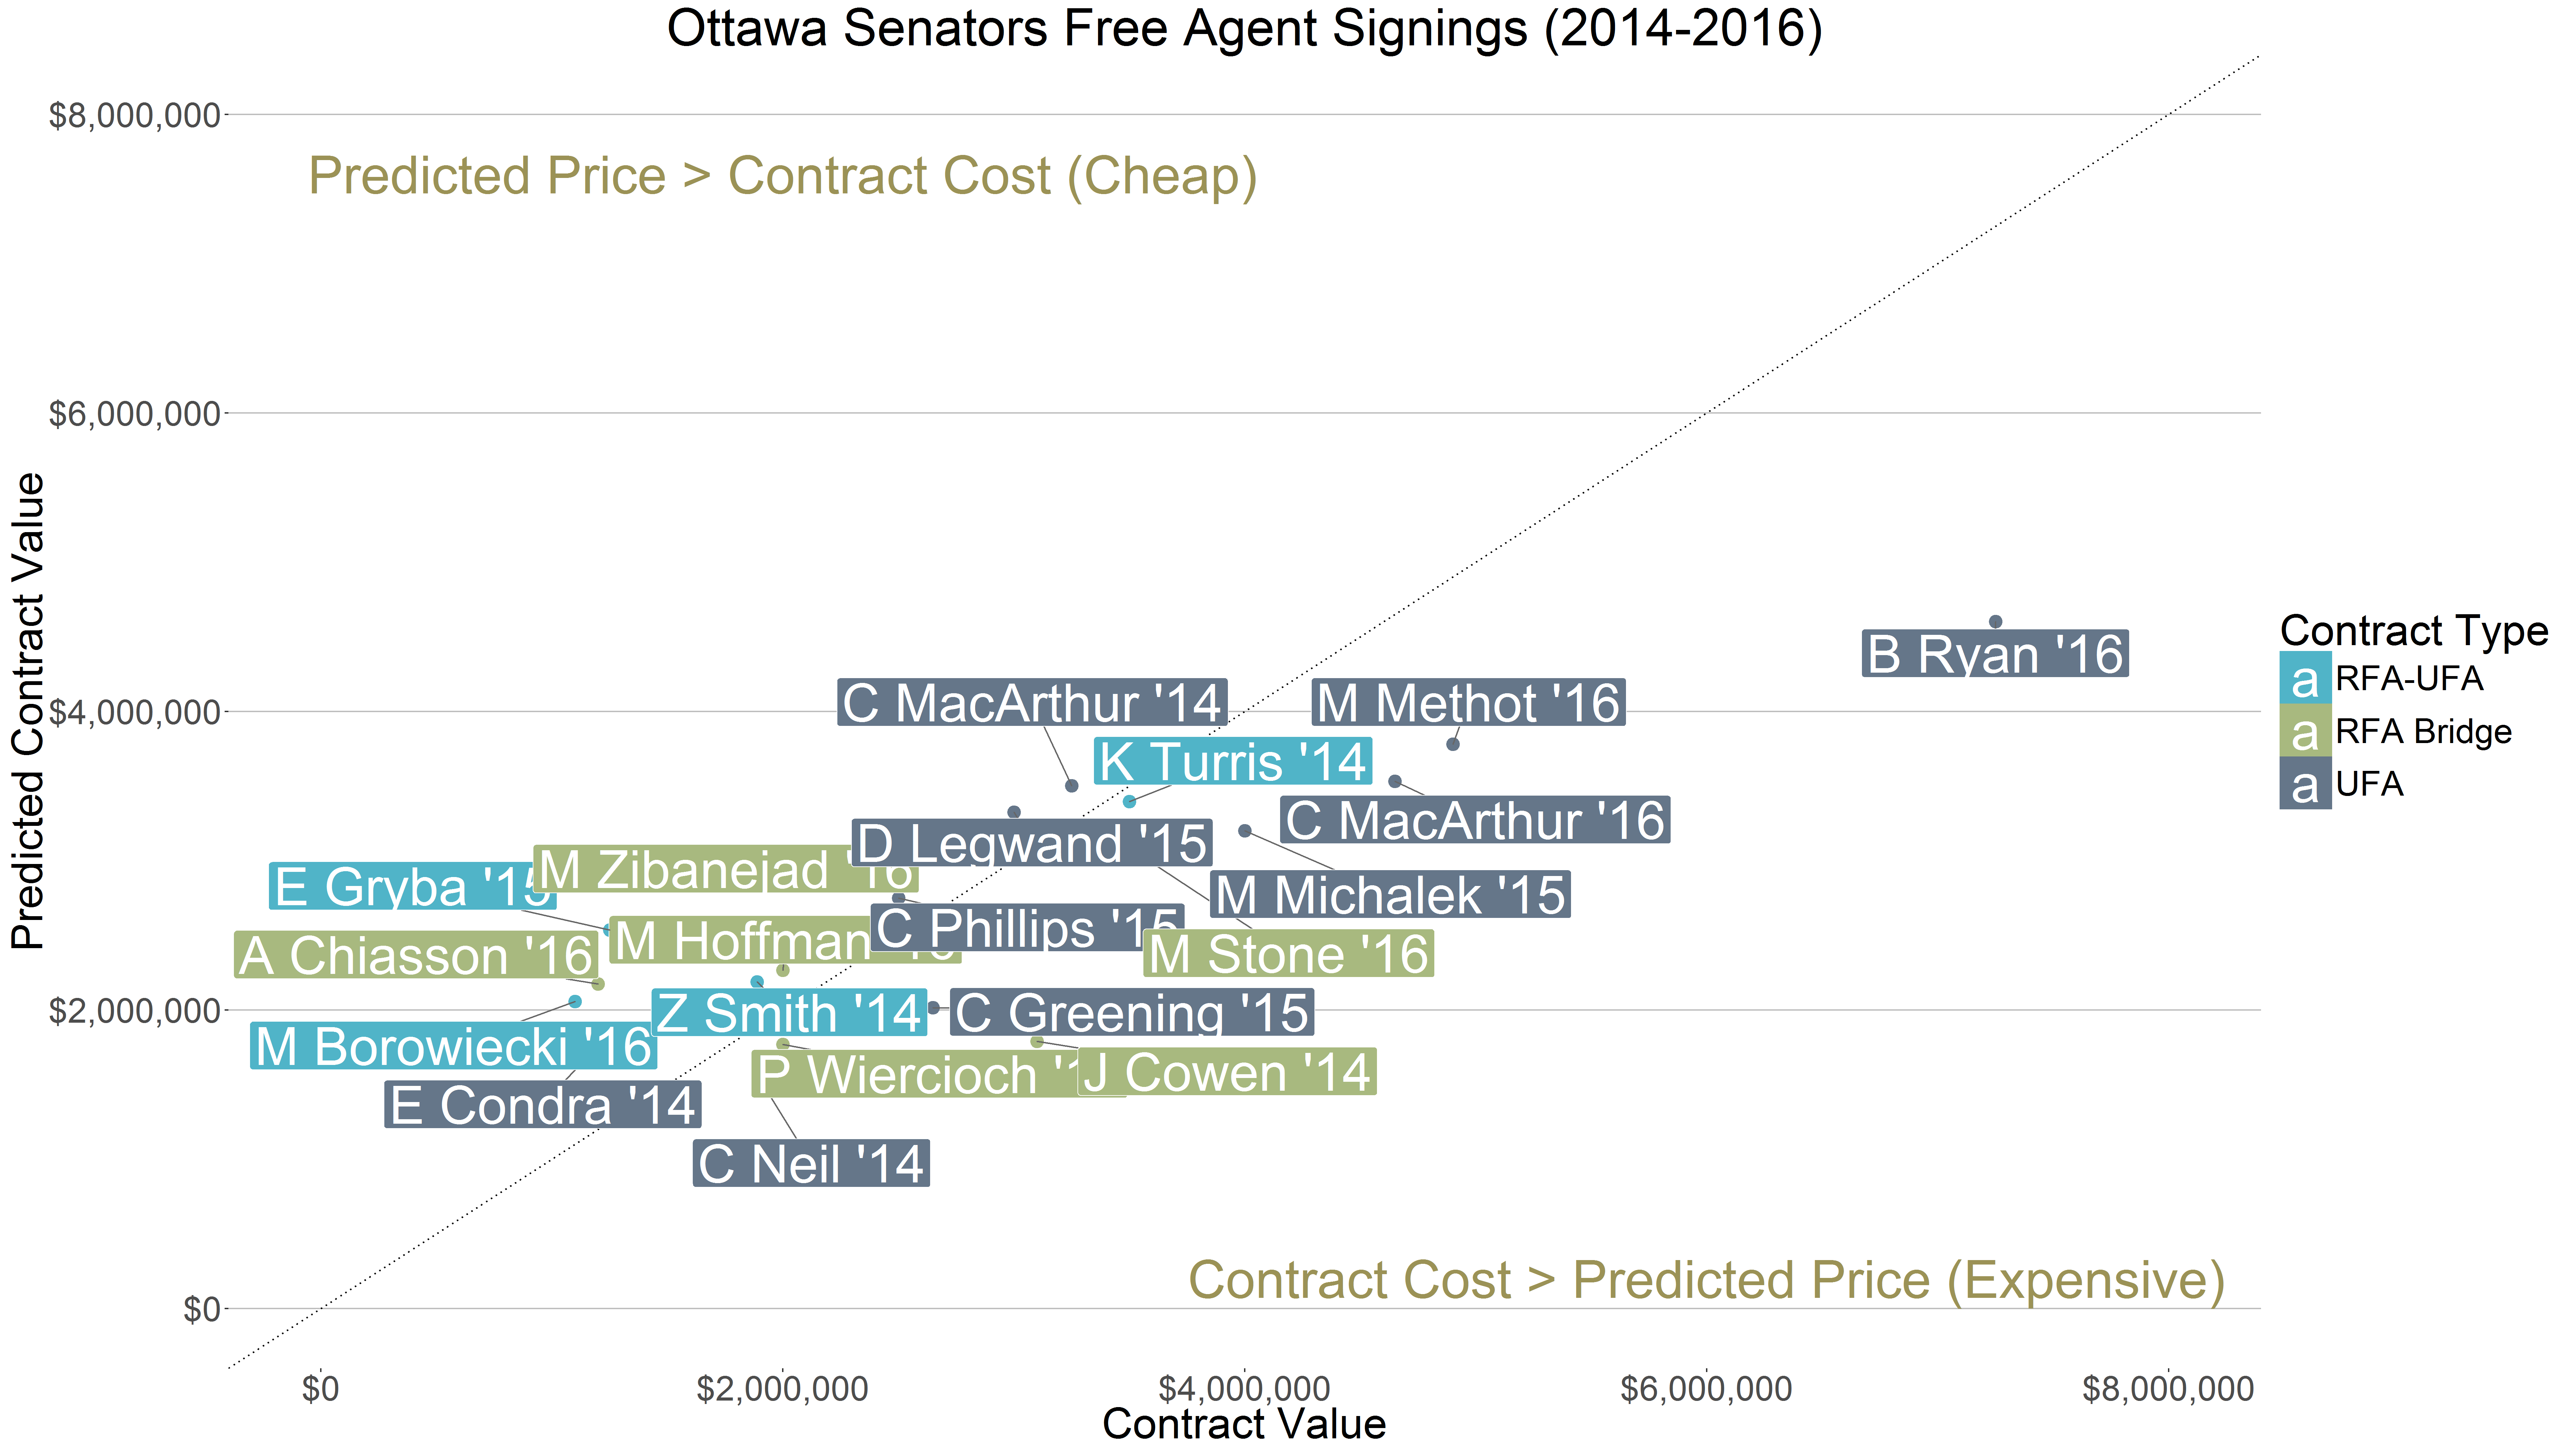
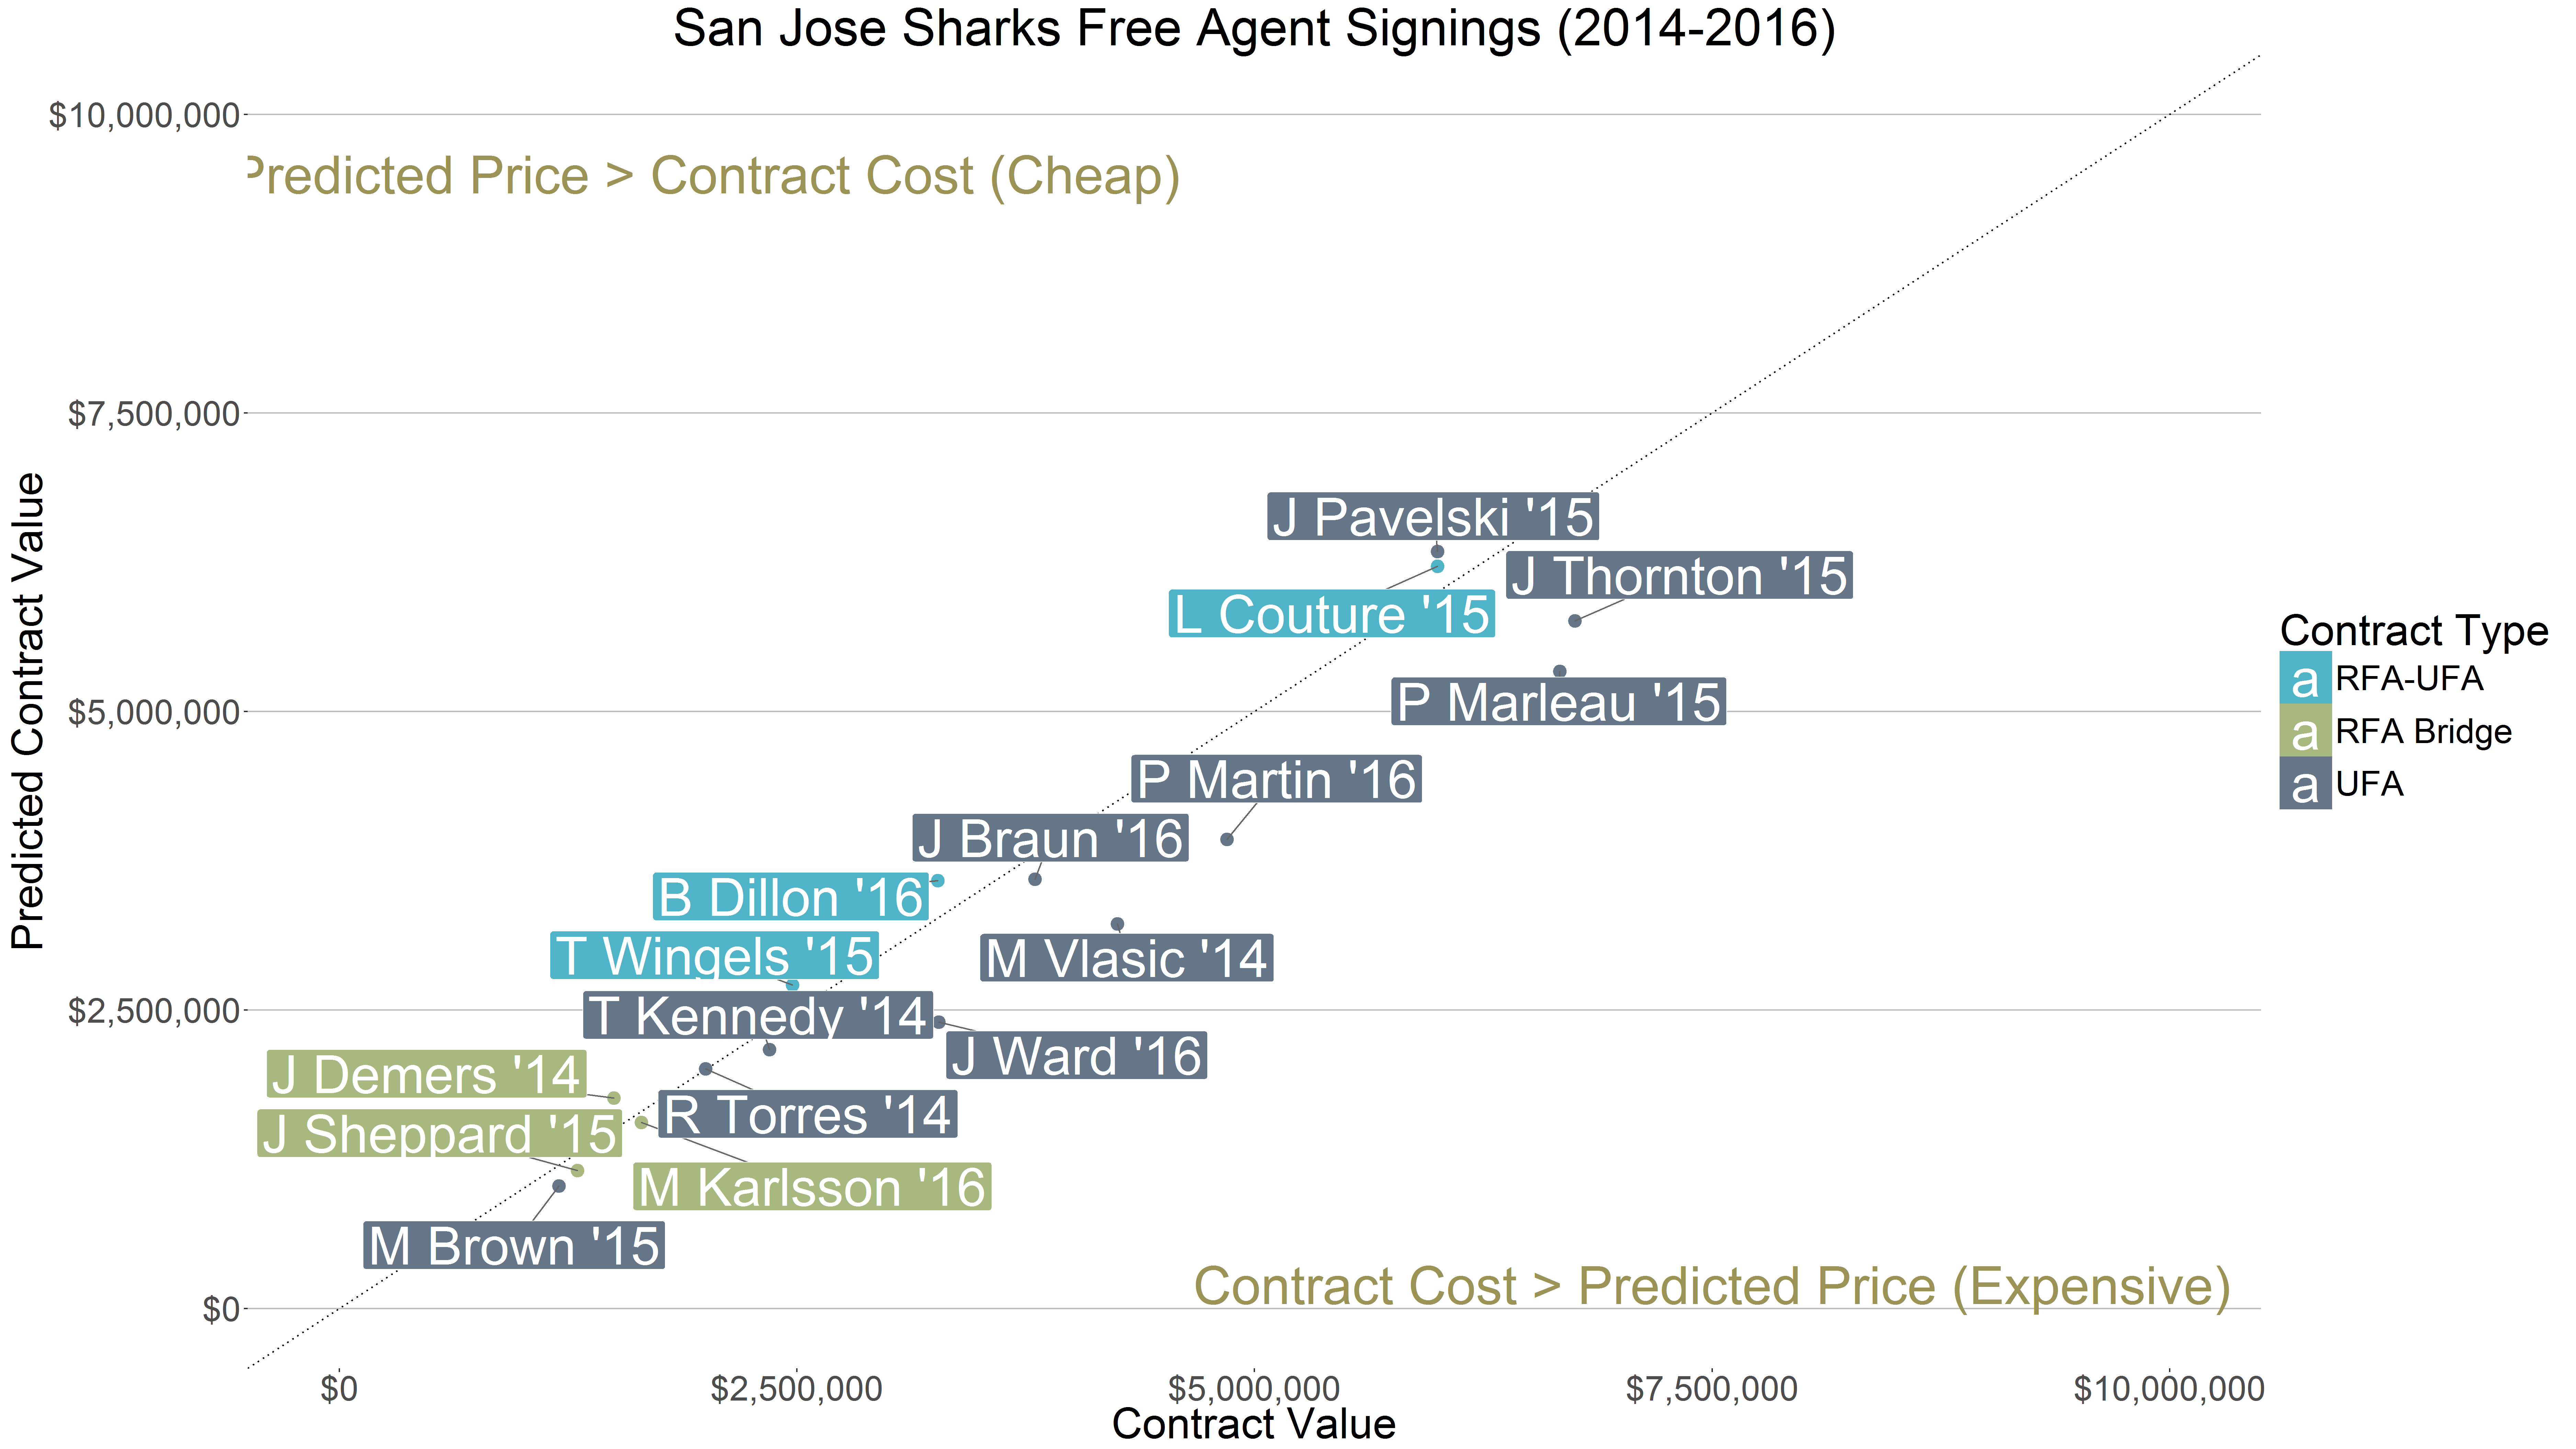
- Market Price vs. Contract Price – identifies whether players were signed for more or less than the market price model would predict.
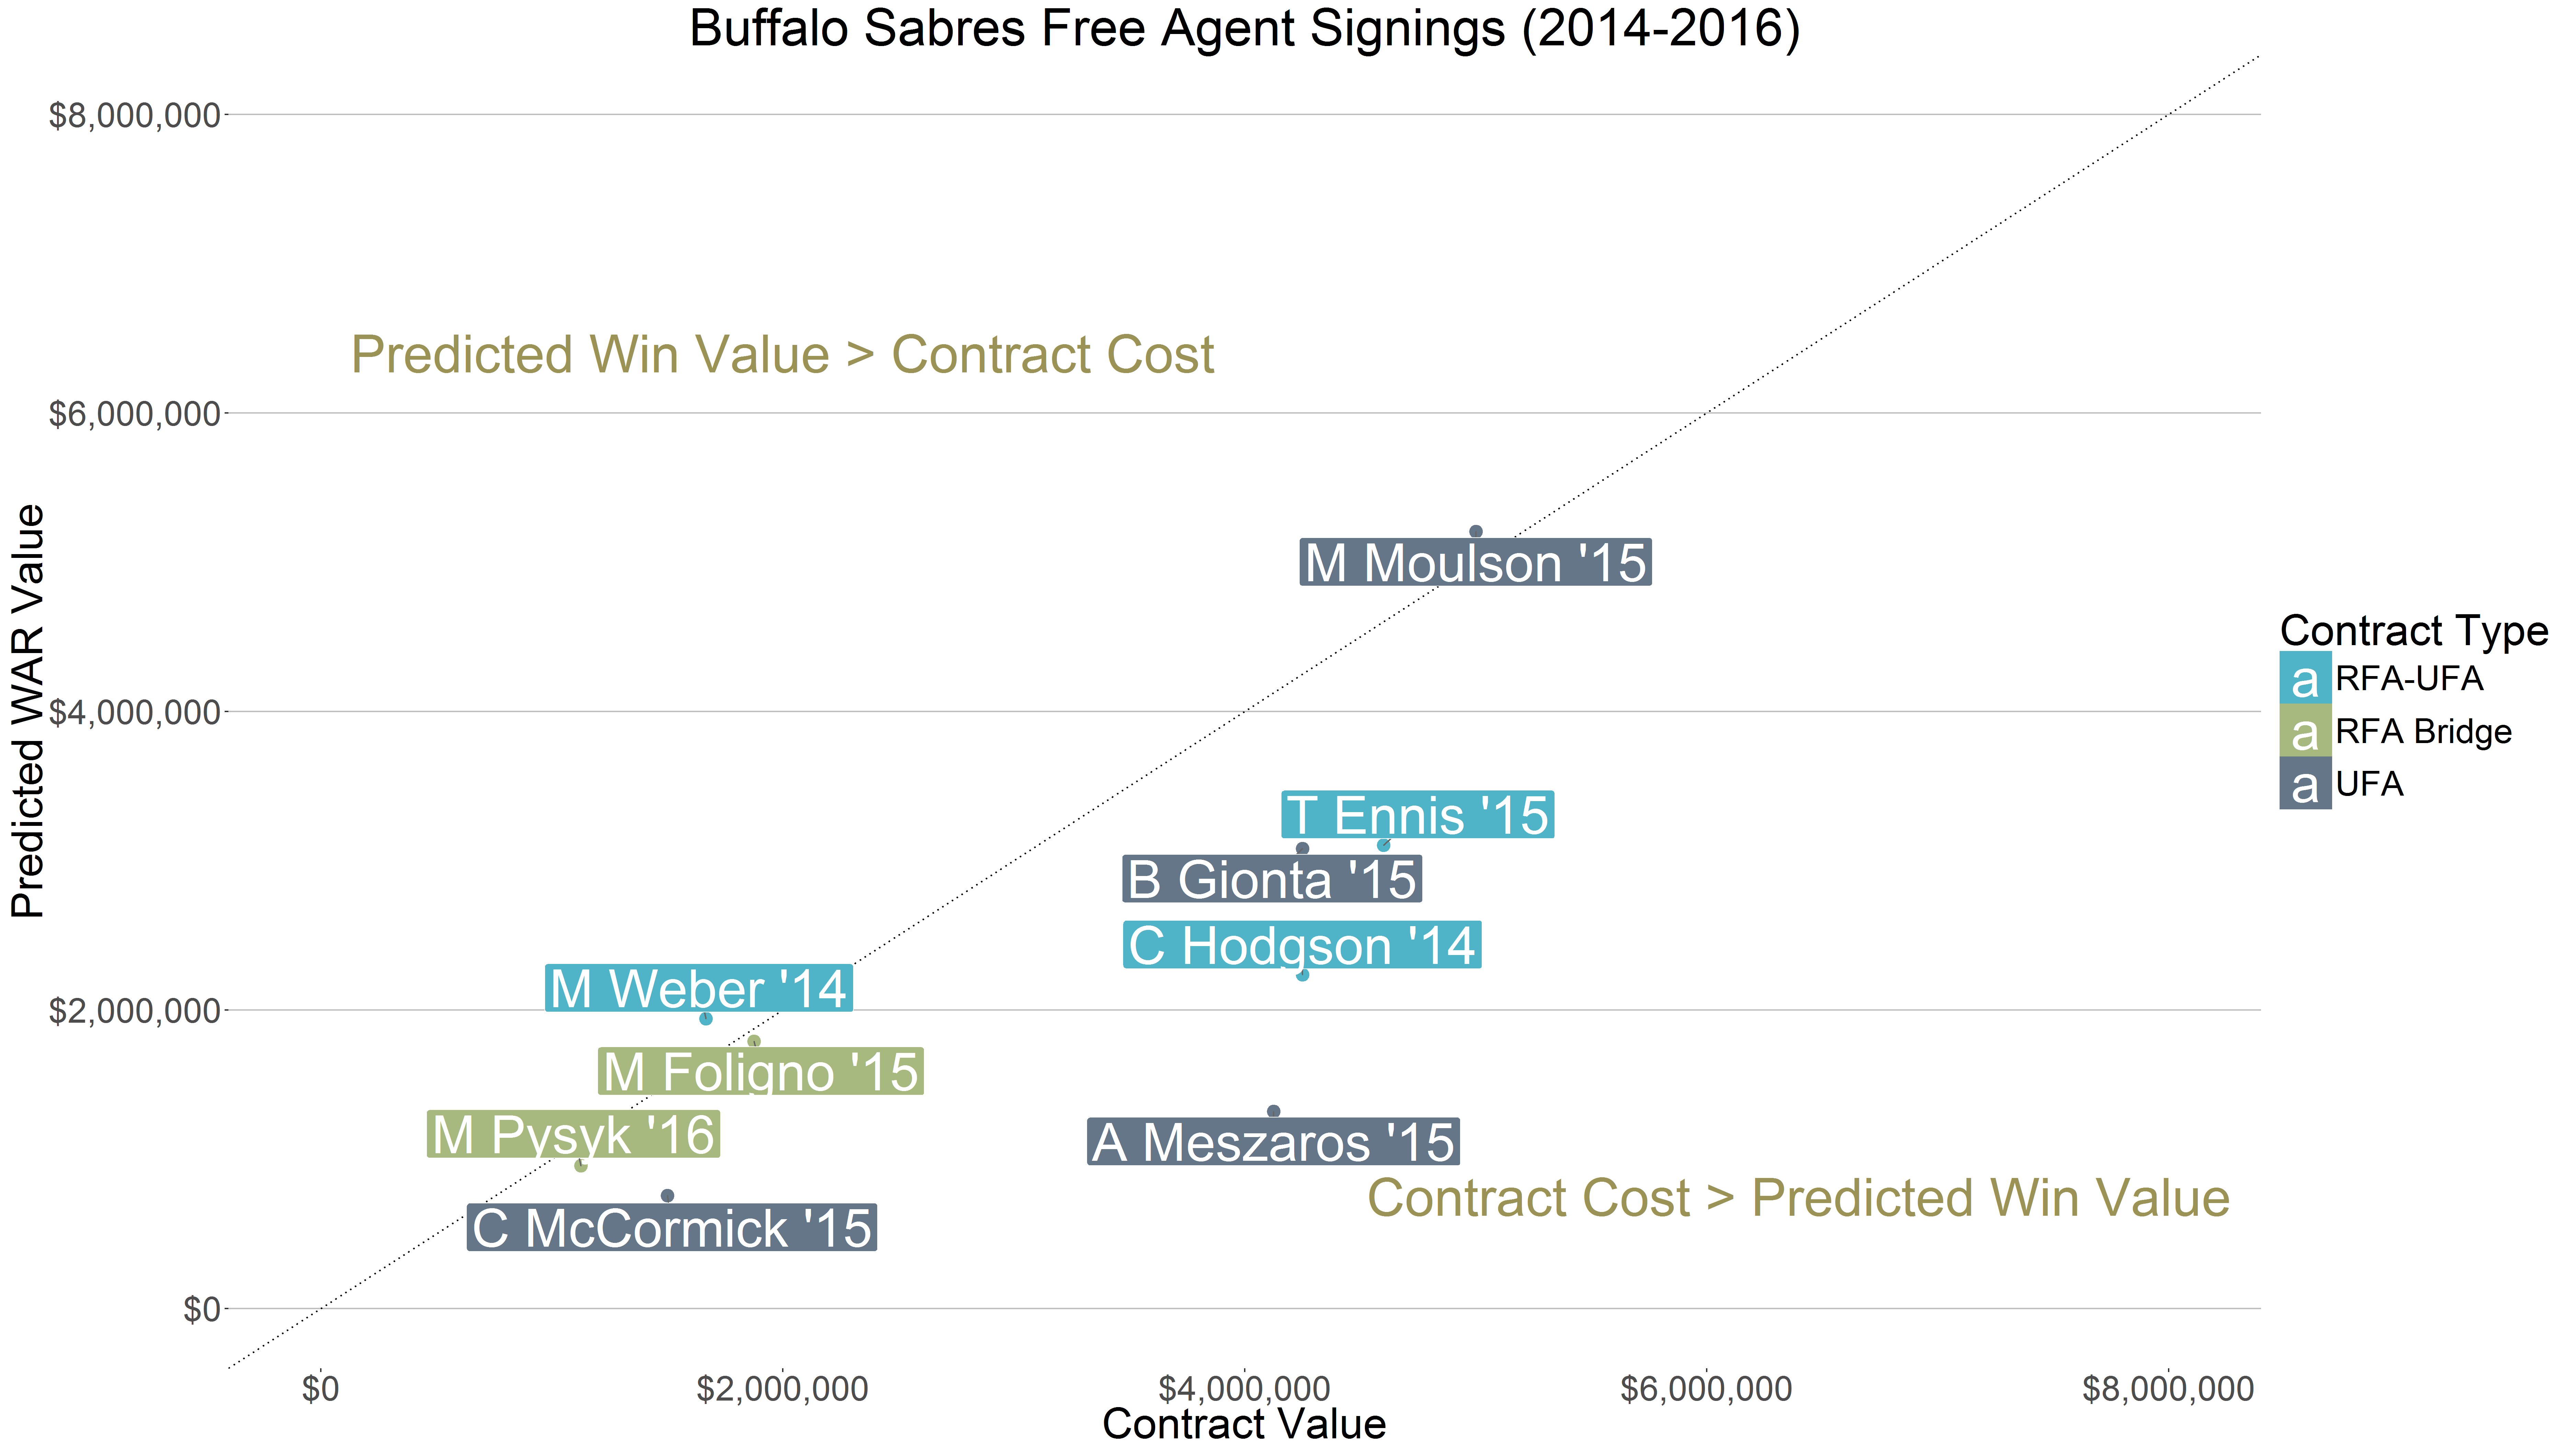
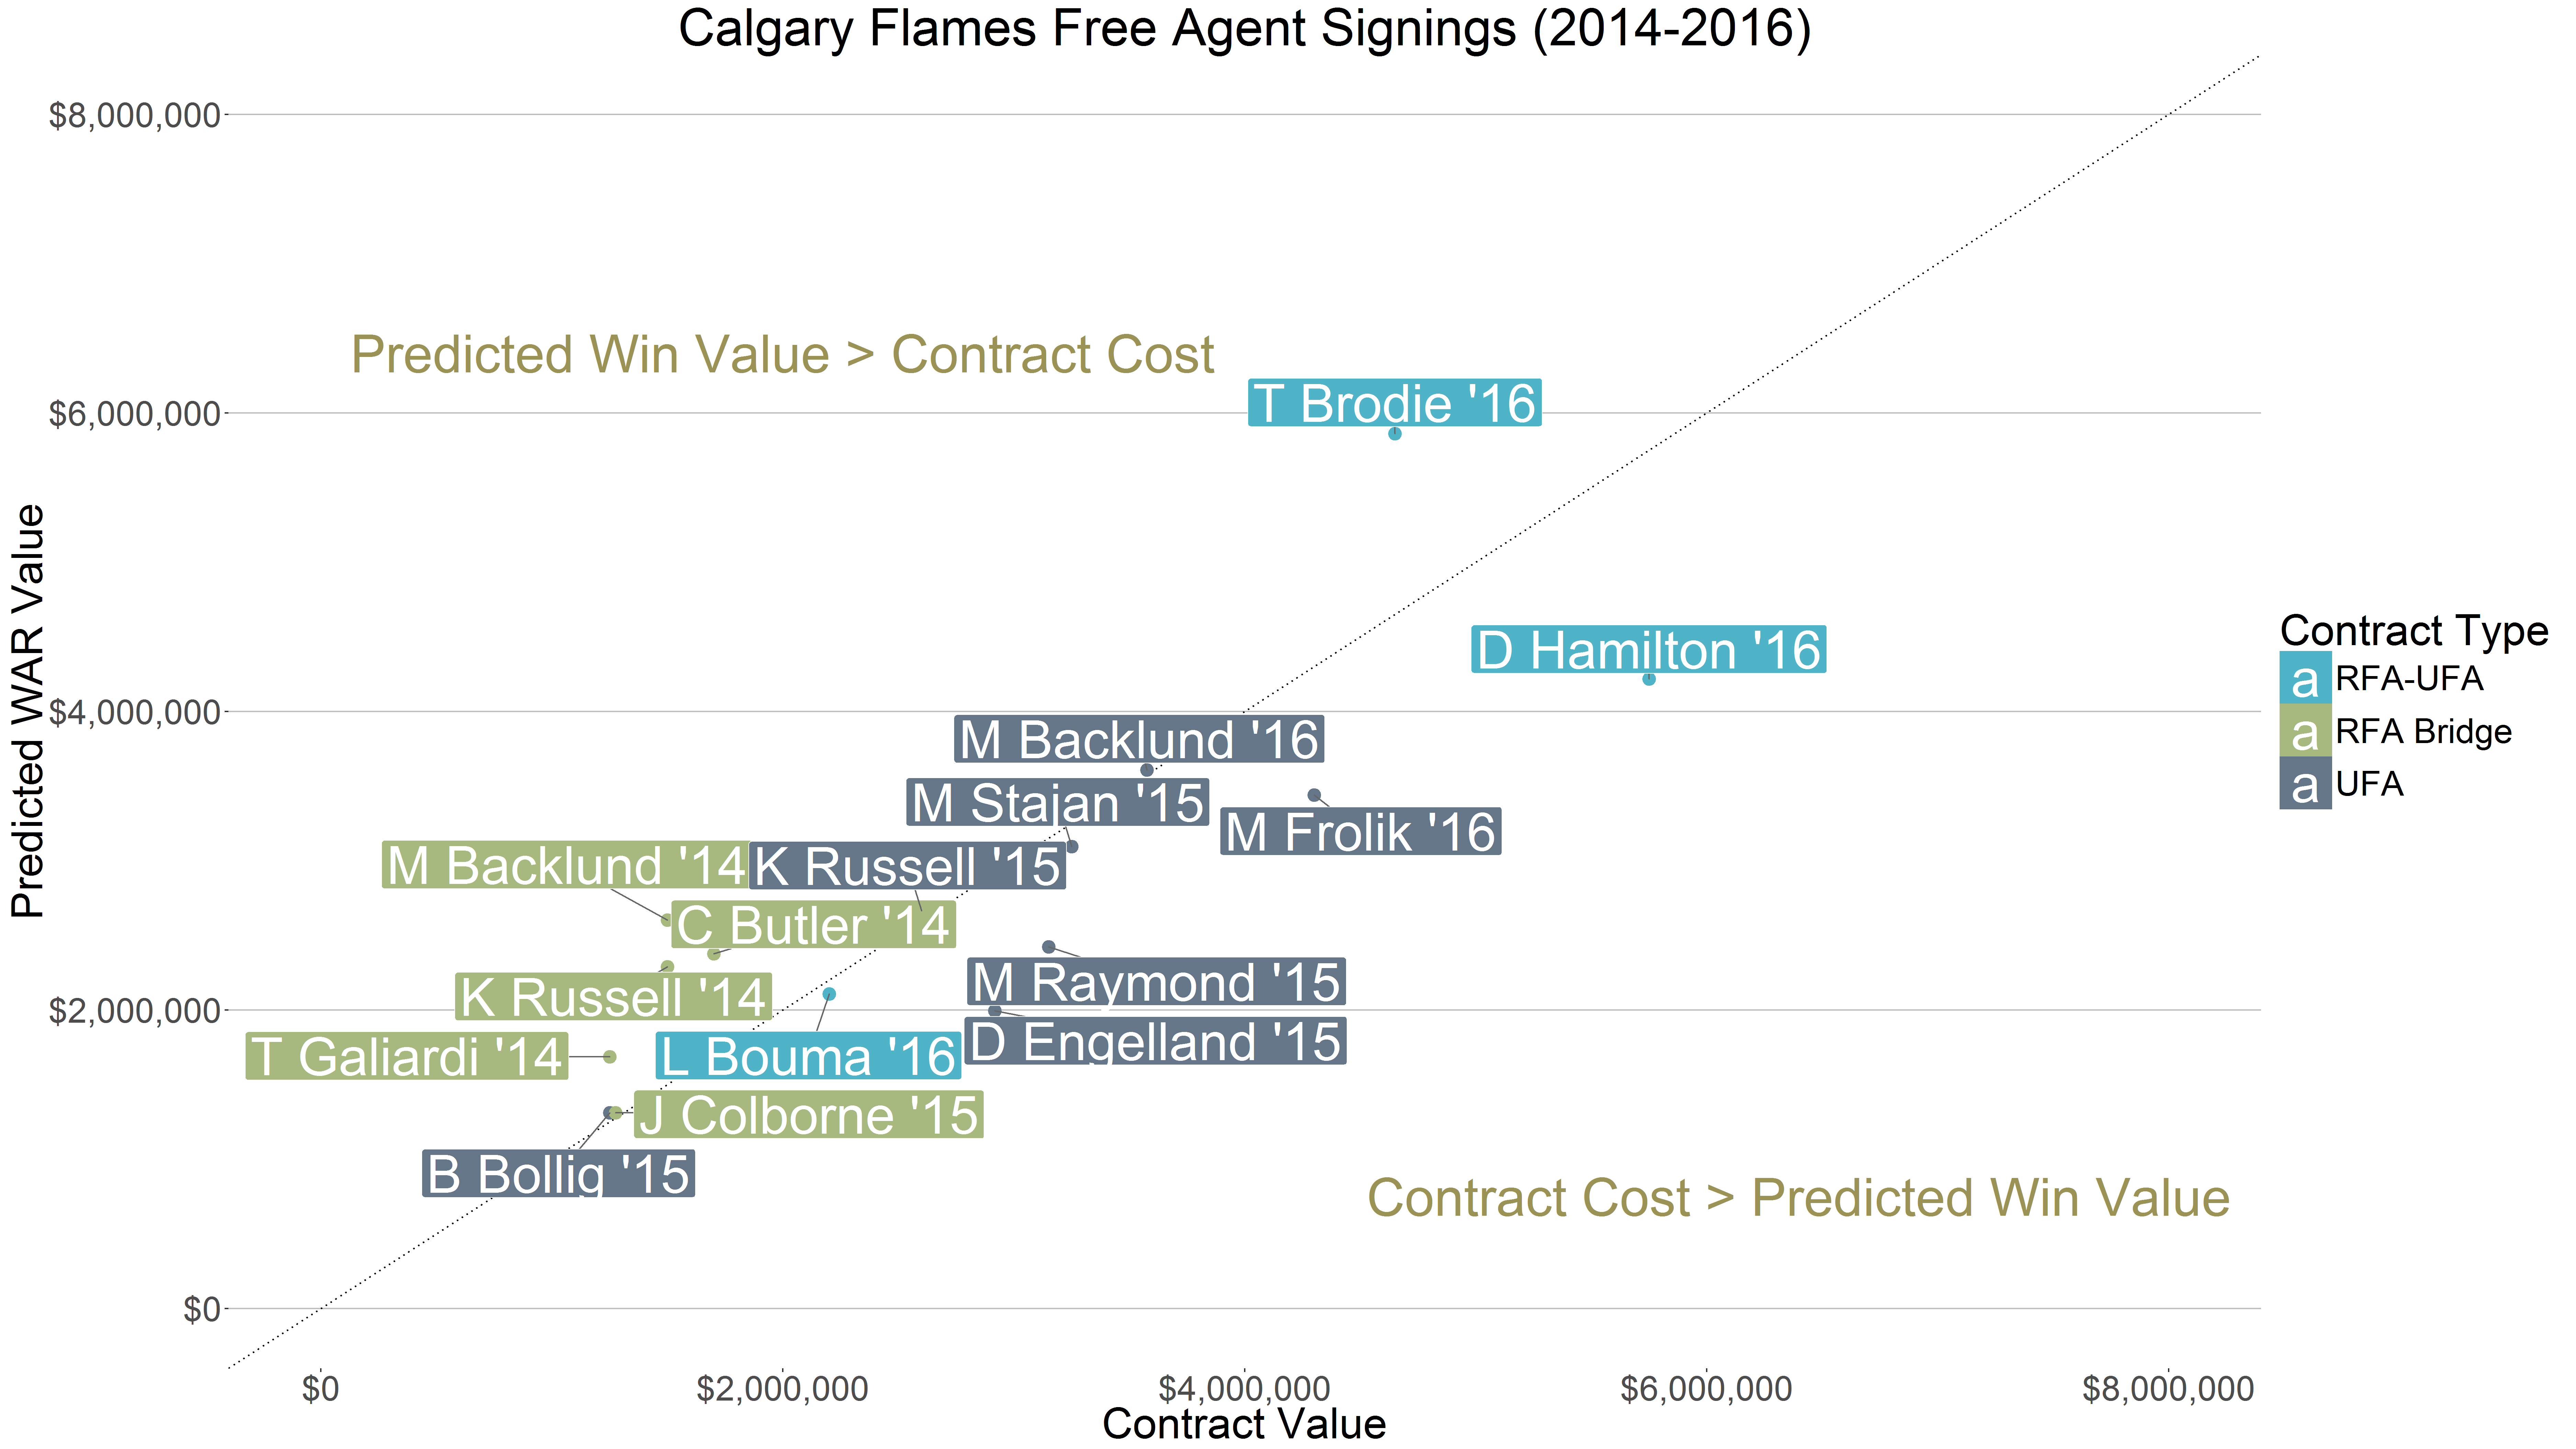
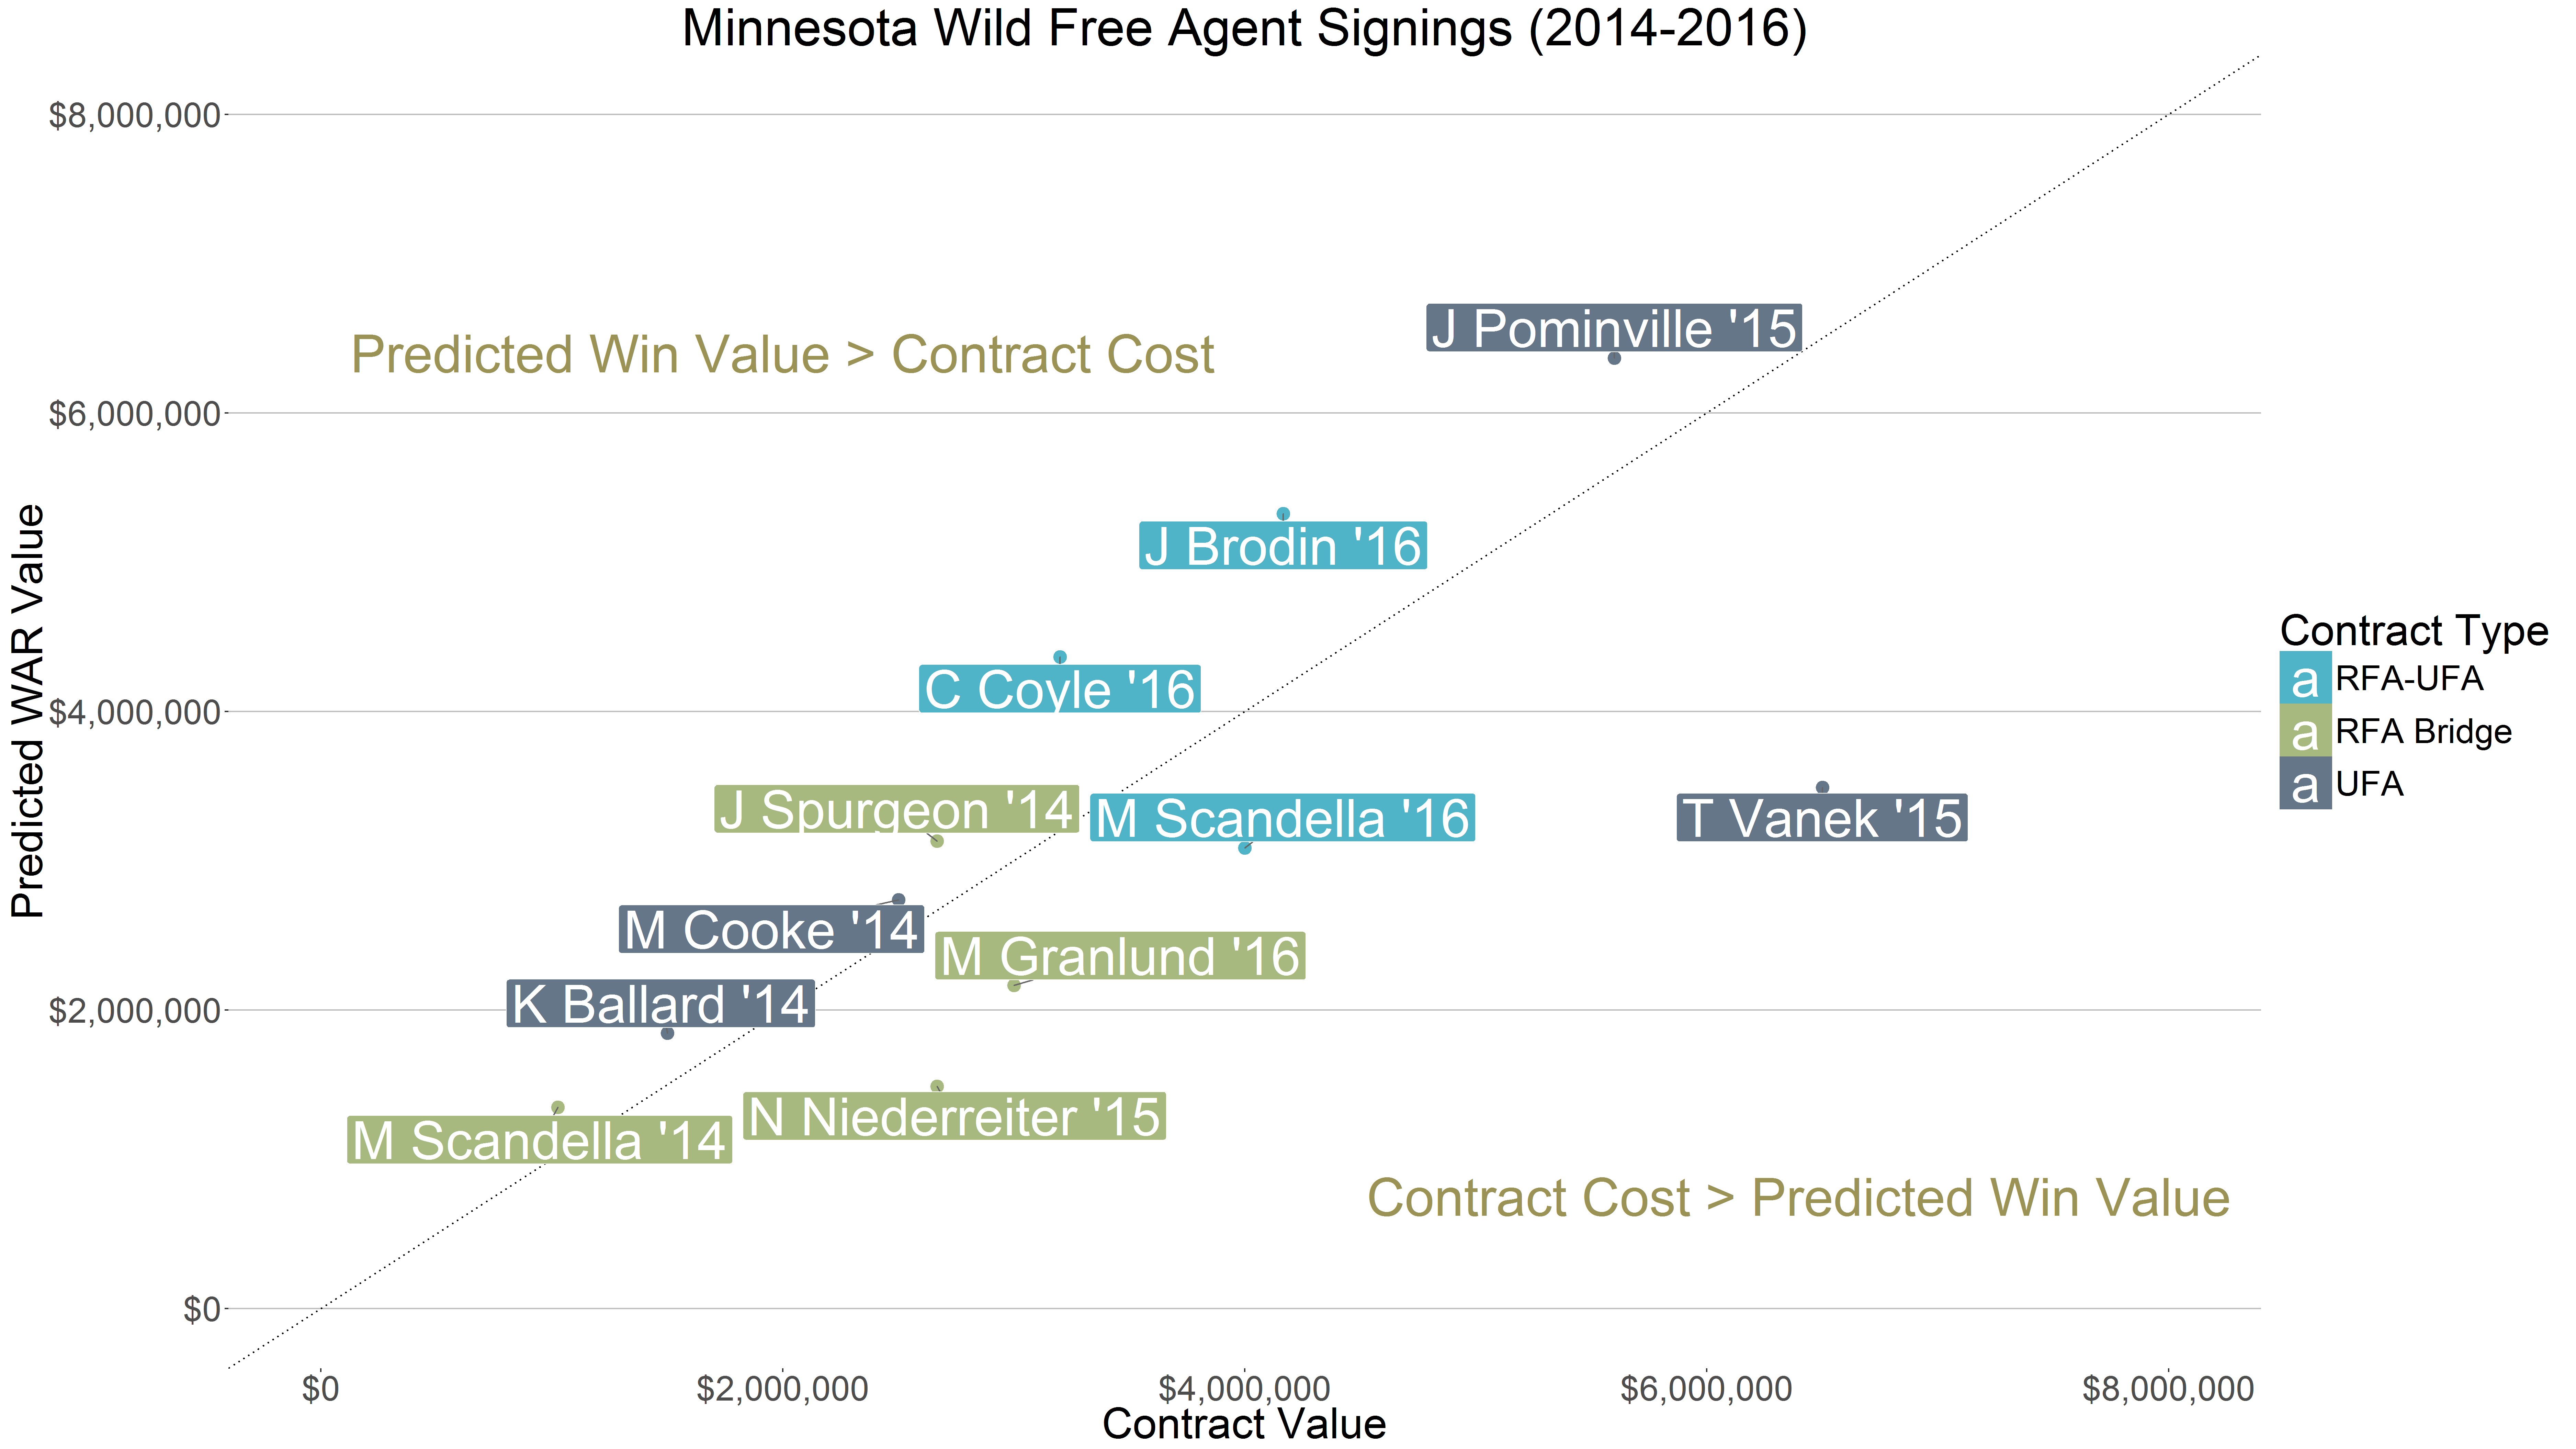
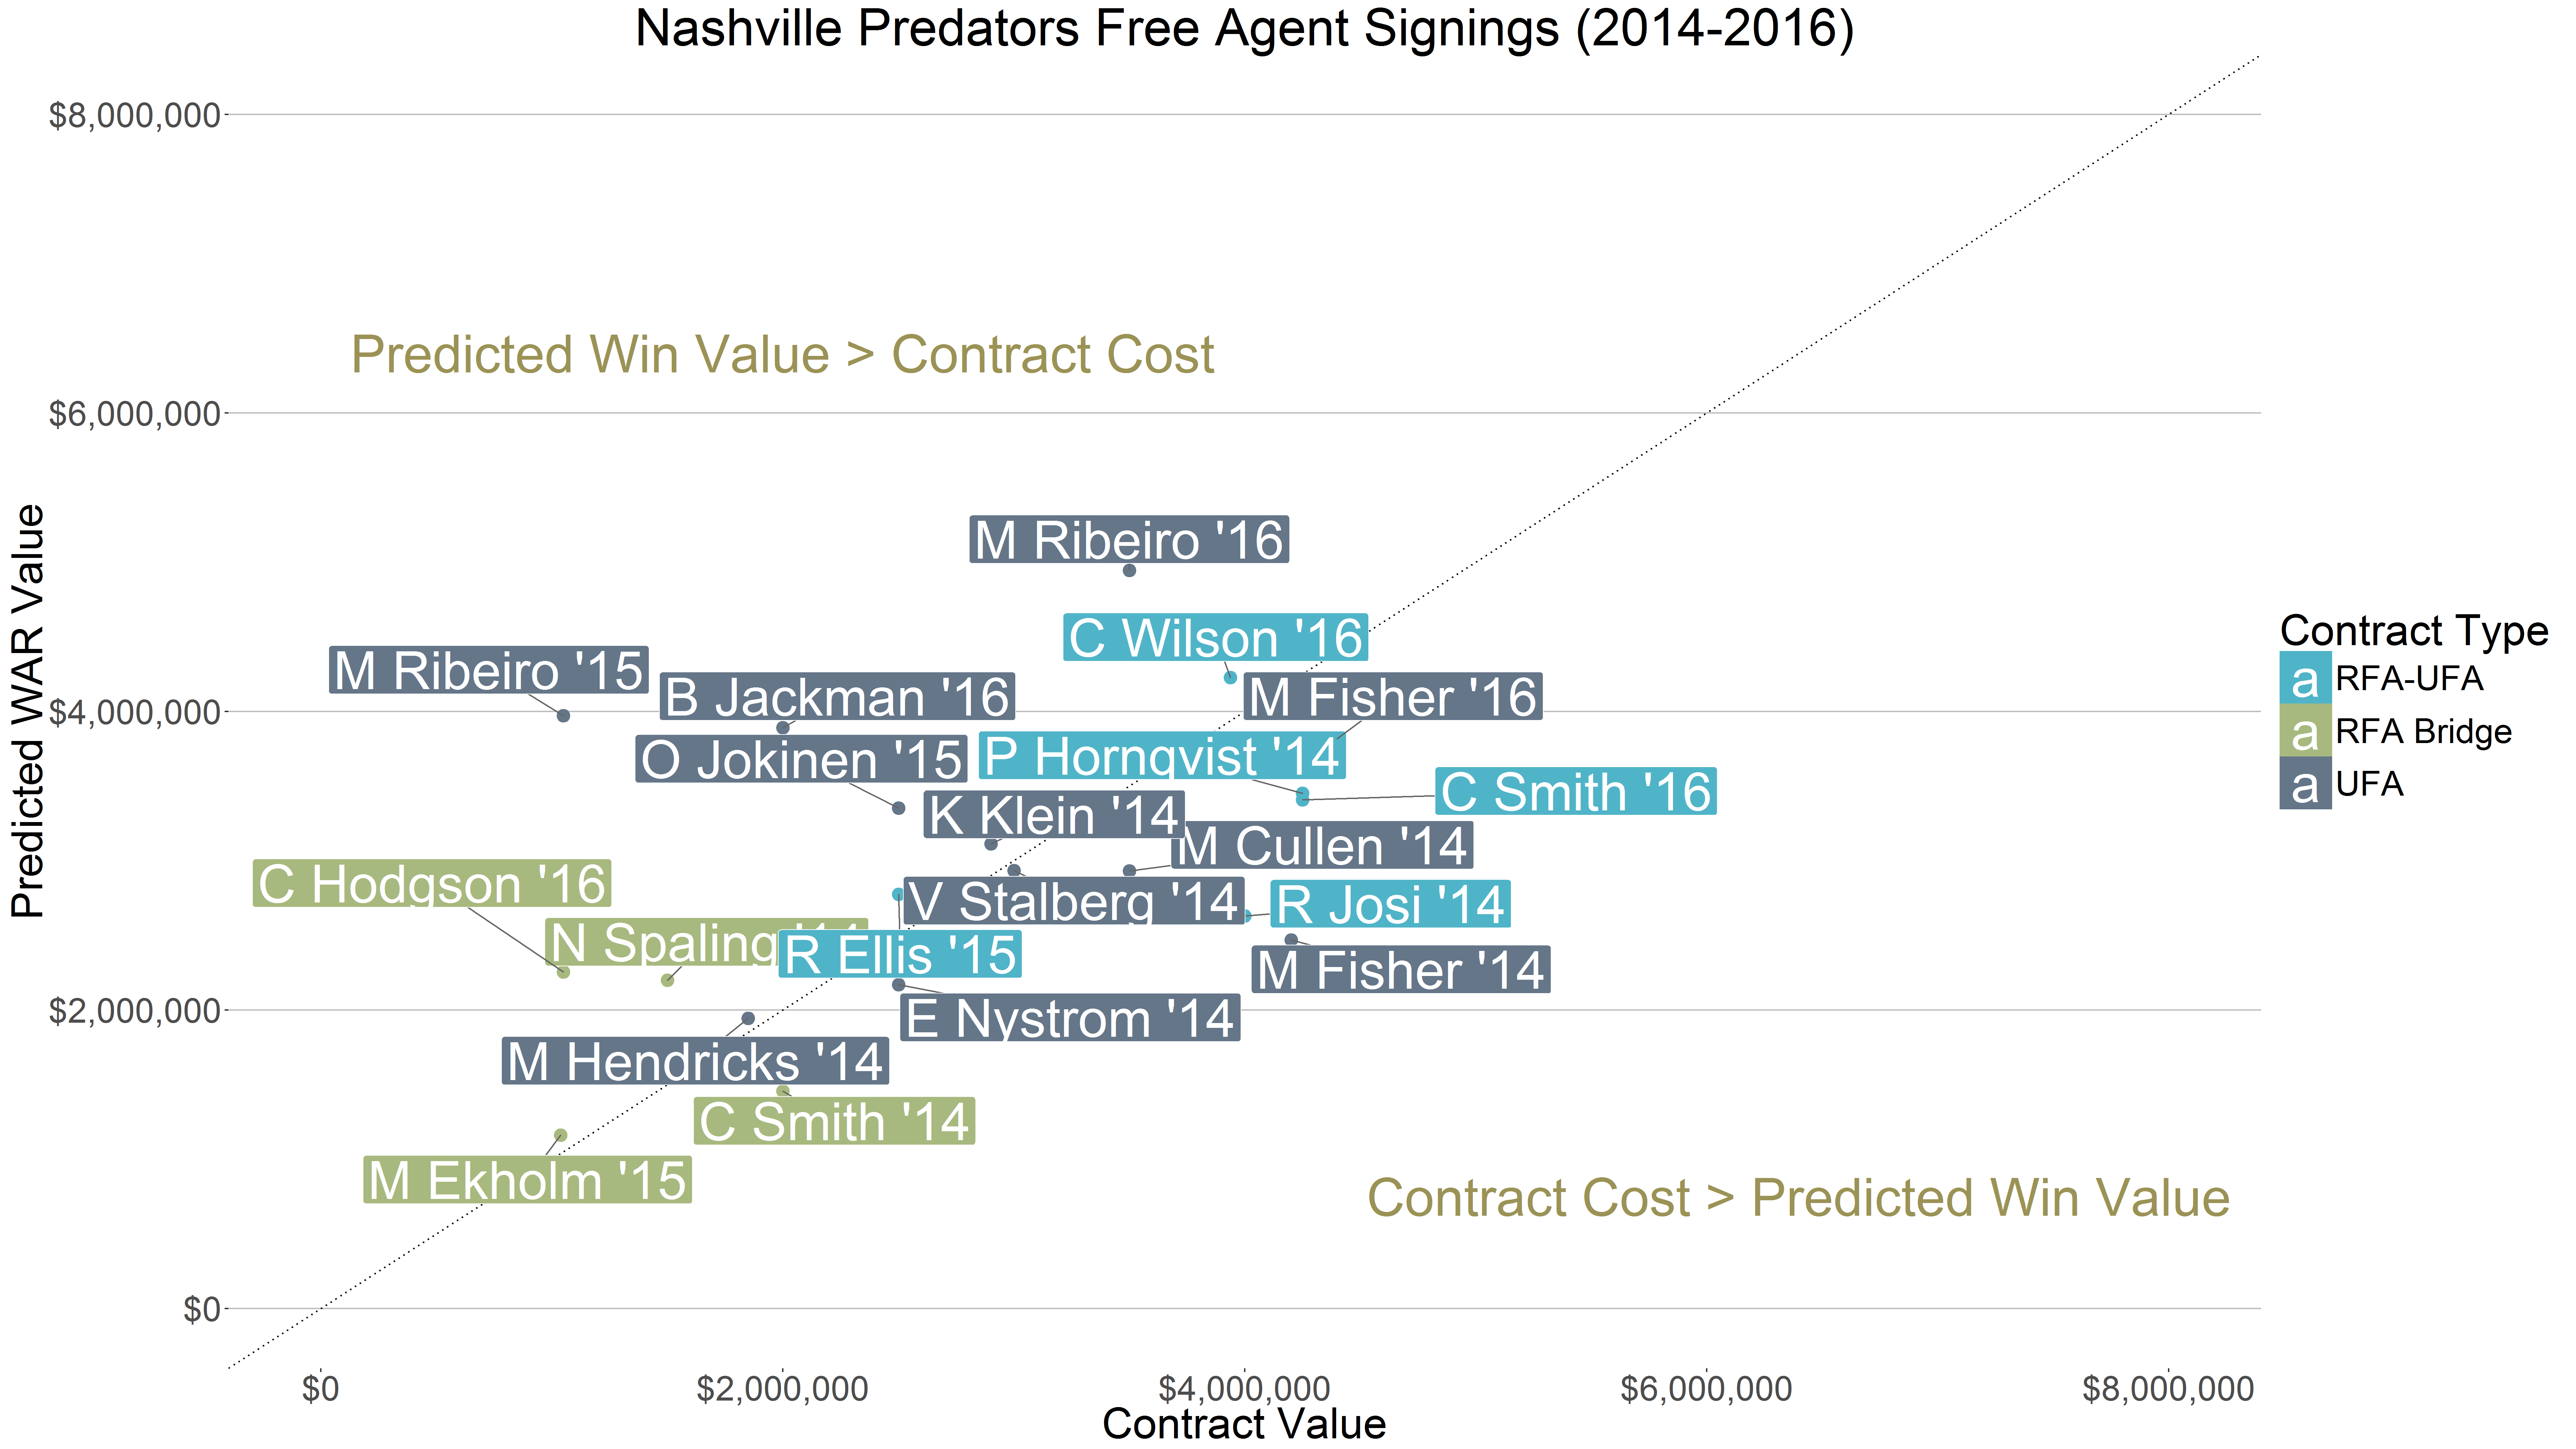
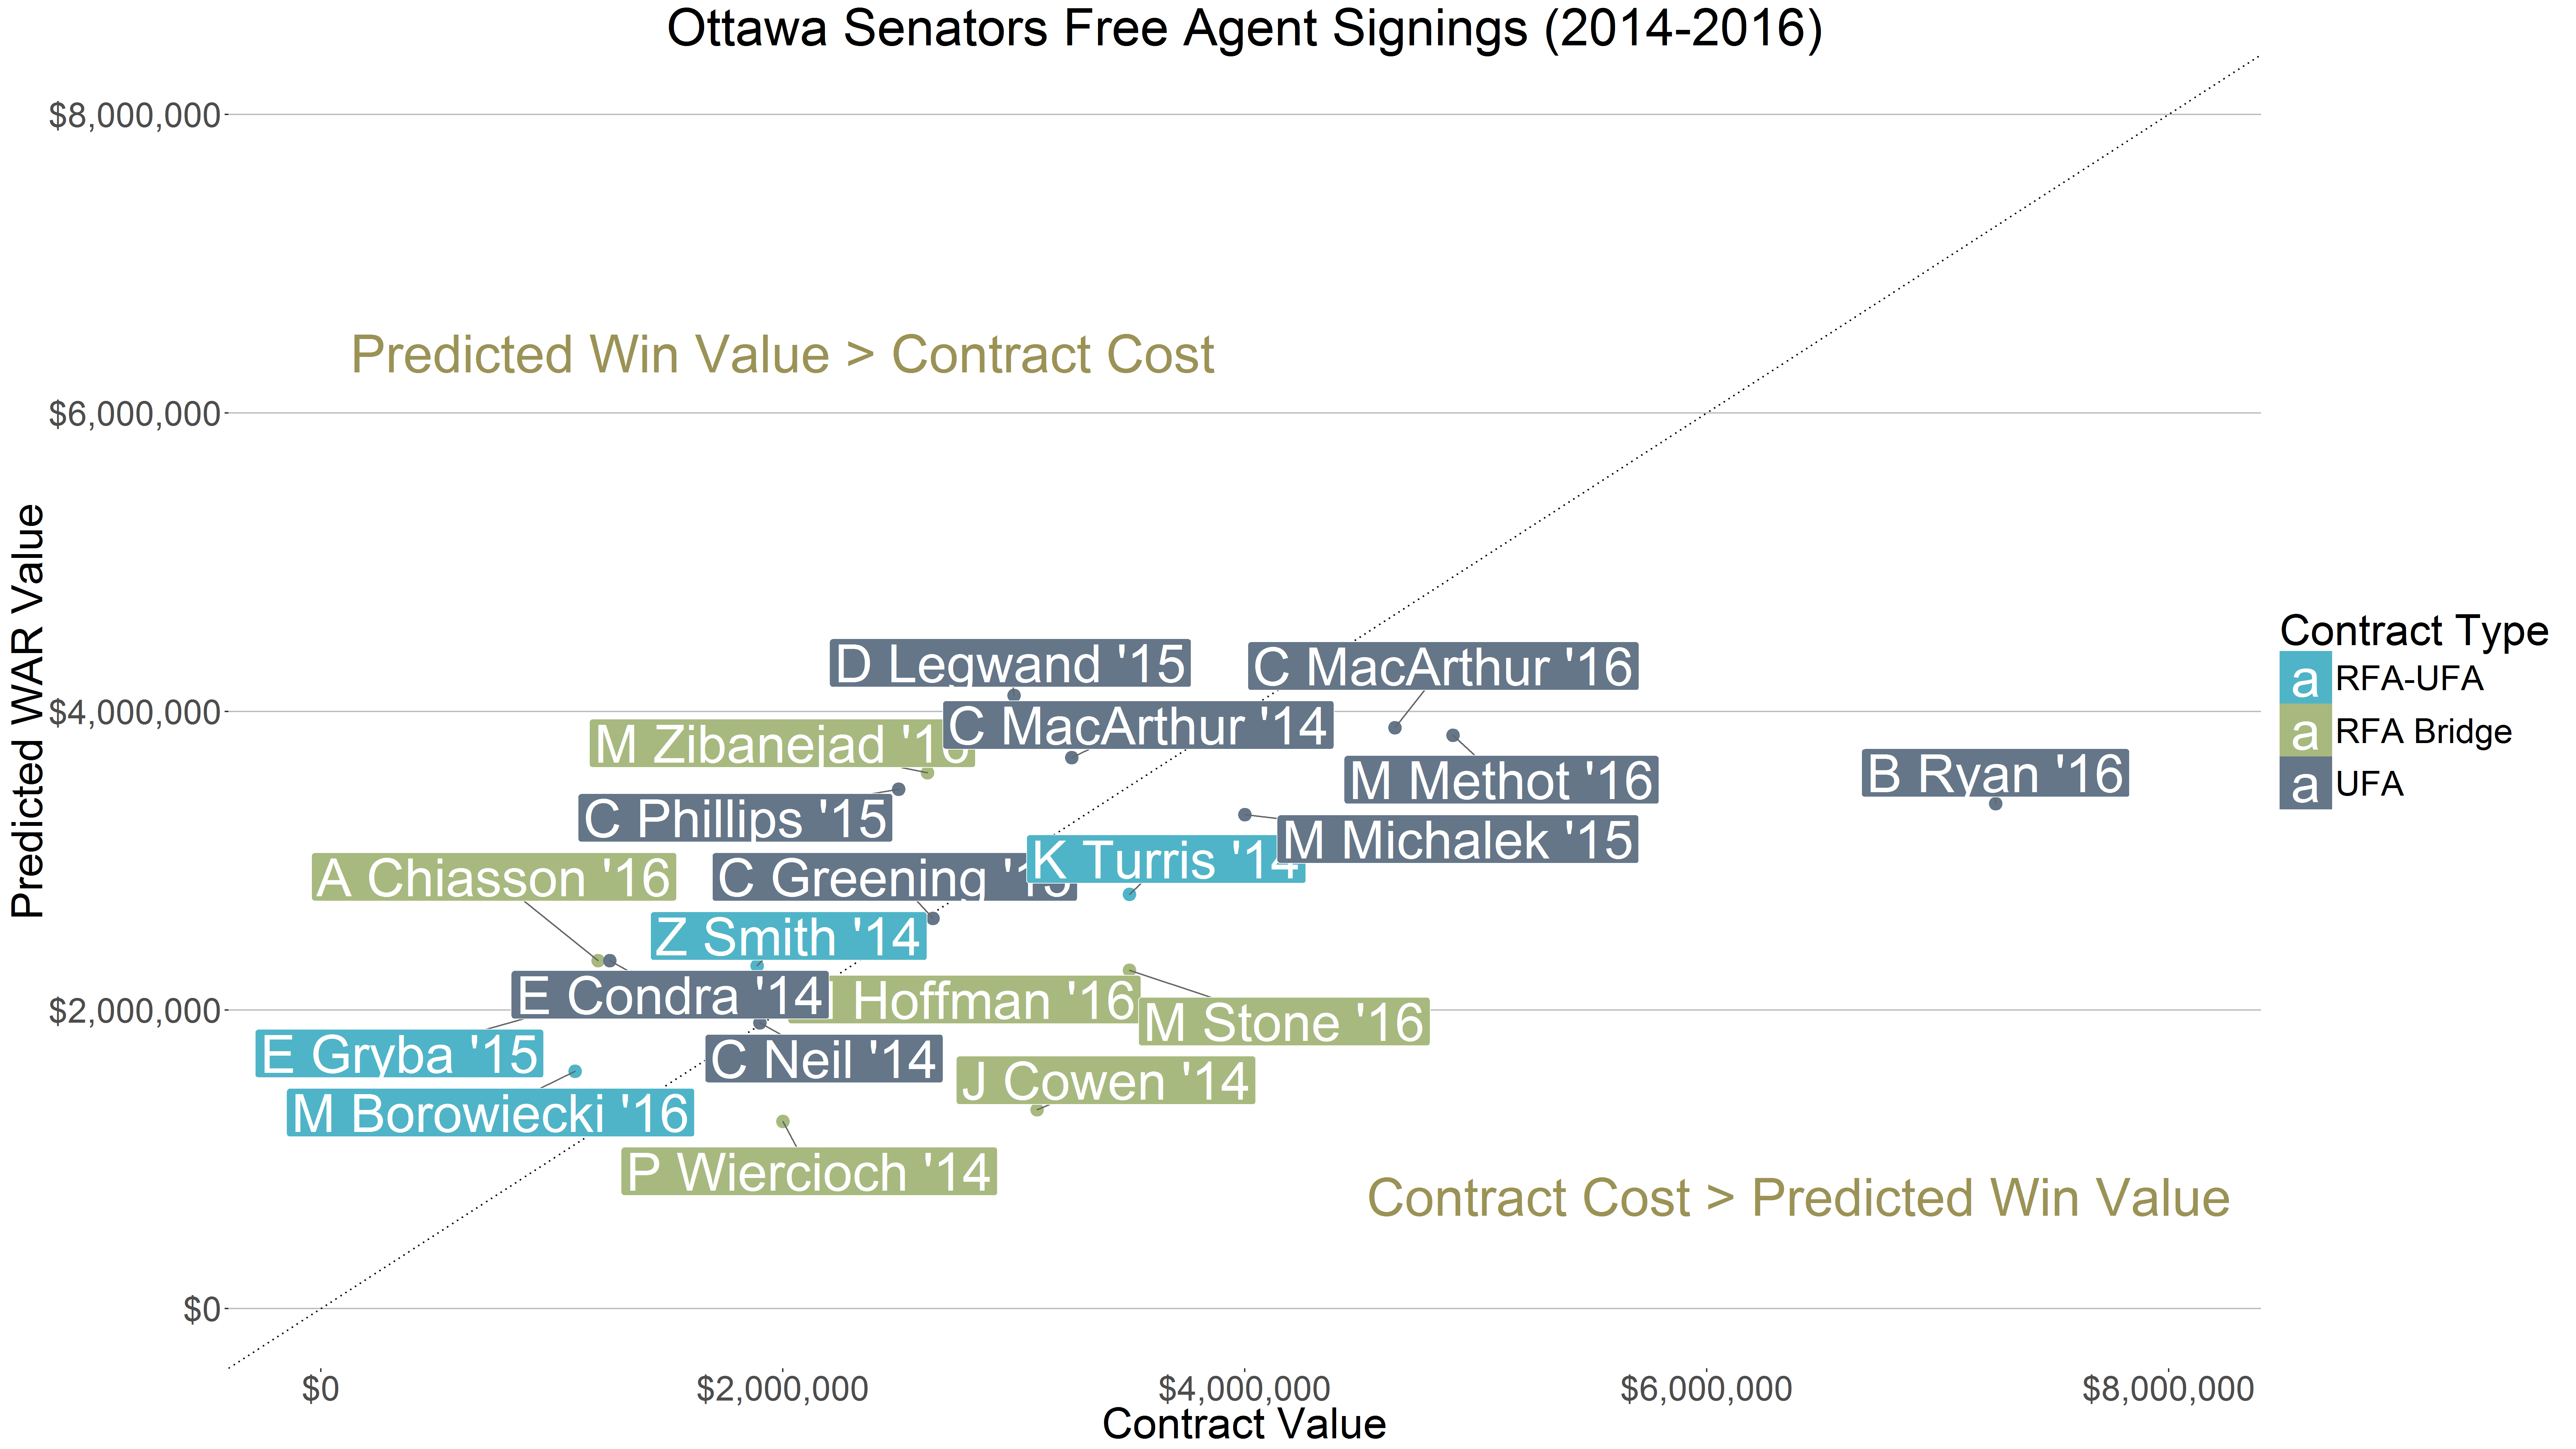
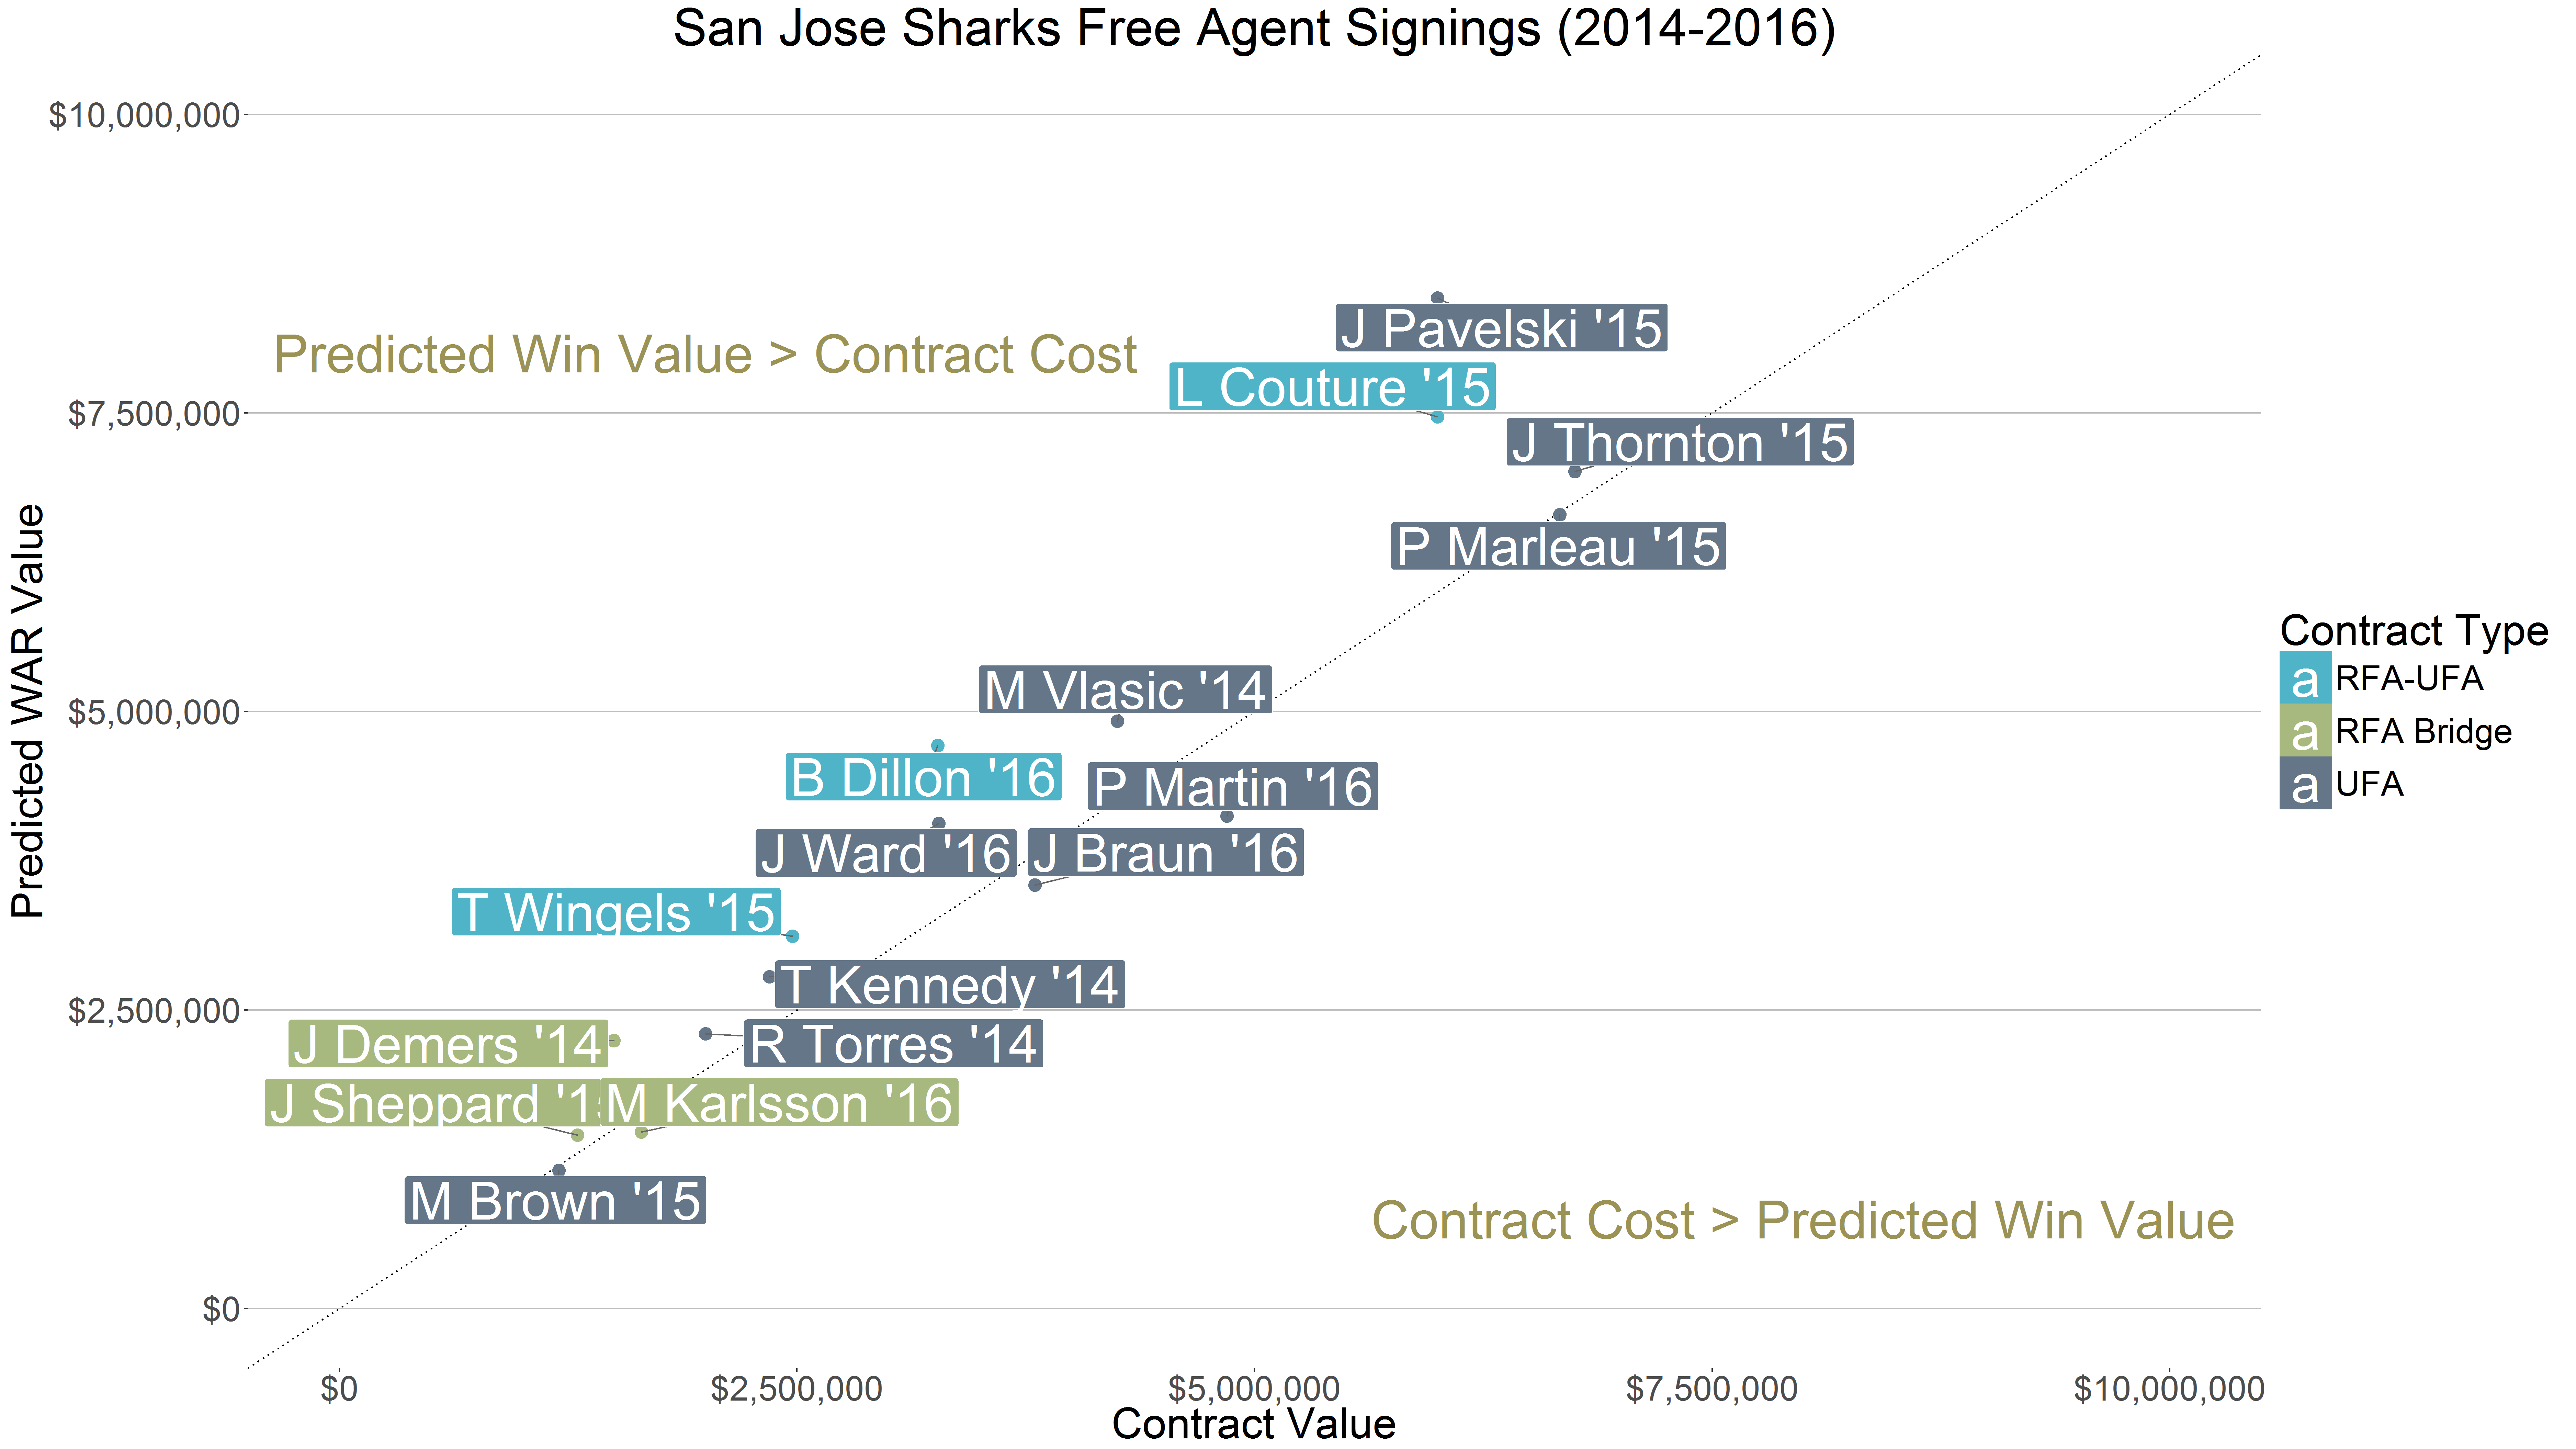
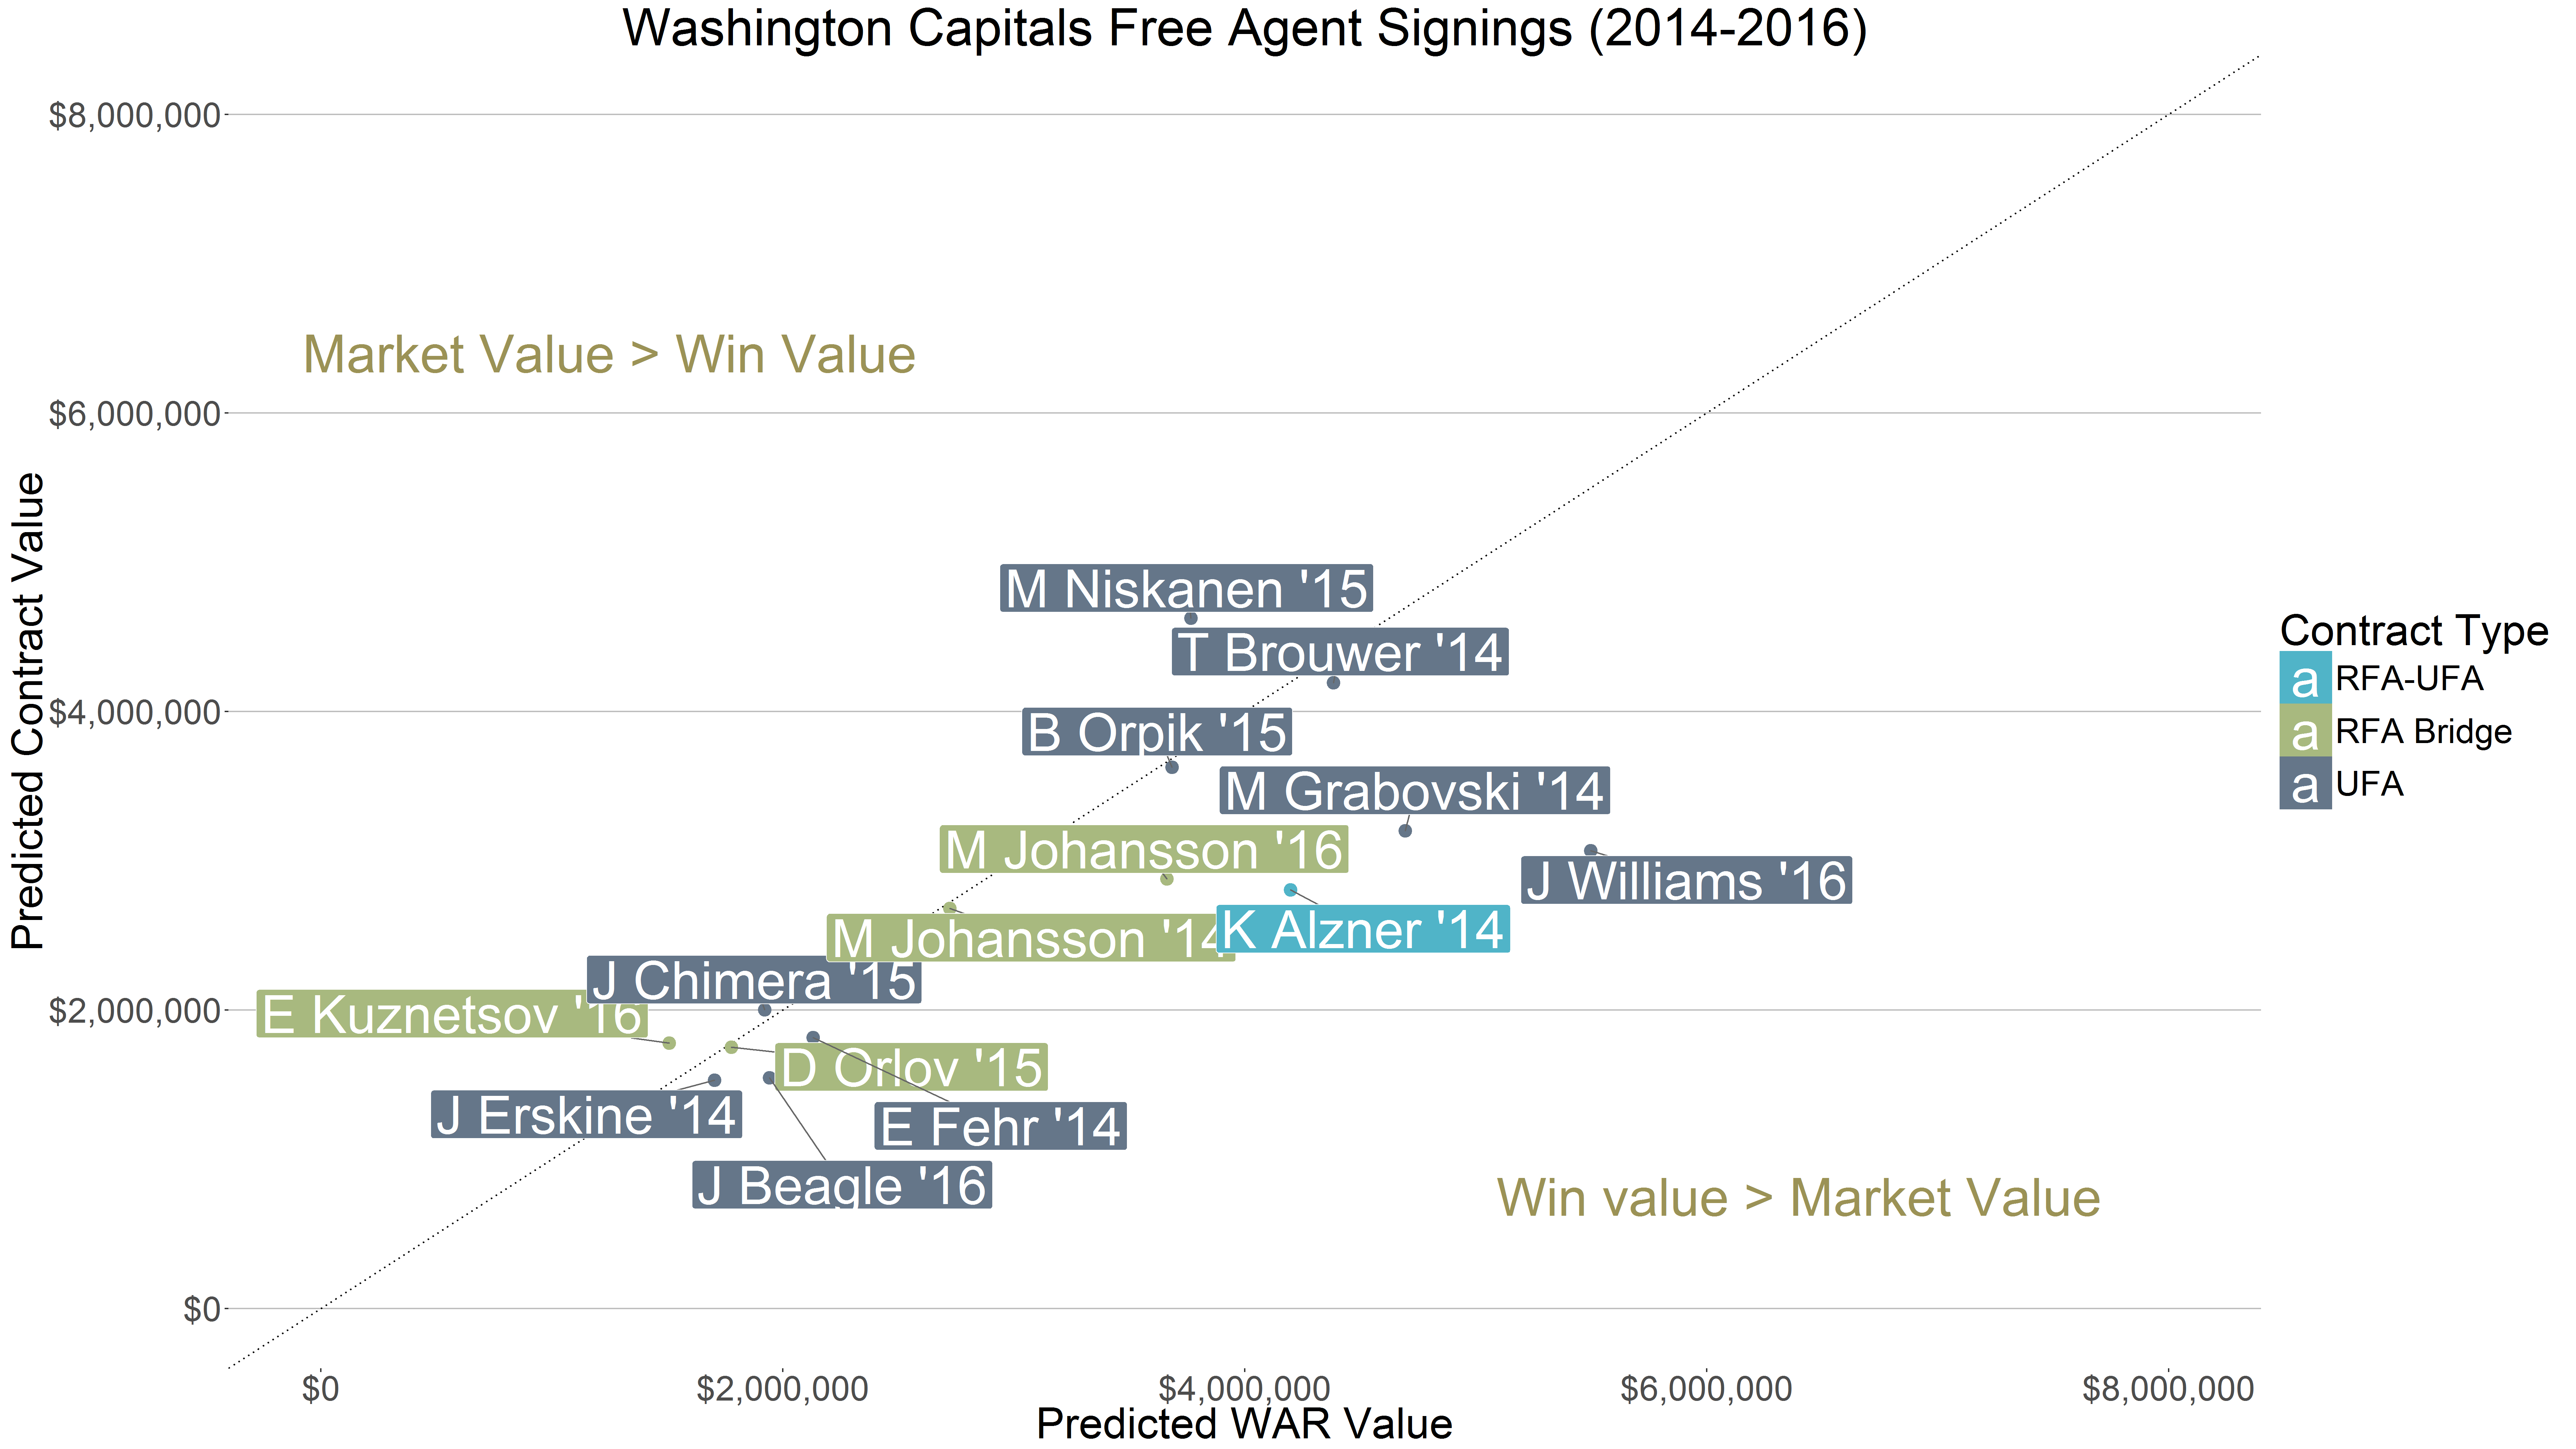
- Win Value vs. Contract Price – identifies whether teams signed players who have provided more wins than their contract price would indicate.
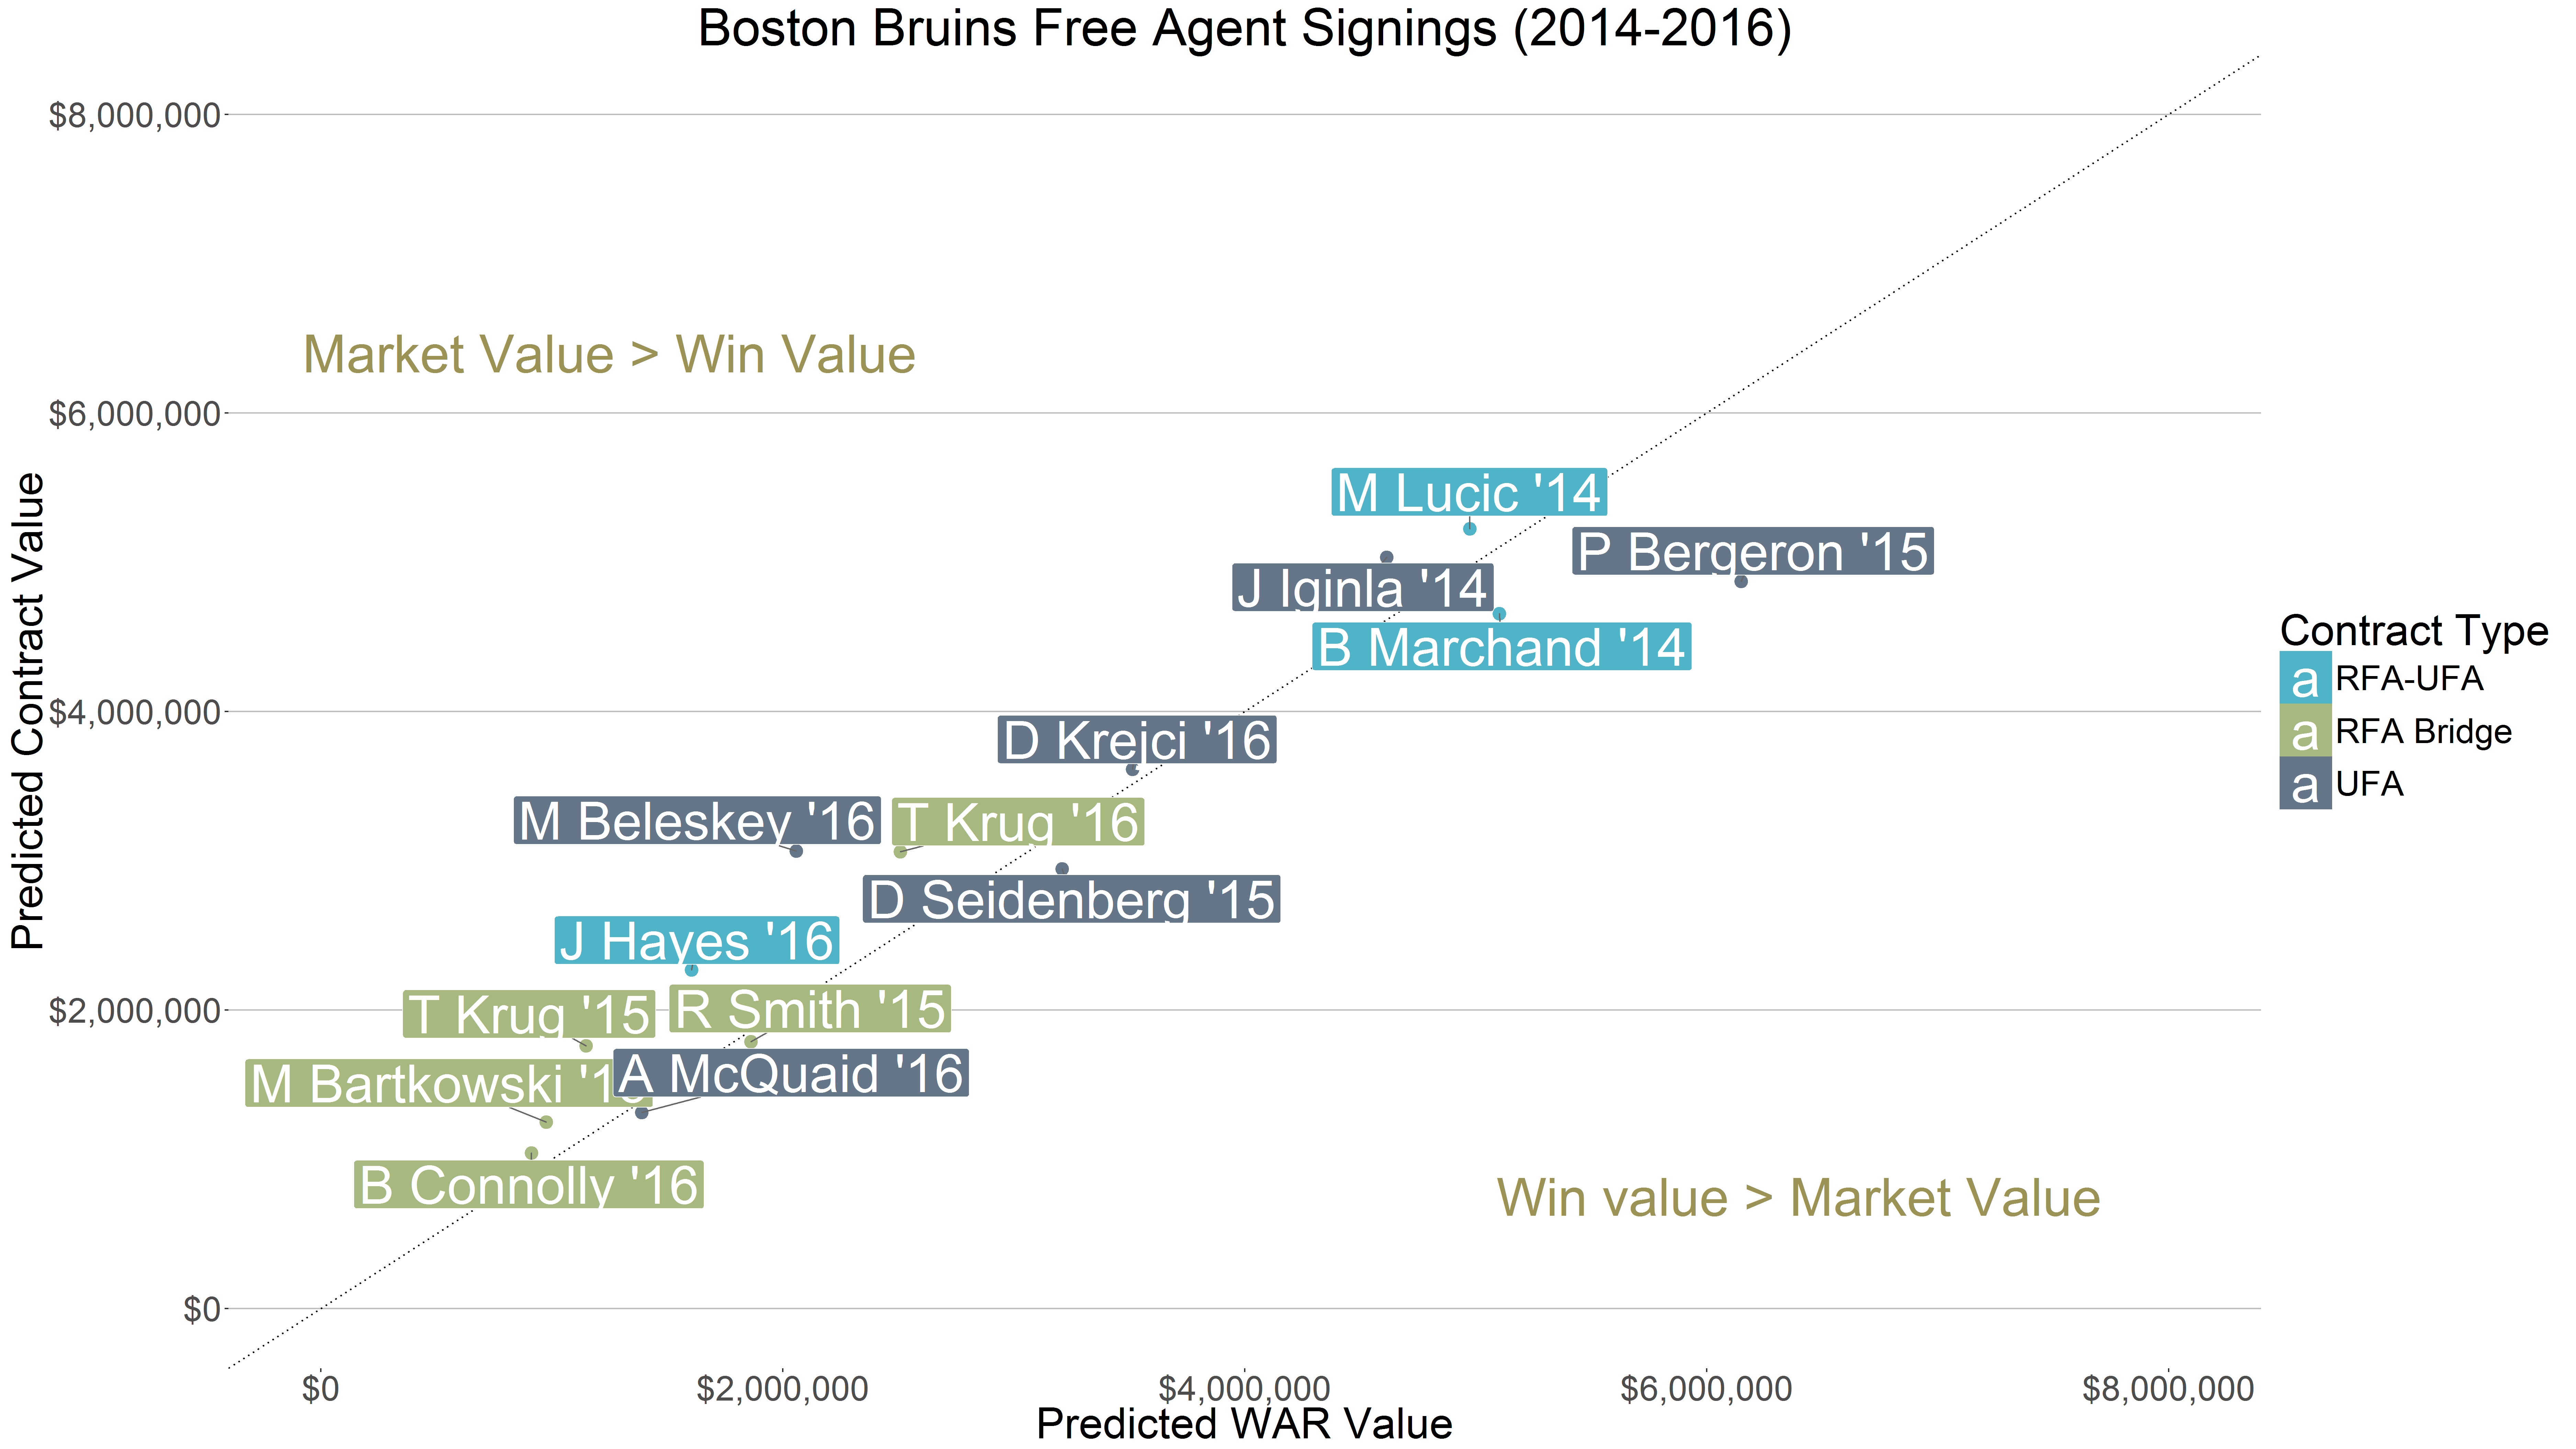
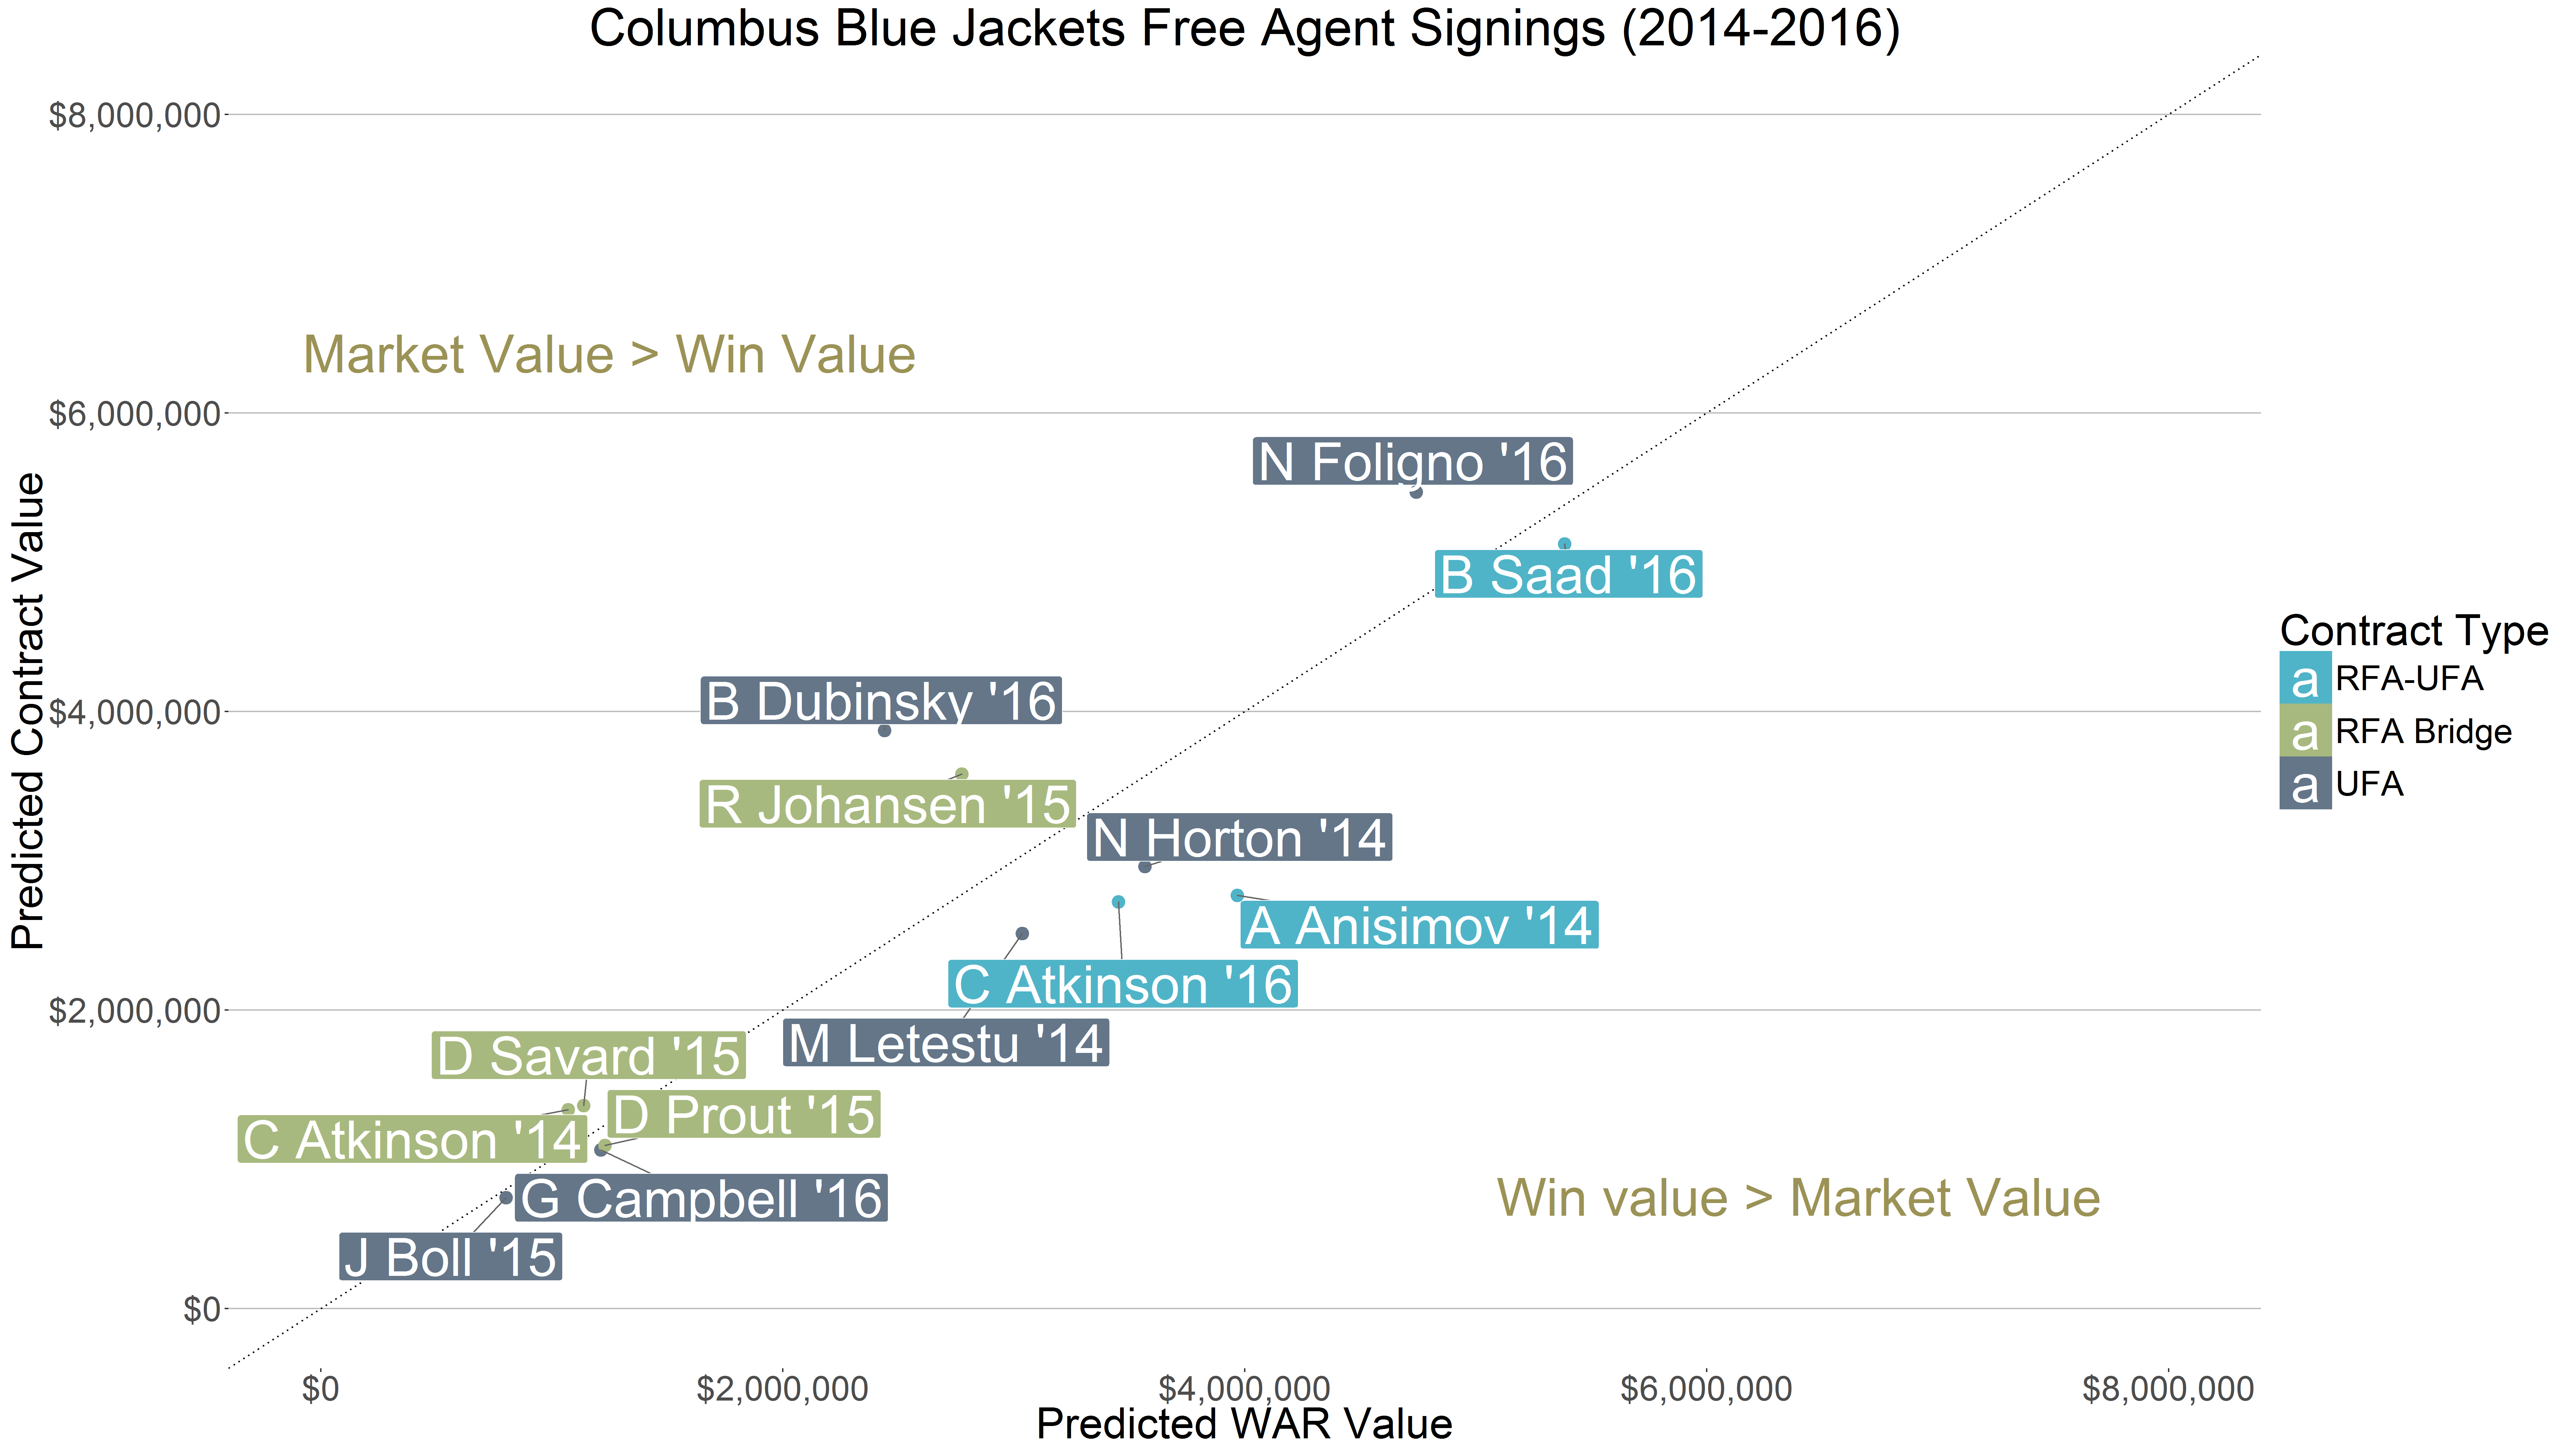
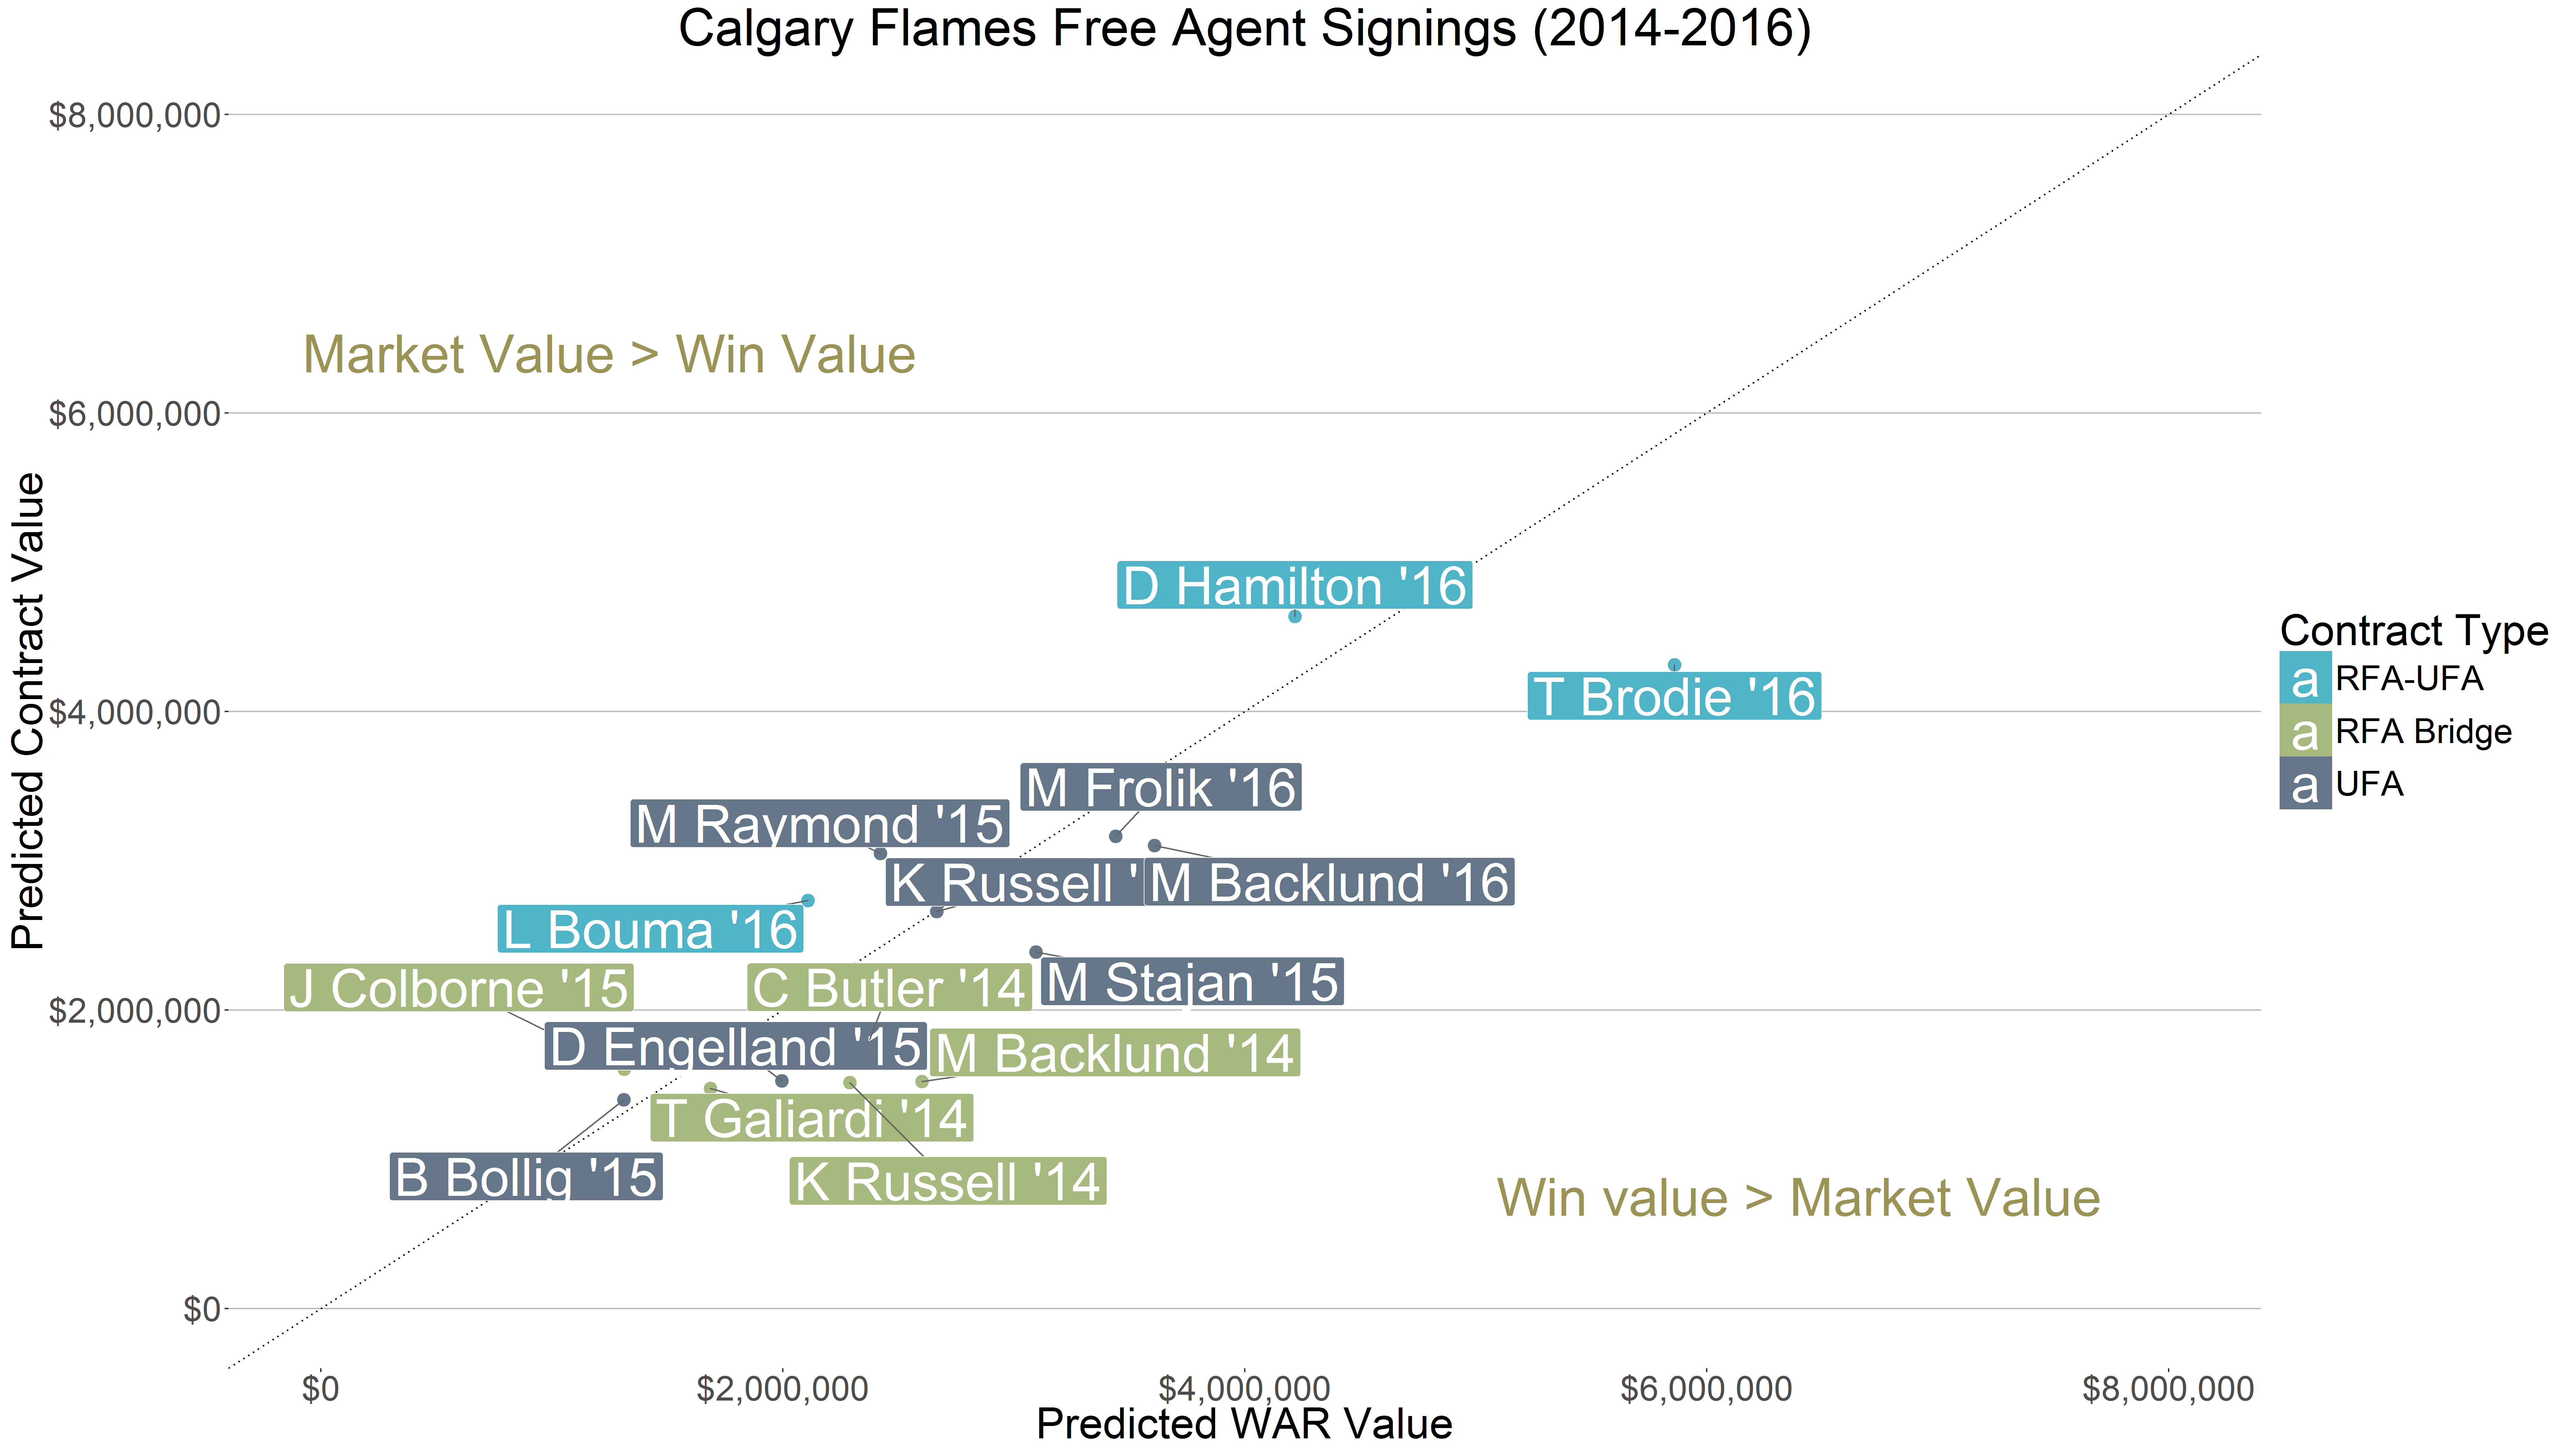
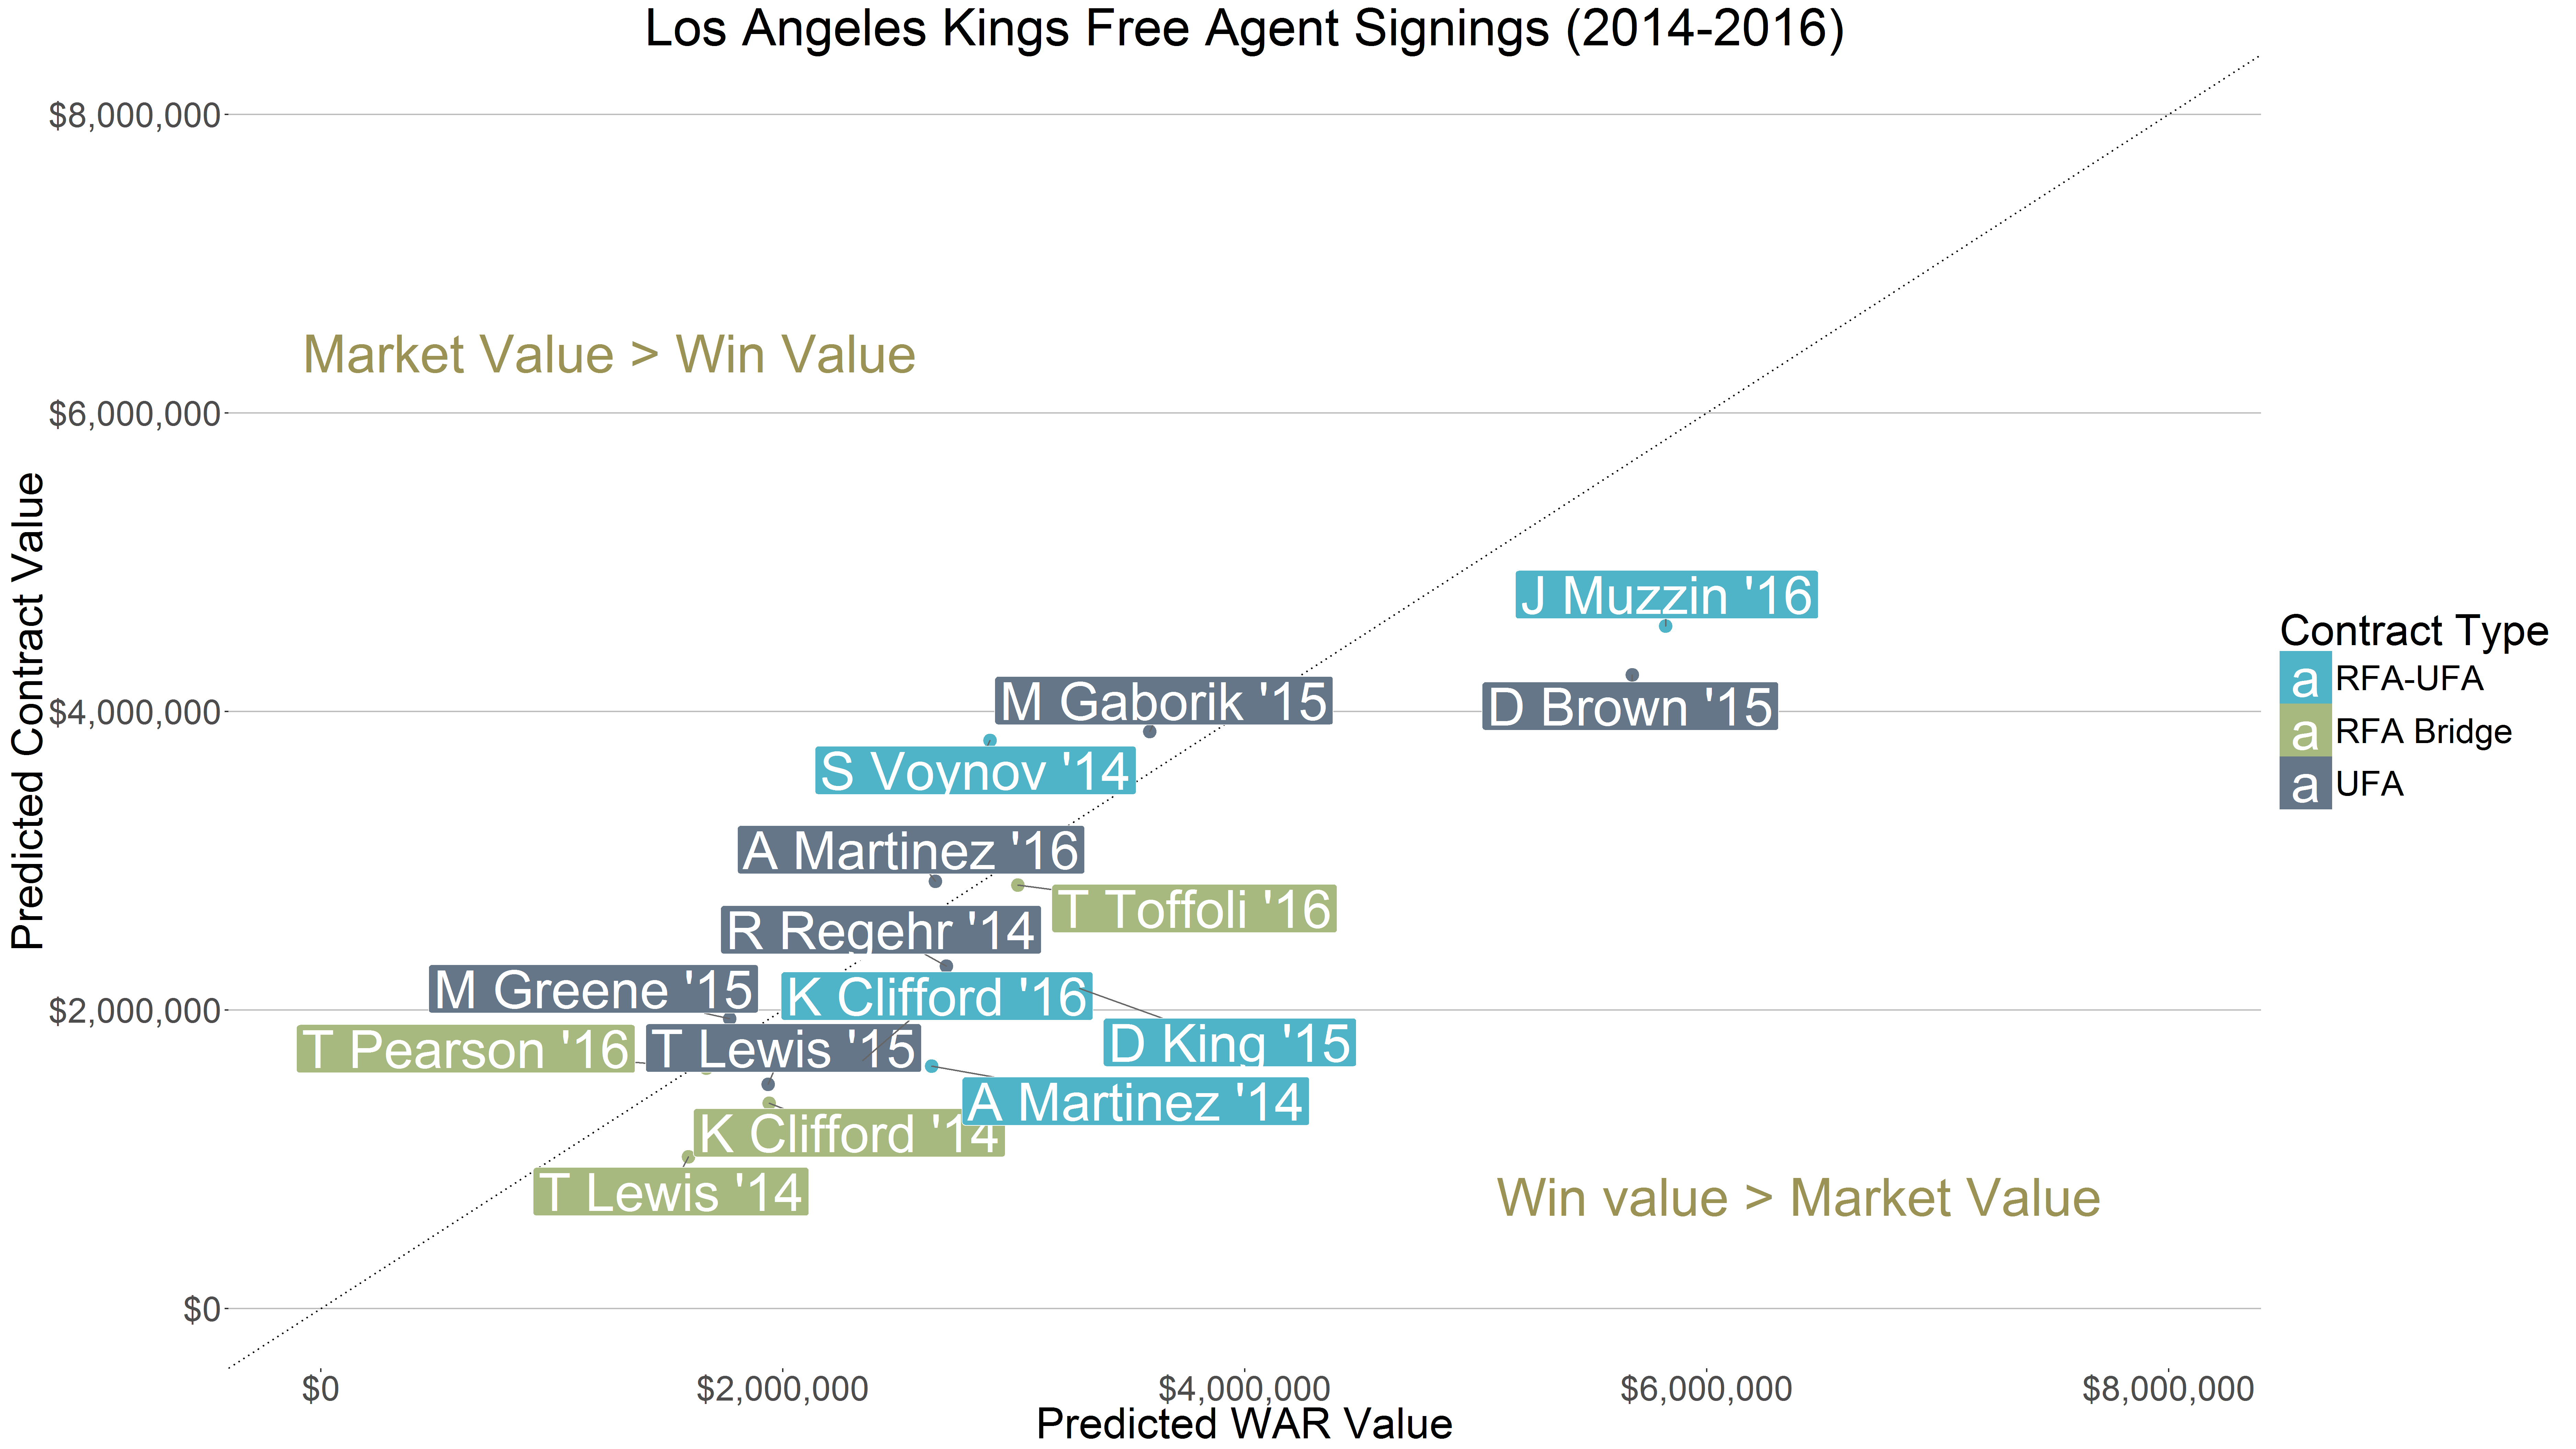
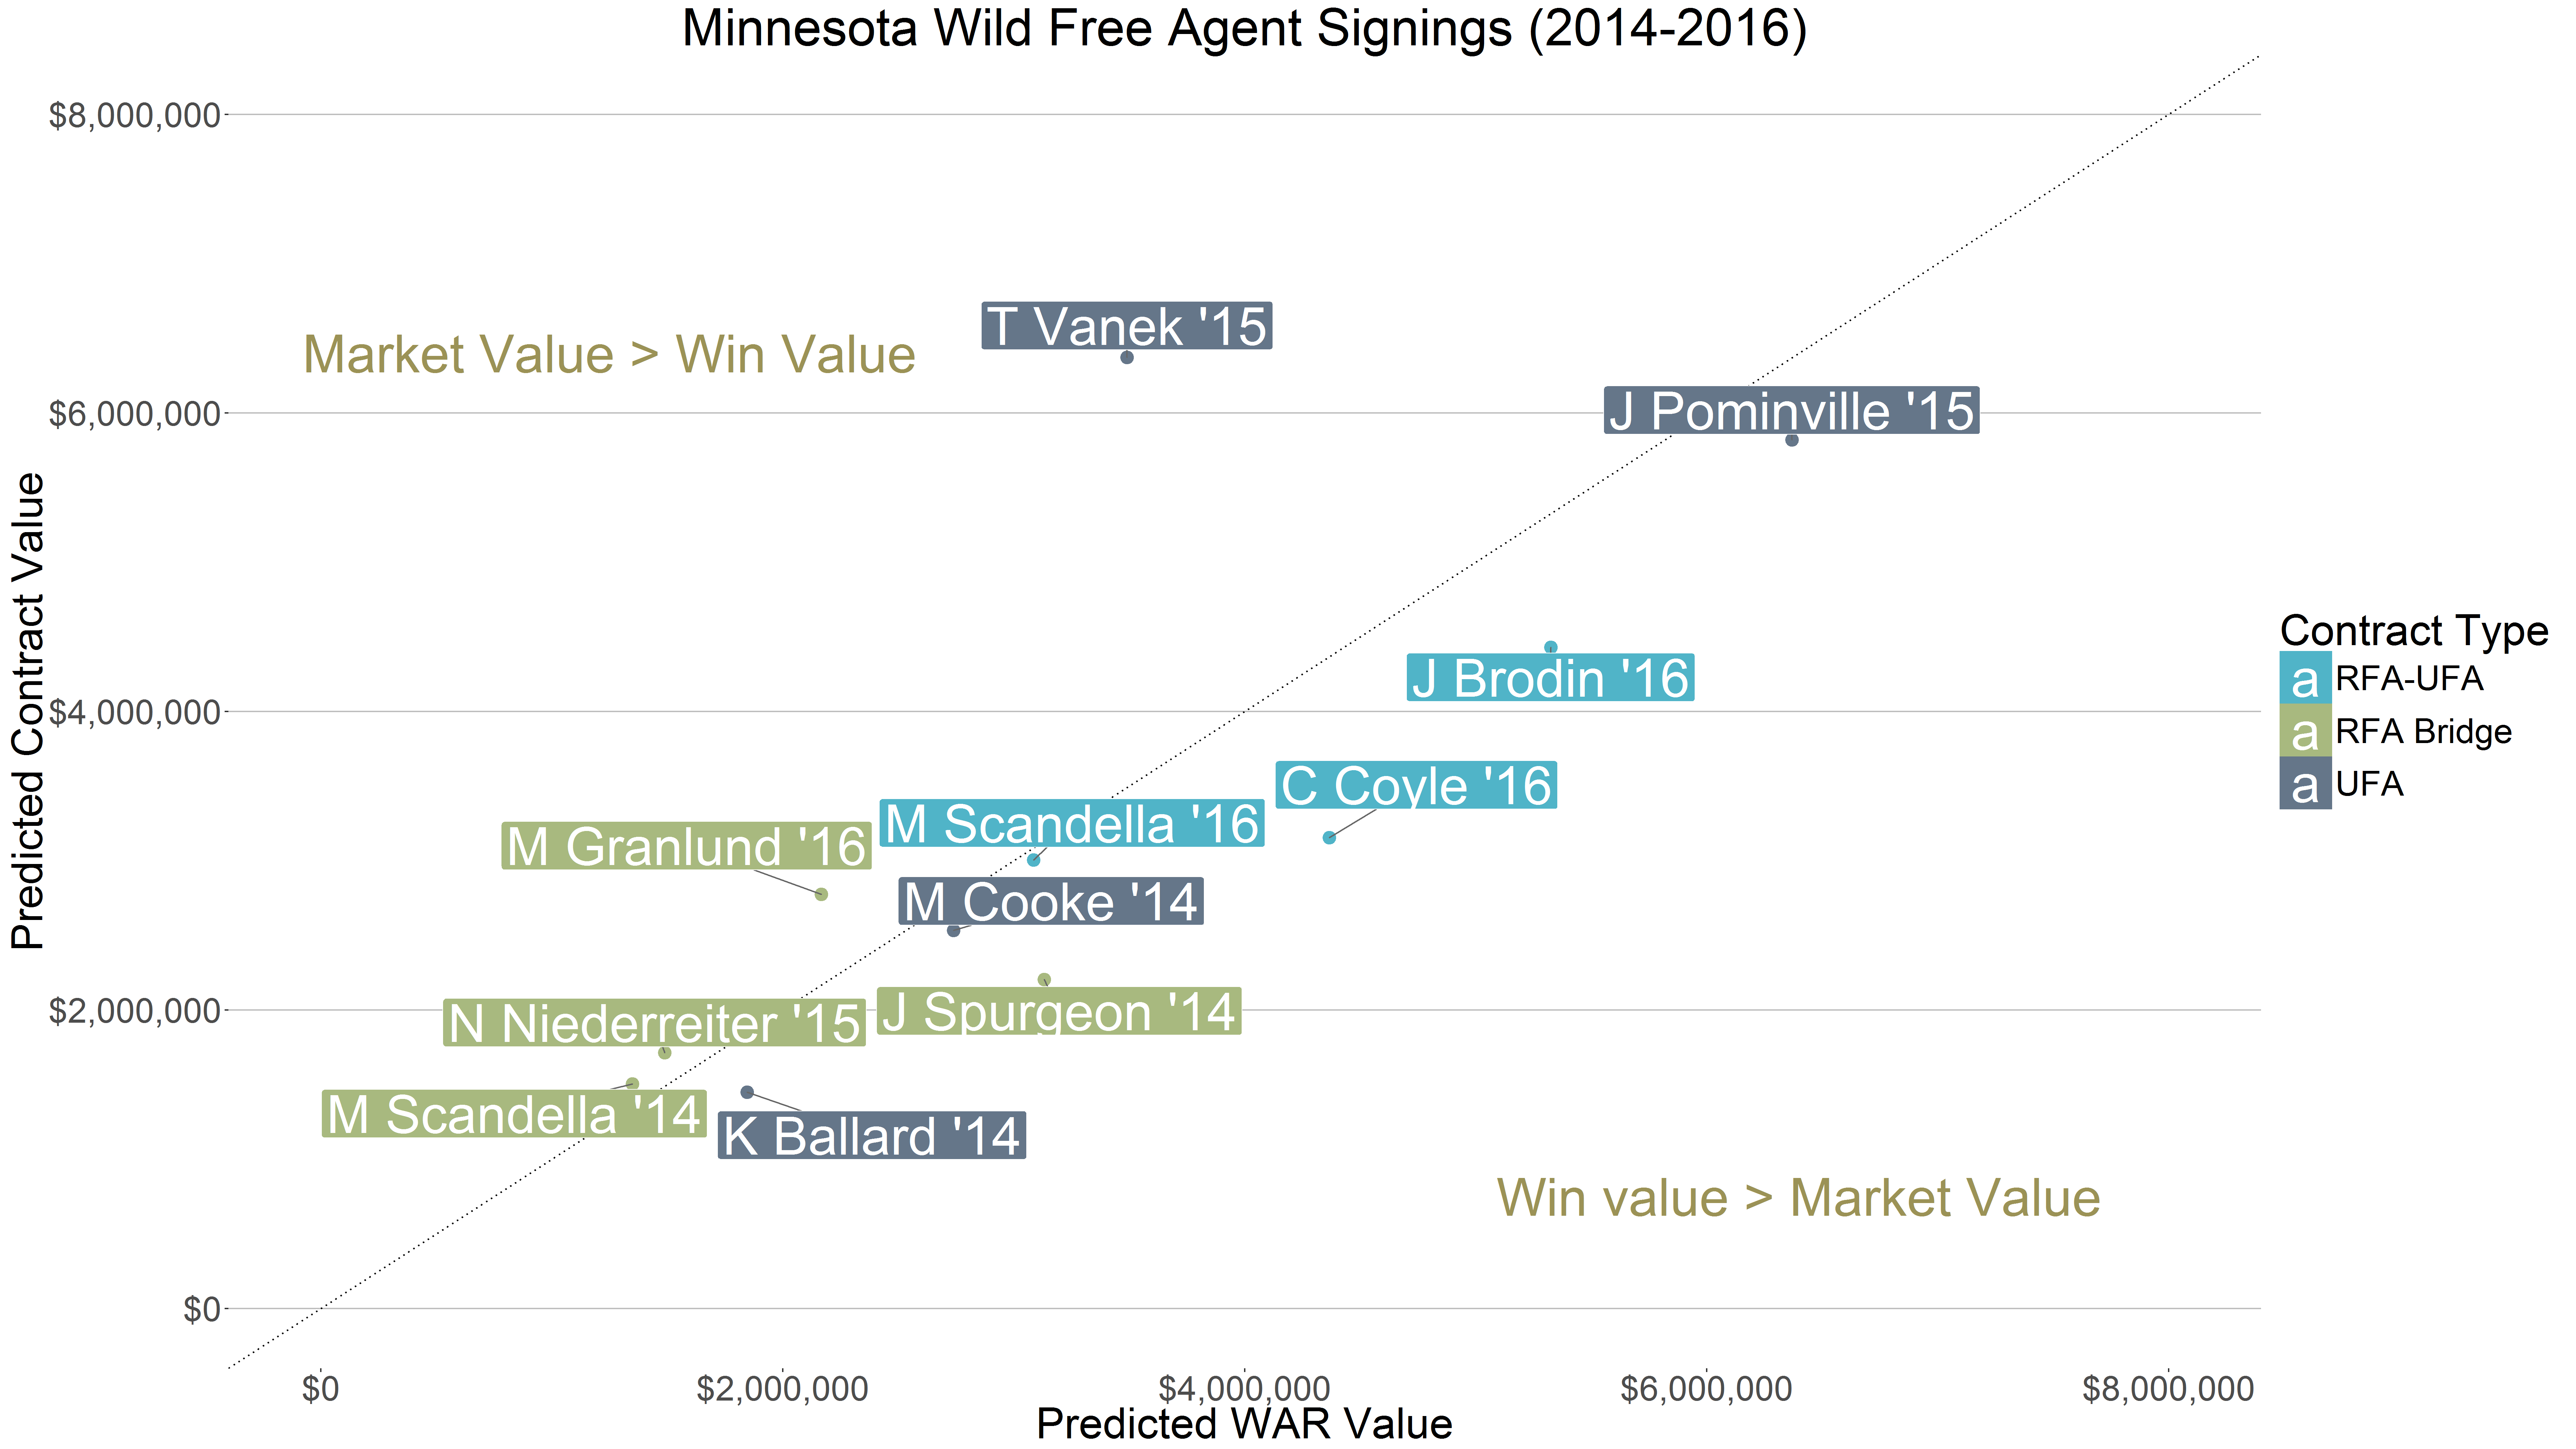
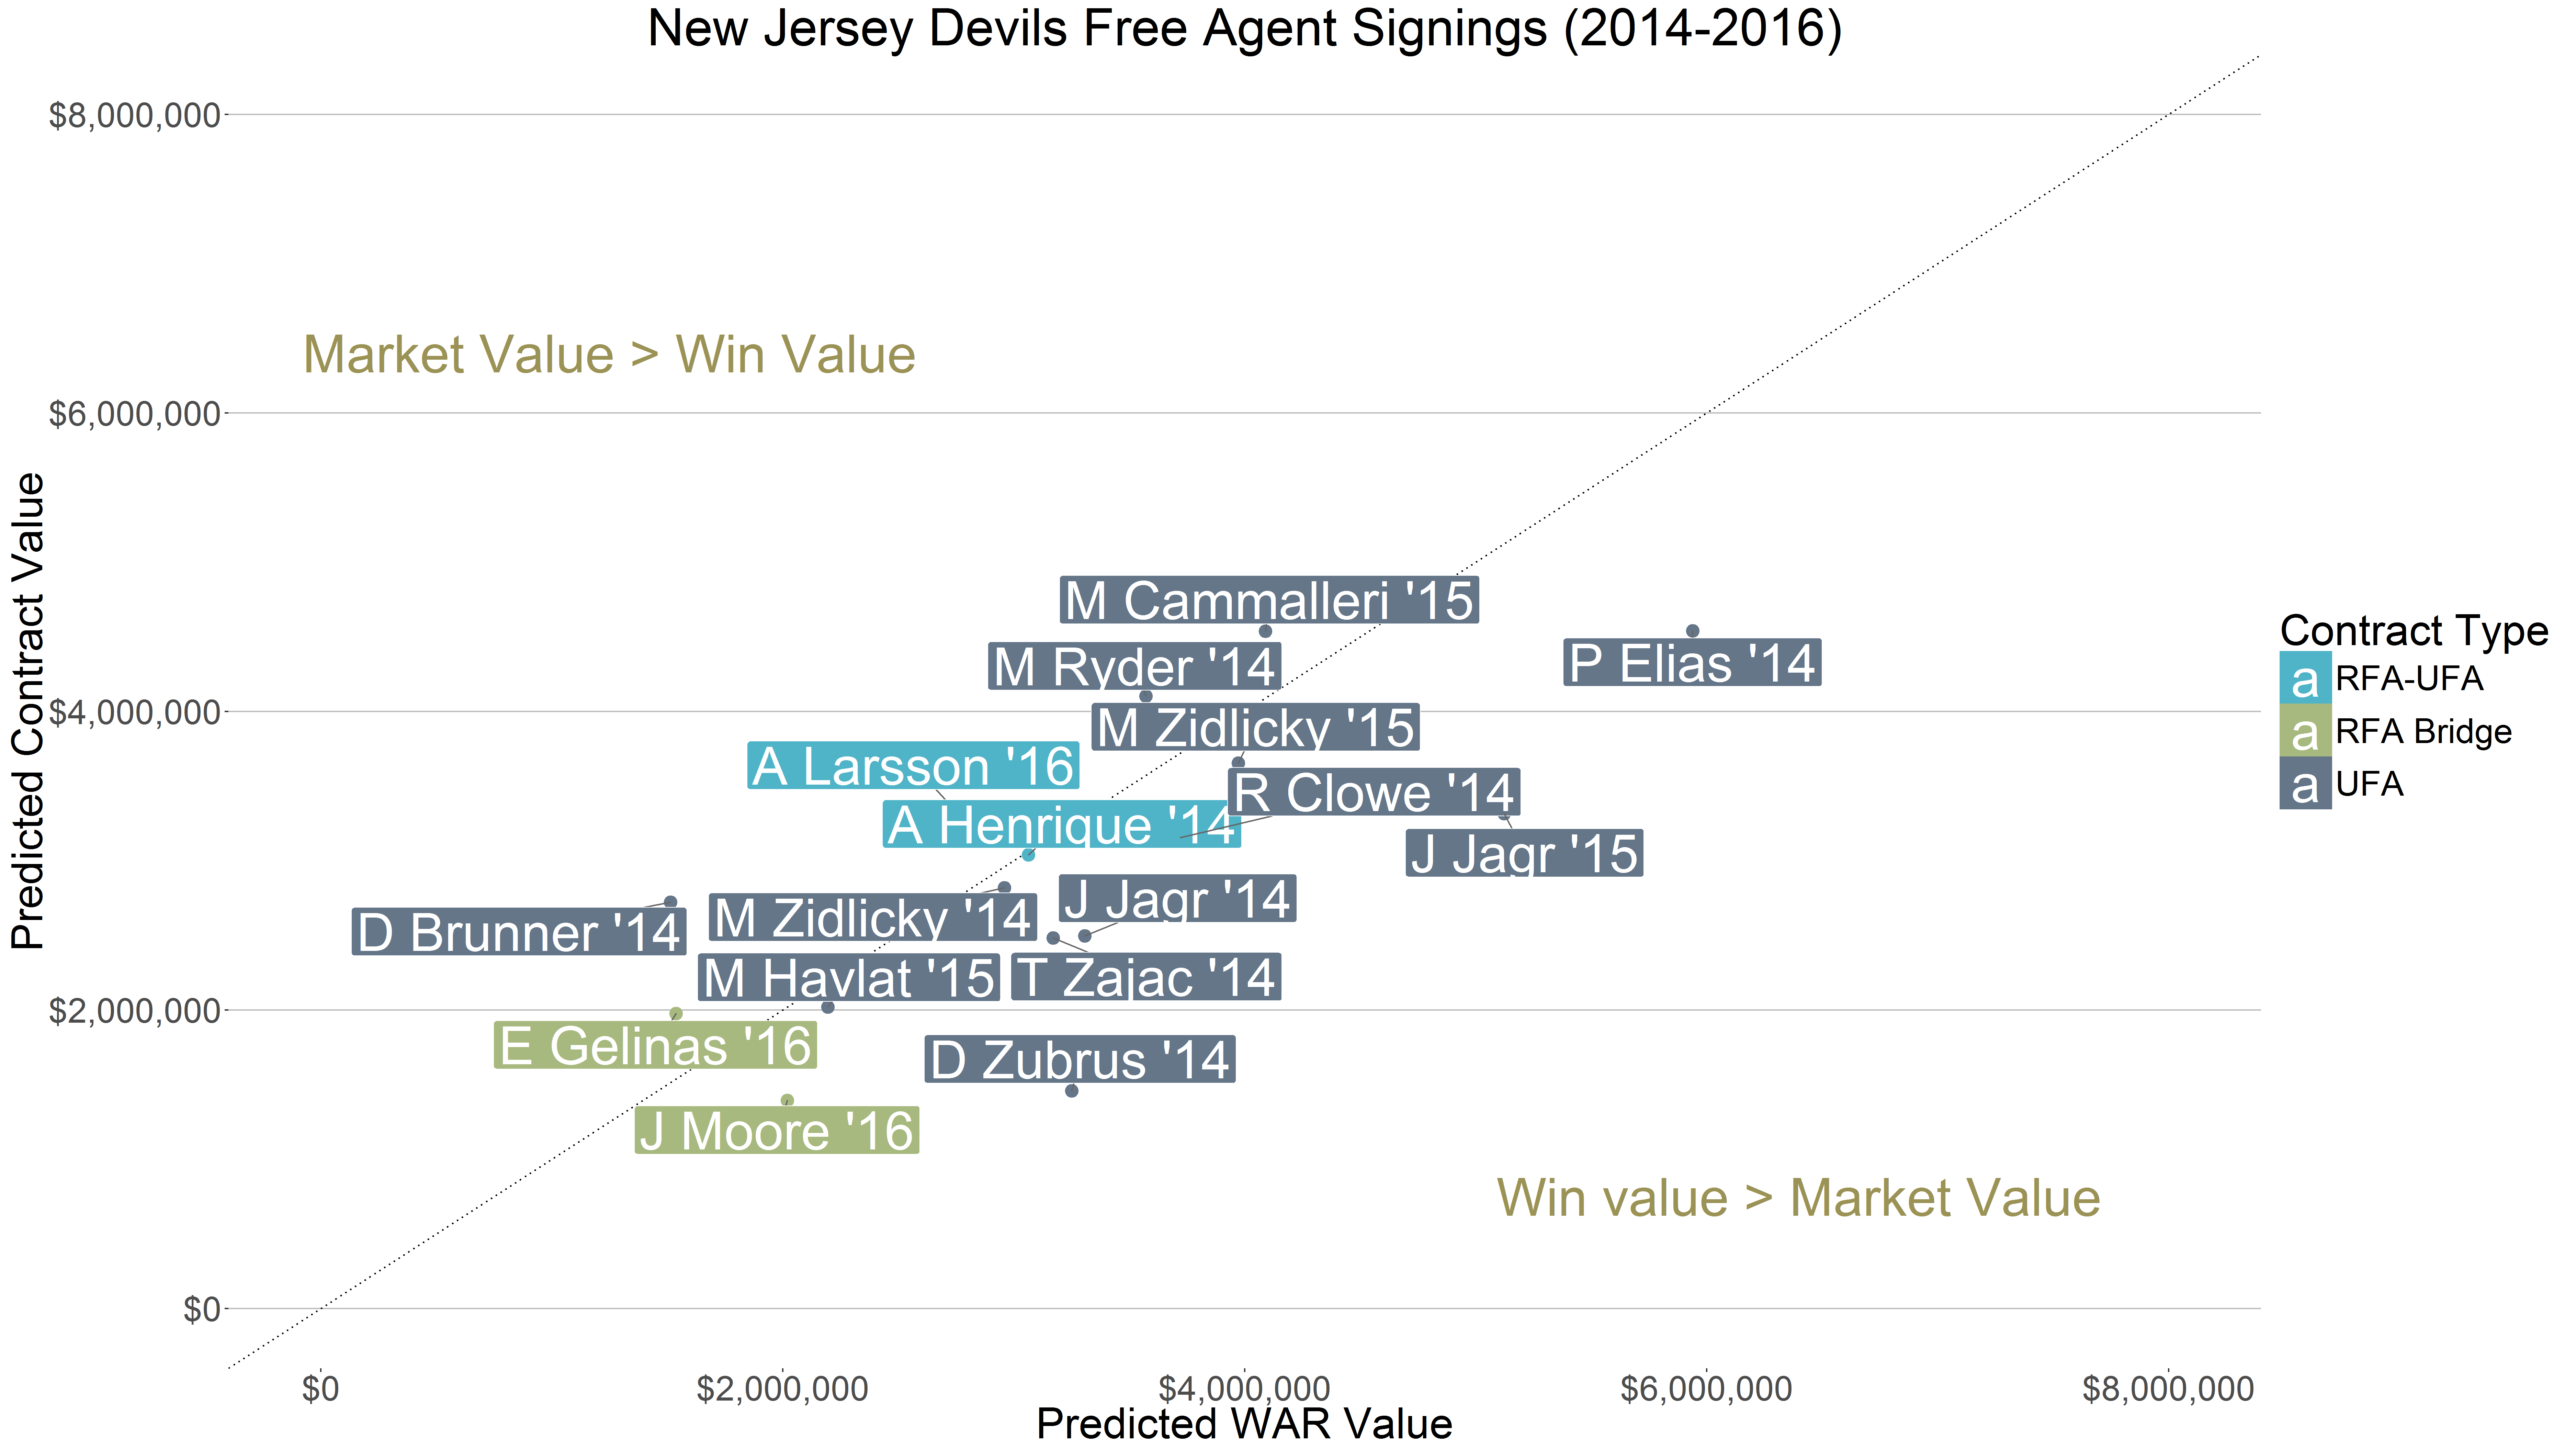
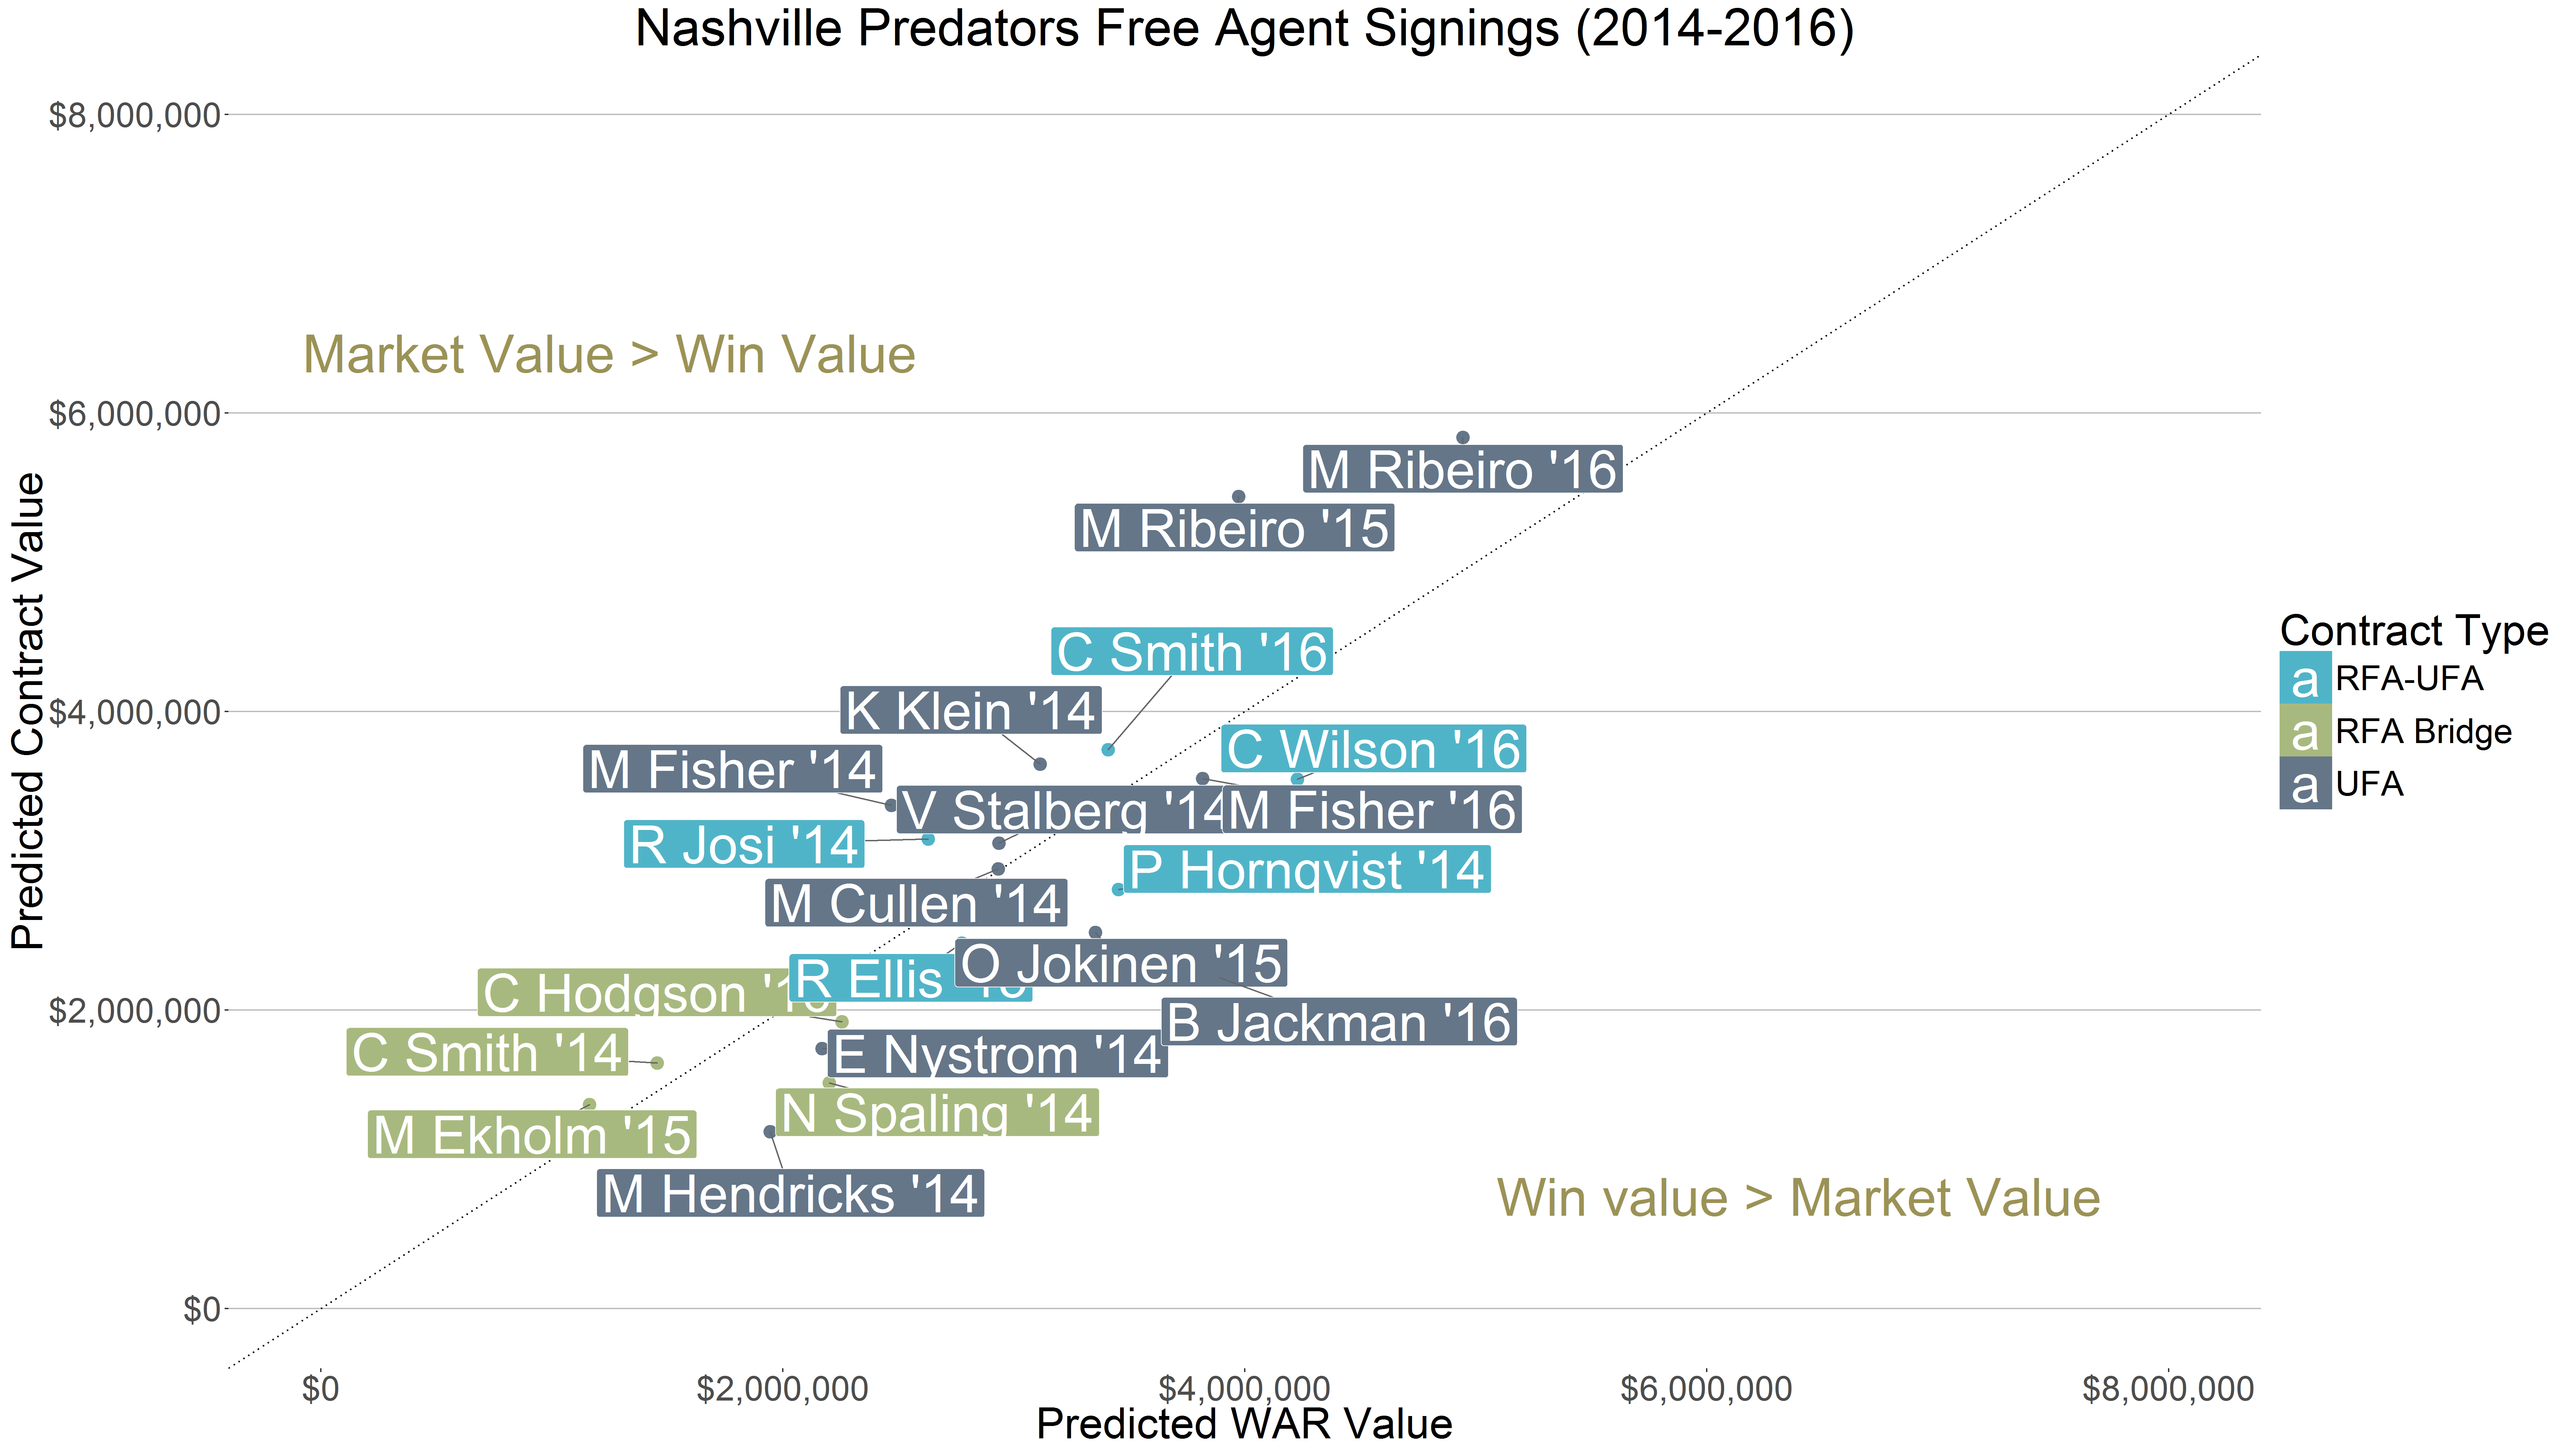
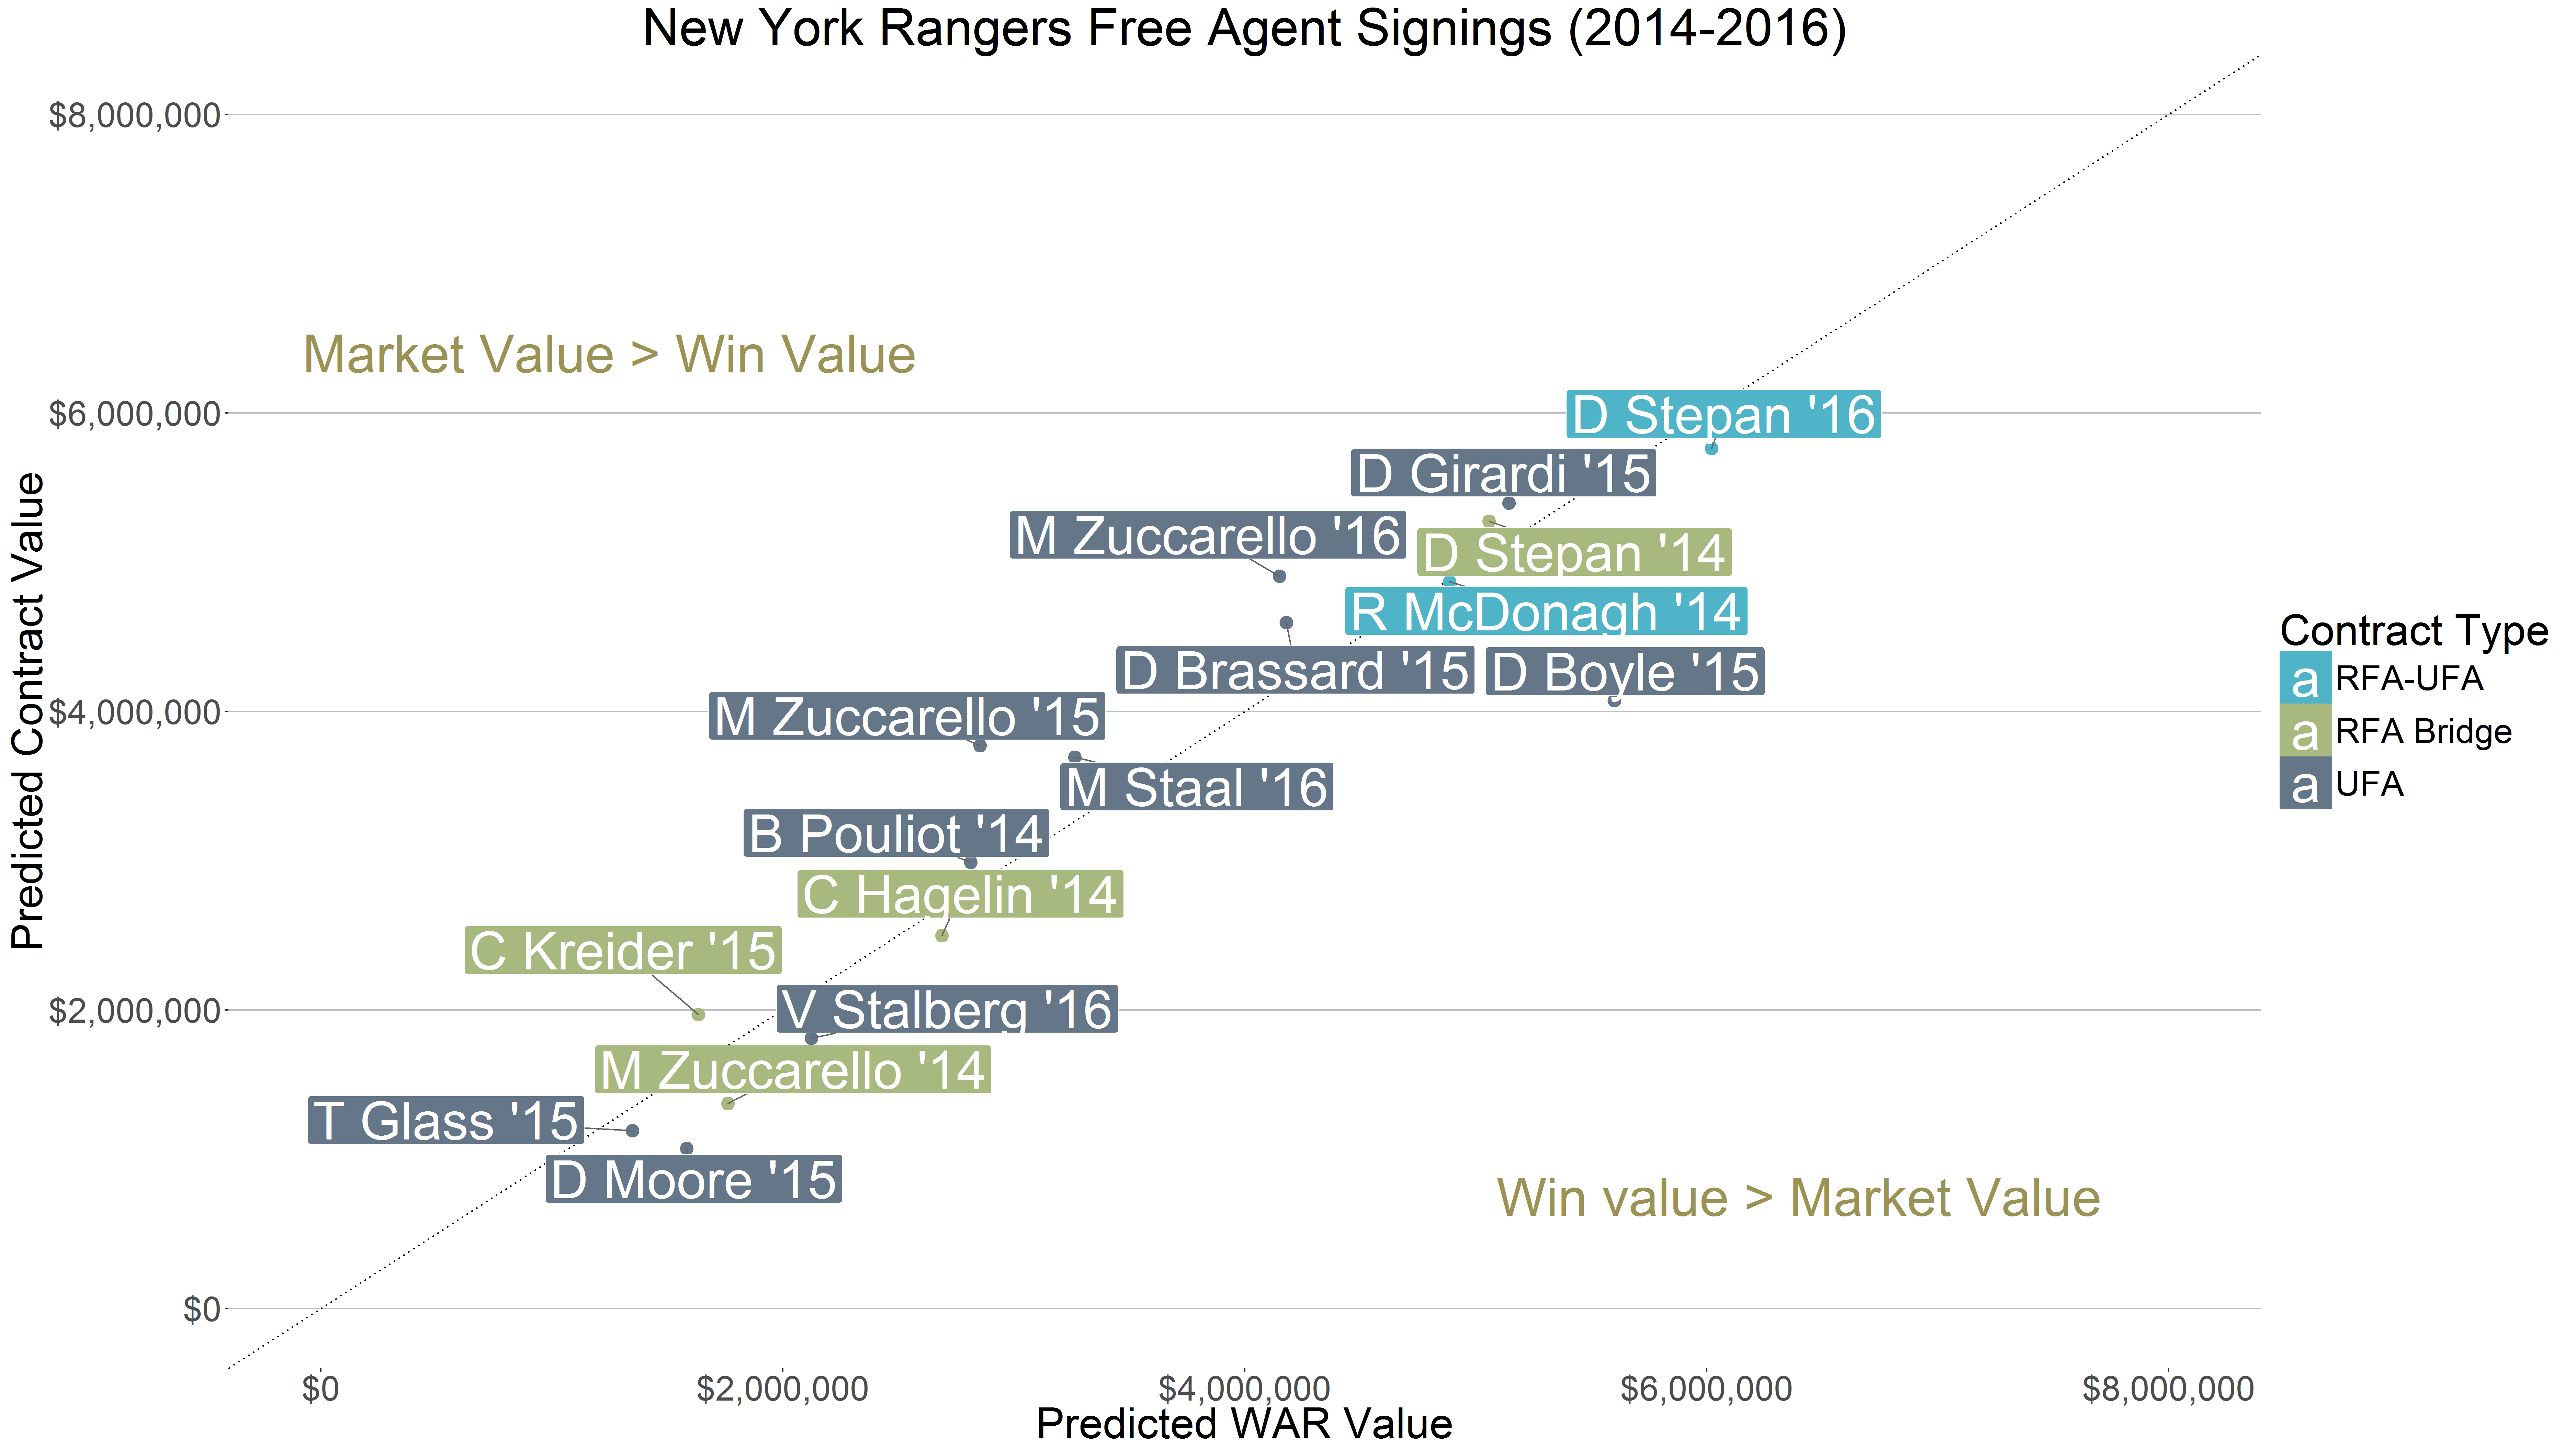
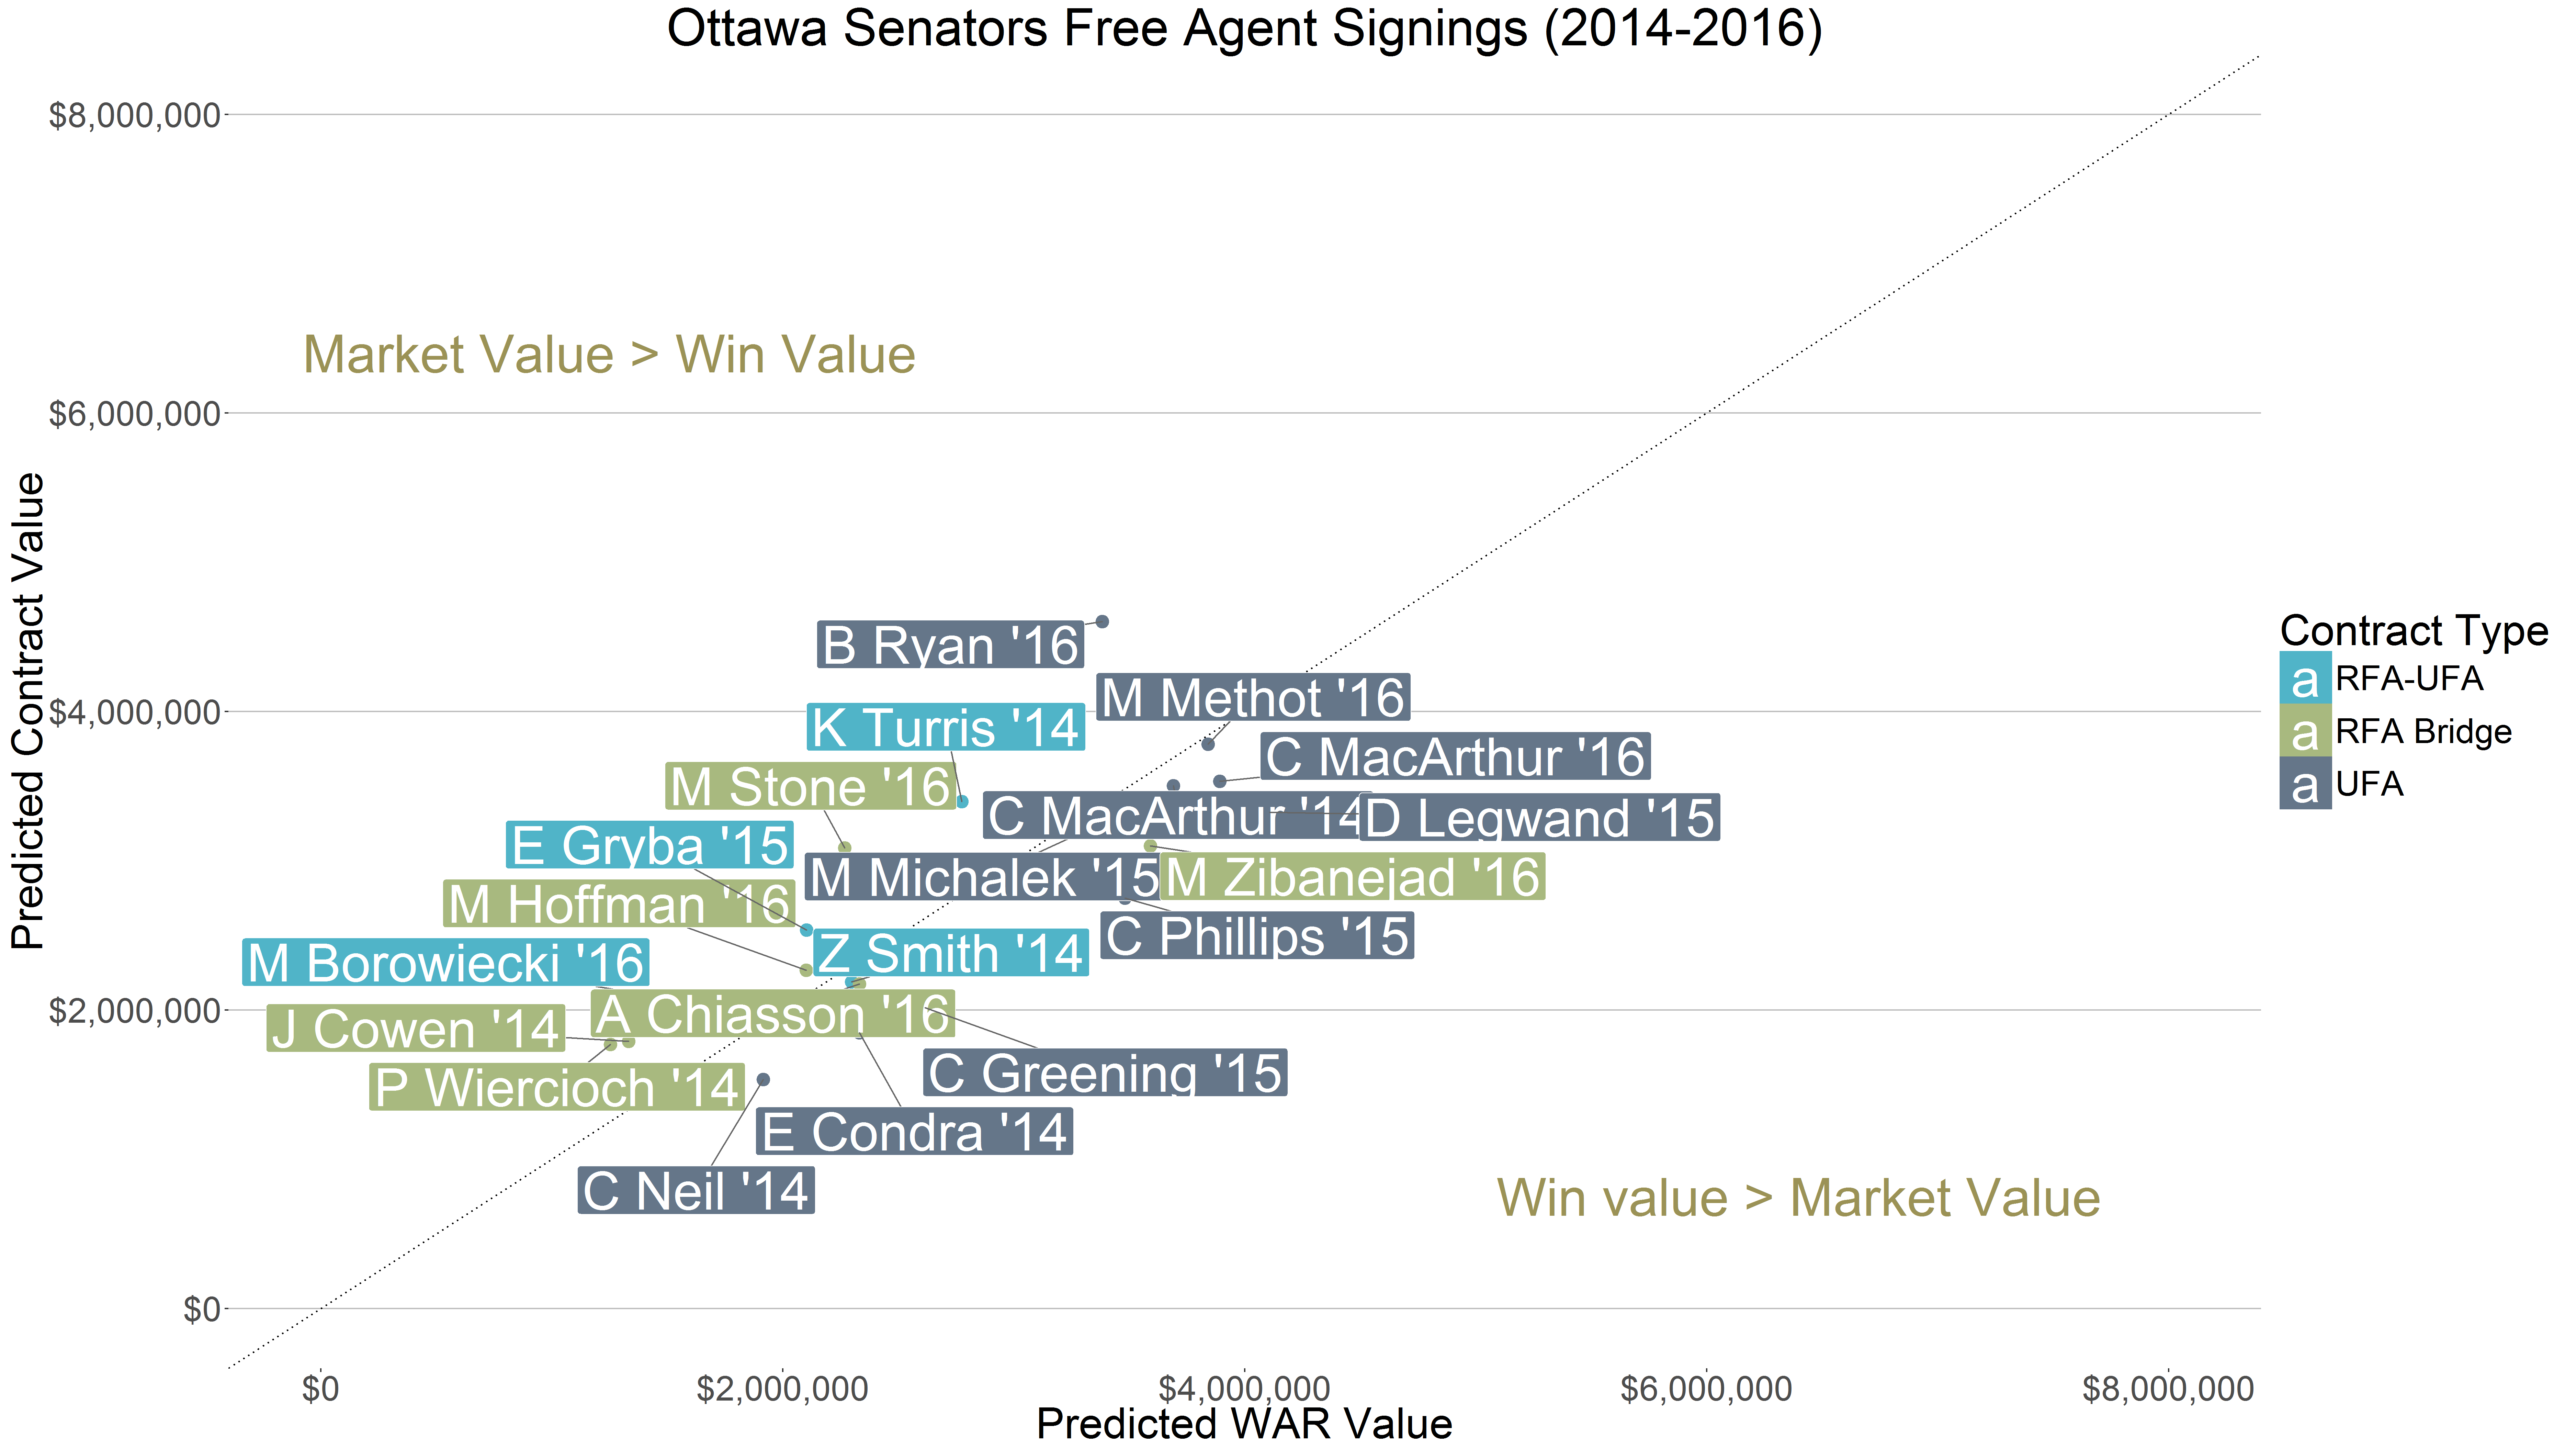
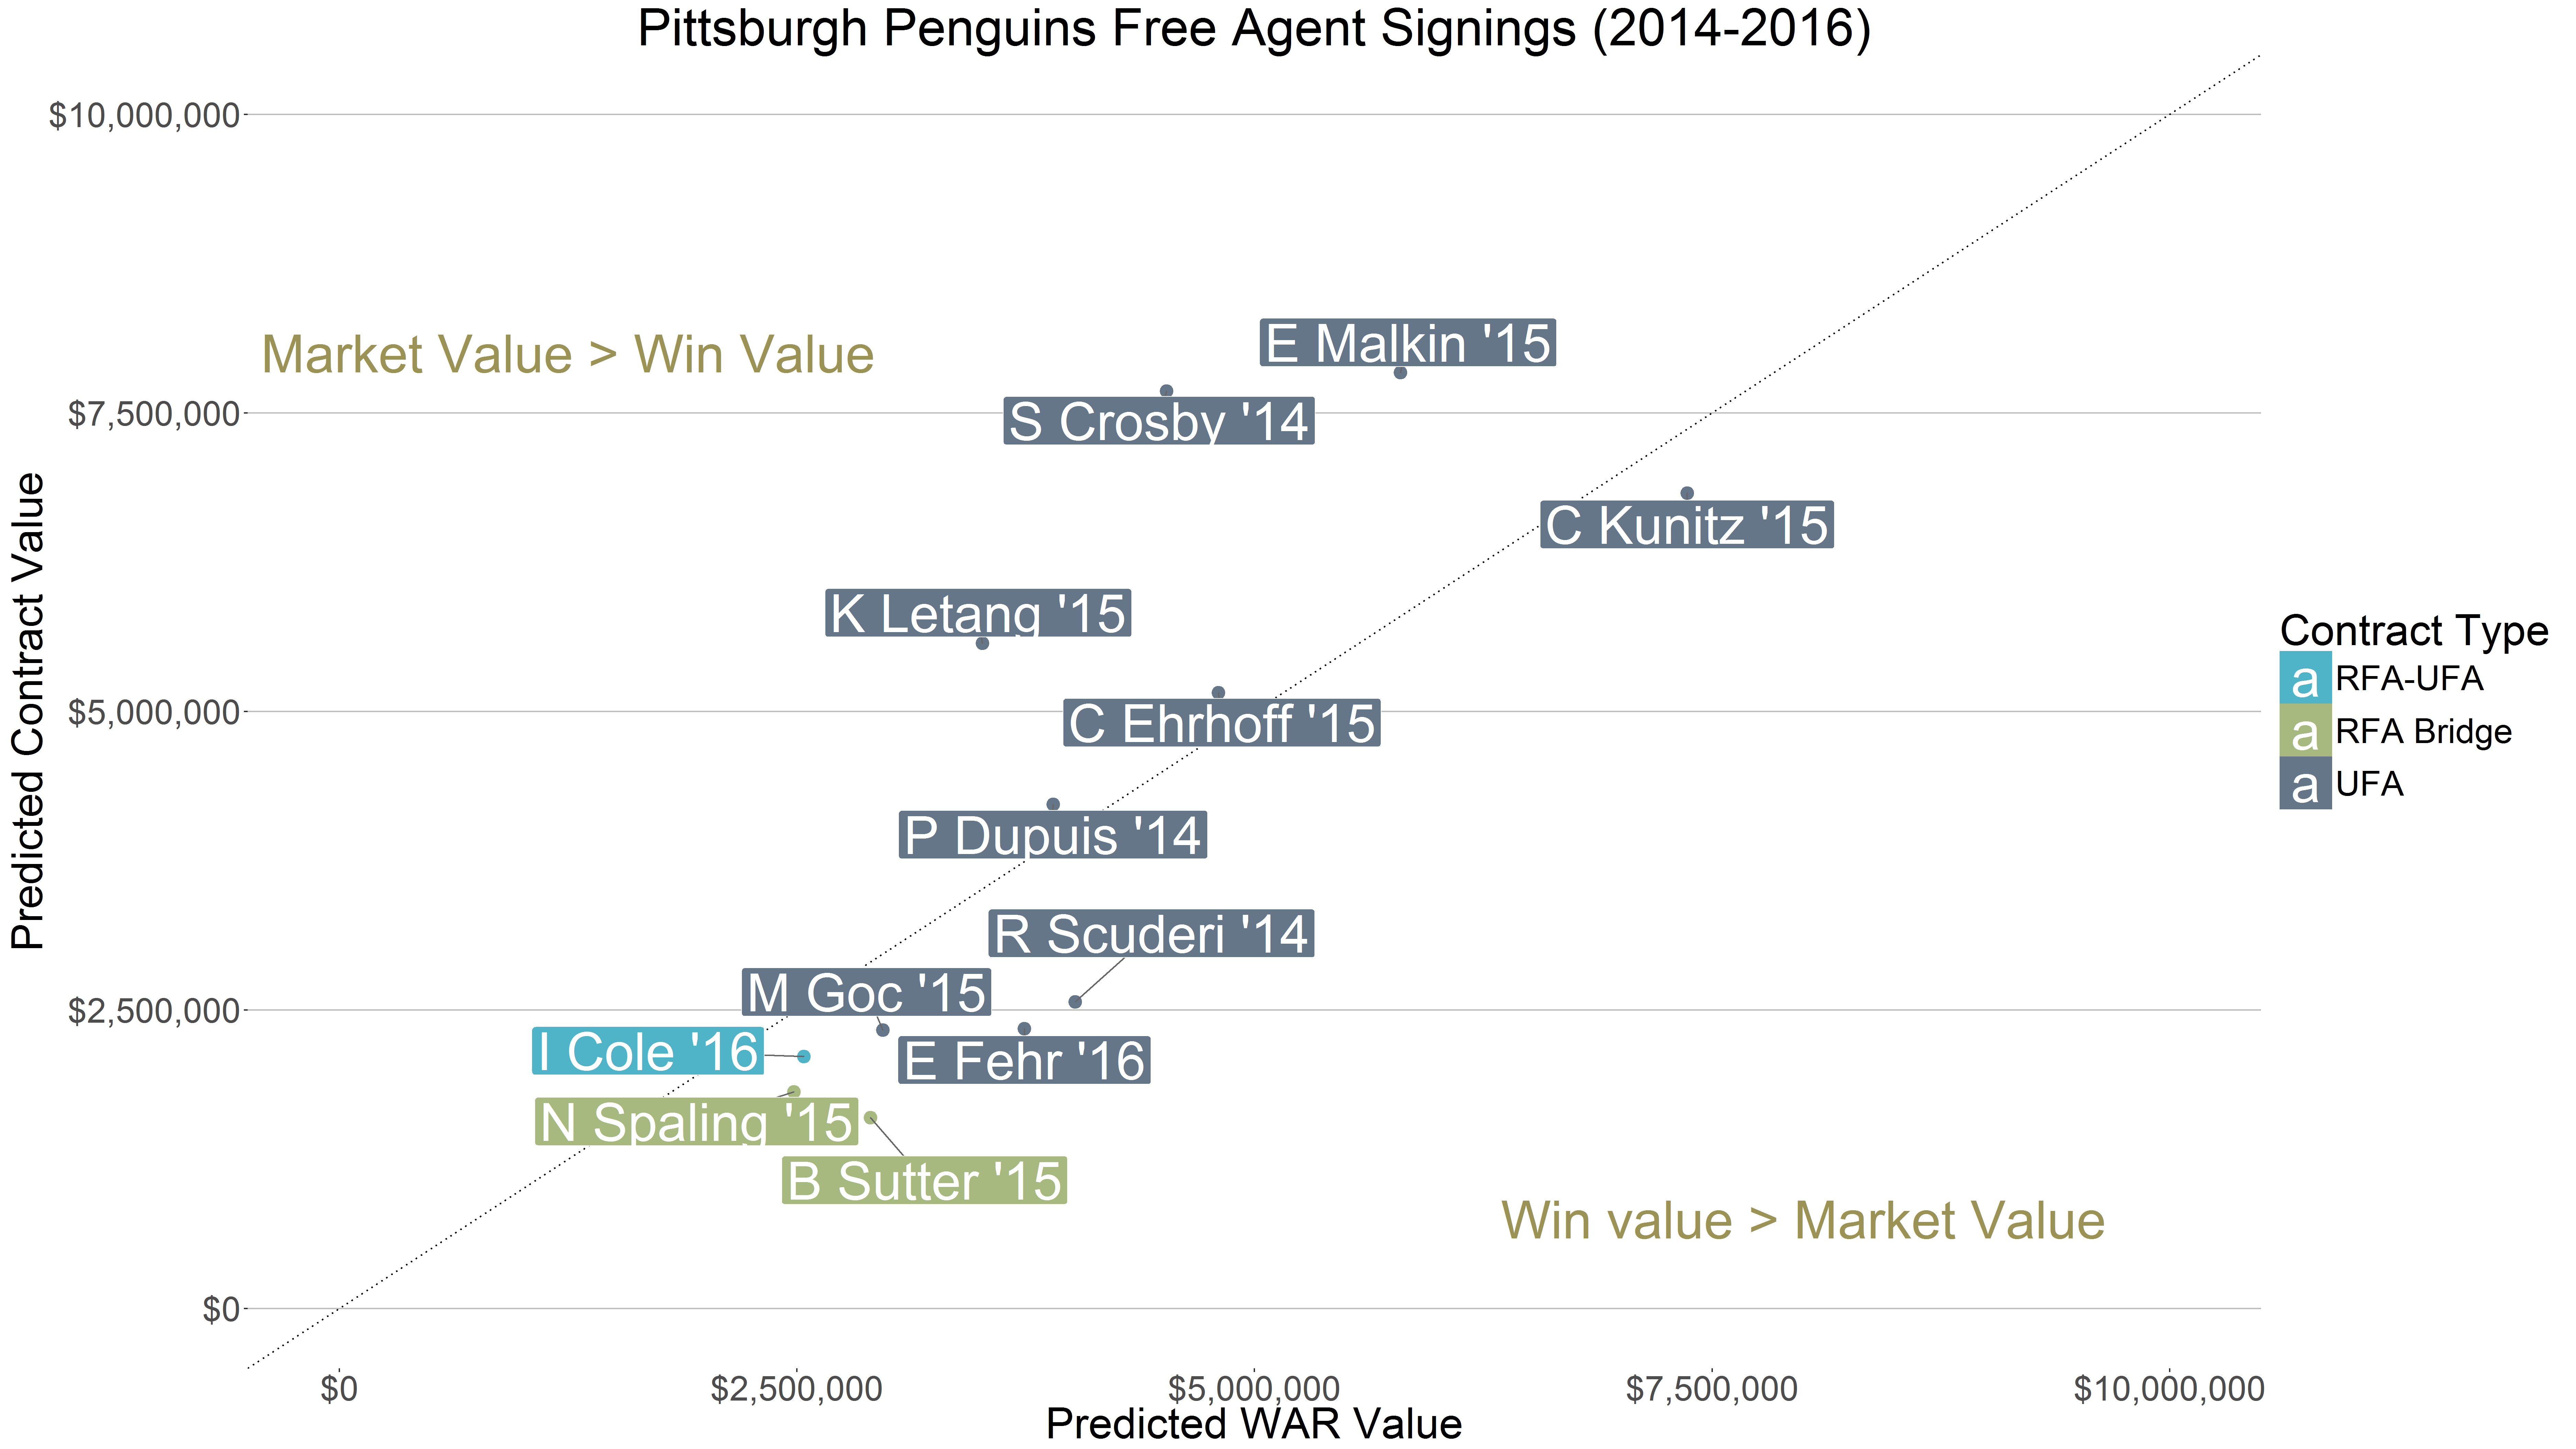
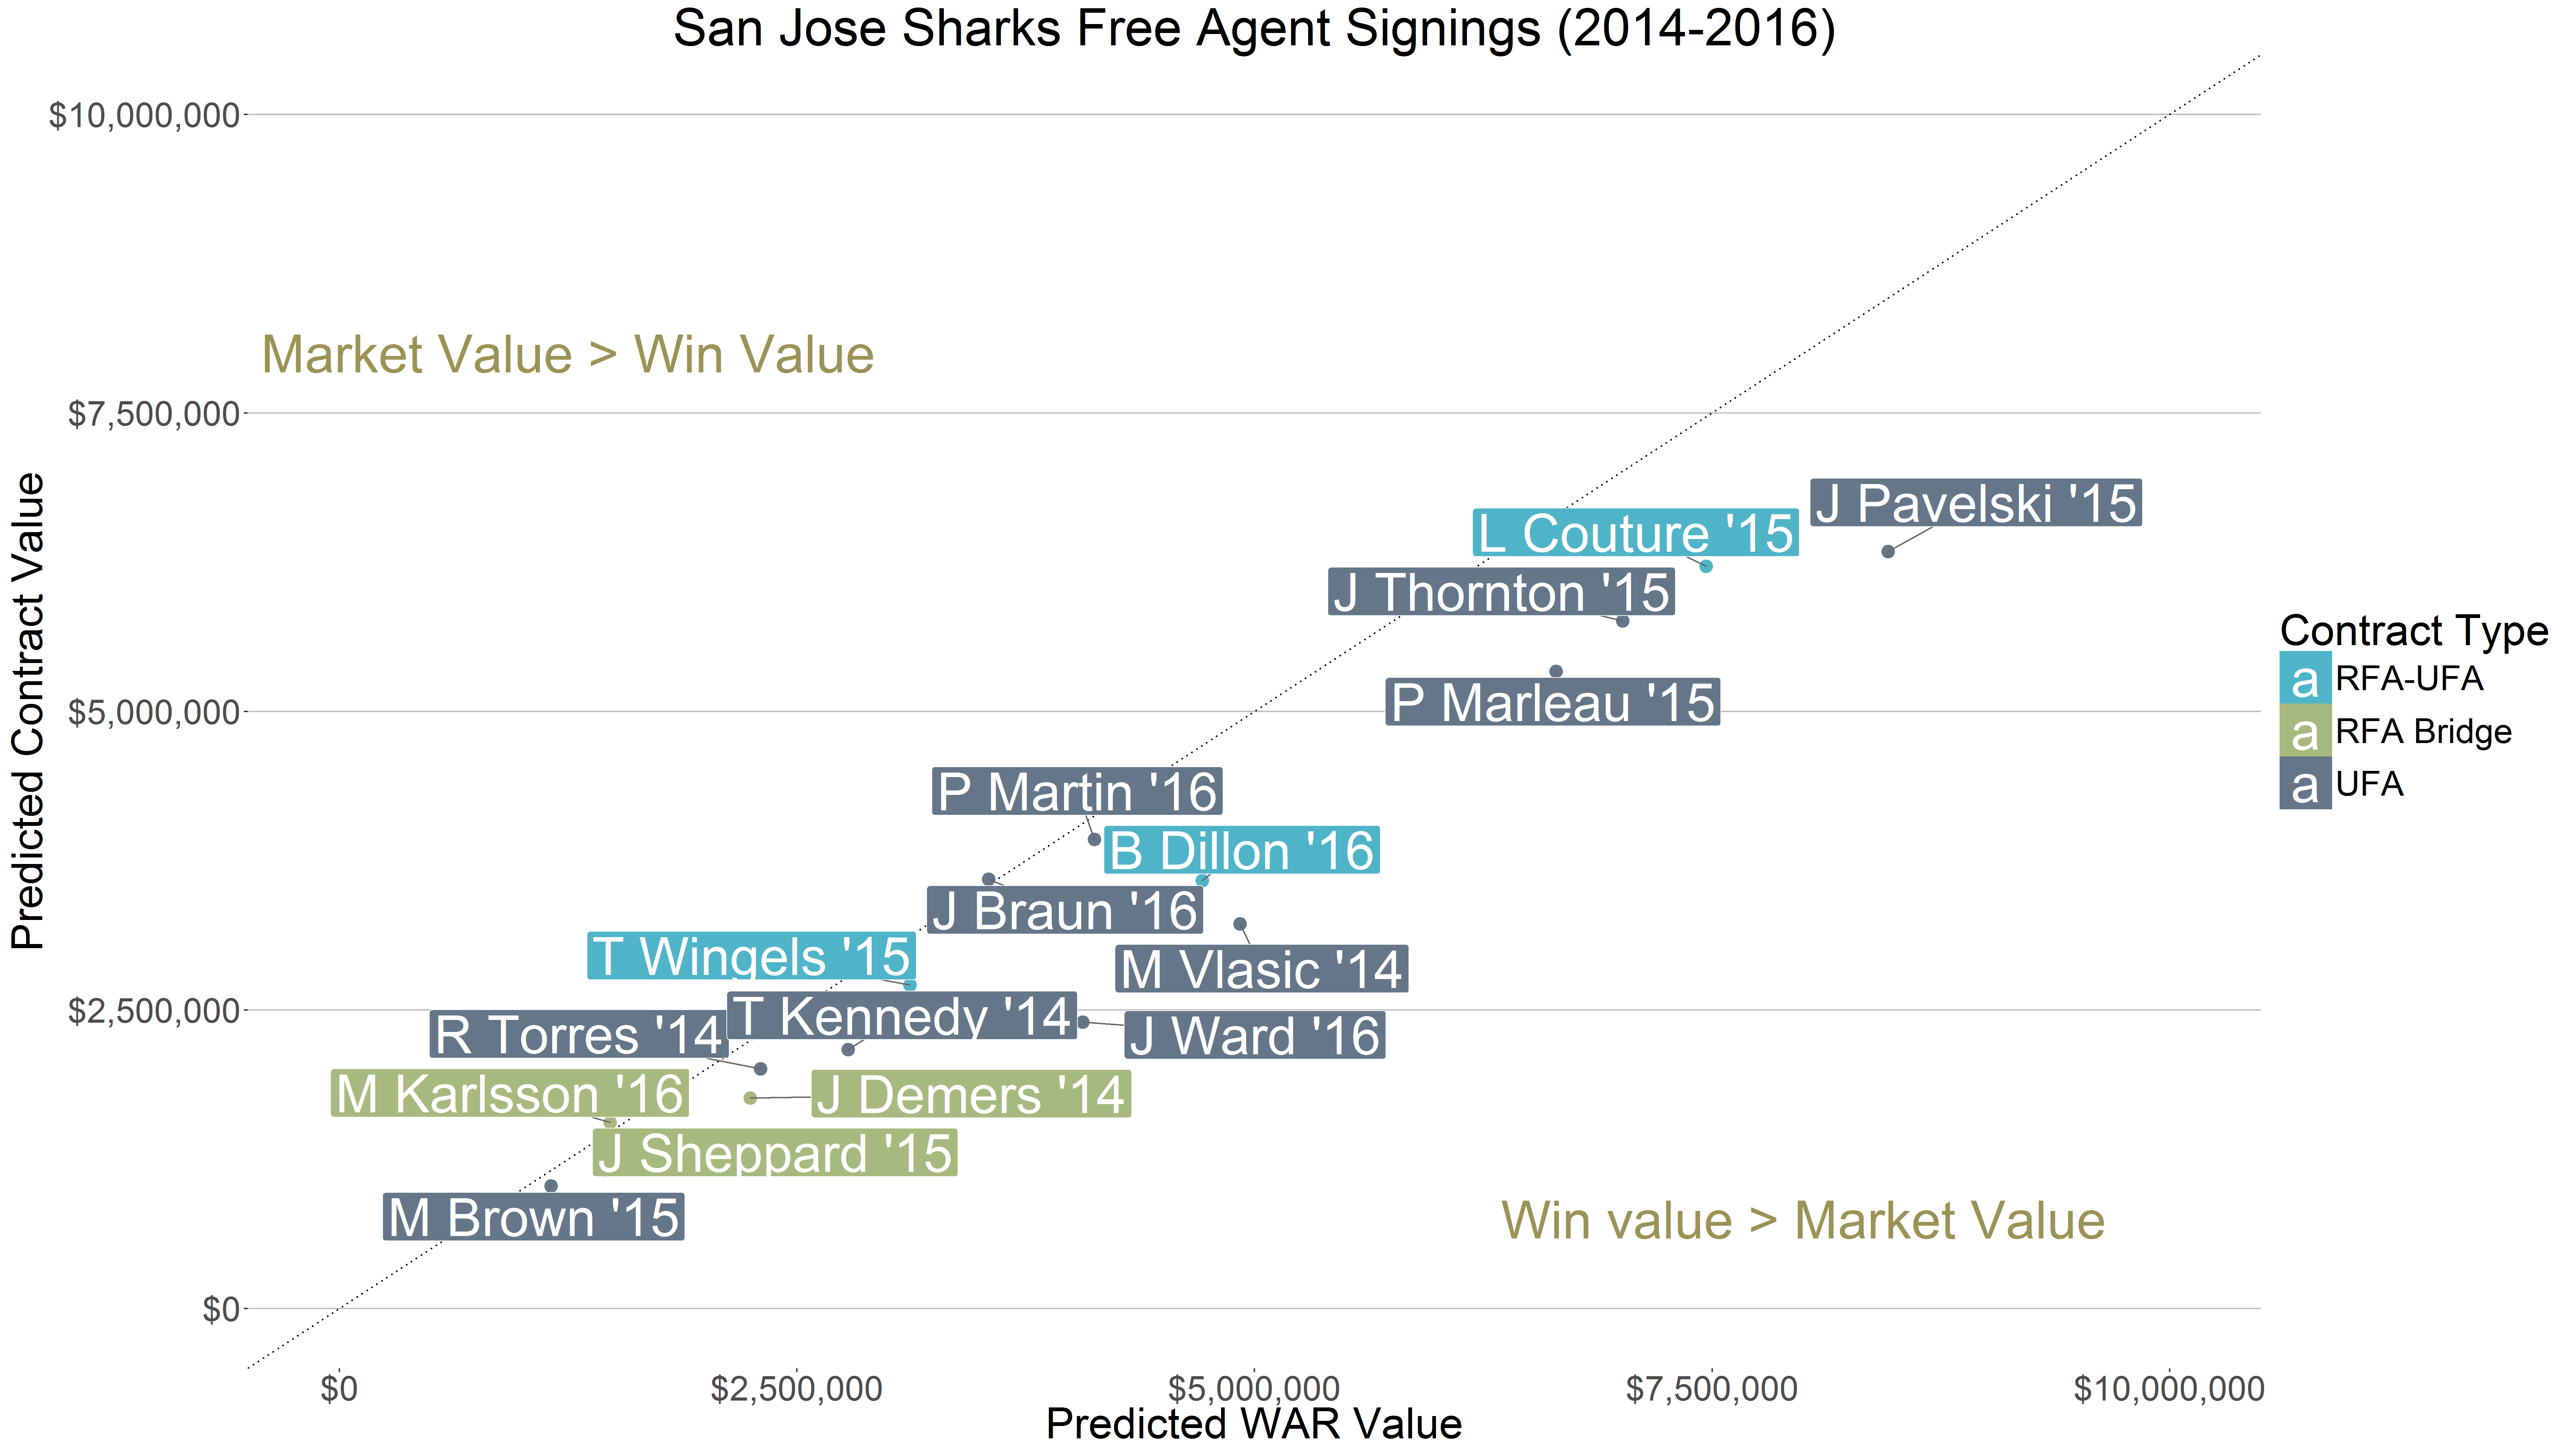
- Win Value vs. Market Price – identifies whether teams signed players who were undervalued or overvalued by the market as a whole.
If you find any errors in any of the charts, please let me know at @Cane_Matt or puckplusplus@gmail.com.
Anaheim Ducks – Market Price – Win Value – Win Value vs. Market Price
Arizona Coyotes – Market Price – Win Value – Win Value vs. Market Price
Boston Bruins – Market Price – Win Value – Win Value vs. Market Price
Buffalo Sabres – Market Price – Win Value – Win Value vs. Market Price
Carolina Hurricanes – Market Price – Win Value – Win Value vs. Market Price
Columbus Blue Jackets – Market Price – Win Value – Win Value vs. Market Price
Calgary Flames – Market Price – Win Value – Win Value vs. Market Price
Chicago Blackhawks – Market Price – Win Value – Win Value vs. Market Price
Colorado Avalanche – Market Price – Win Value – Win Value vs. Market Price
Dallas Stars – Market Price – Win Value – Win Value vs. Market Price
Detroit Red Wings – Market Price – Win Value – Win Value vs. Market Price
Edmonton Oilers – Market Price – Win Value – Win Value vs. Market Price
Florida Panthers – Market Price – Win Value – Win Value vs. Market Price
Los Angeles Kings – Market Price – Win Value – Win Value vs. Market Price
Minnesota Wild – Market Price – Win Value – Win Value vs. Market Price
Montreal Canadiens – Market Price – Win Value – Win Value vs. Market Price
New Jersey Devils – Market Price – Win Value – Win Value vs. Market Price
Nashville Predators – Market Price – Win Value – Win Value vs. Market Price
New York Islanders – Market Price – Win Value – Win Value vs. Market Price
New York Rangers – Market Price – Win Value – Win Value vs. Market Price
Ottawa Senators – Market Price – Win Value – Win Value vs. Market Price
Philadelphia Flyers – Market Price – Win Value – Win Value vs. Market Price
Pittsburgh Penguins – Market Price – Win Value – Win Value vs. Market Price
San Jose Sharks – Market Price – Win Value – Win Value vs. Market Price
St. Louis Blues – Market Price – Win Value – Win Value vs. Market Price
Tampa Bay Lightning – Market Price – Win Value – Win Value vs. Market Price
Toronto Maple Leafs – Market Price – Win Value – Win Value vs. Market Price
Vancouver Canucks – Market Price – Win Value – Win Value vs. Market Price
Winnipeg Jets – Market Price – Win Value – Win Value vs. Market Price
Washington Capitals – Market Price – Win Value – Win Value vs. Market Price
