
I had a discussion on twitter the other day about the relationship between shots against and save percentage. I wrote earlier about how on an individual game basis, save percentage tends to increase as the number of shots against increases. @pcunneen19 suggested that it was possible that the trend that I’d noticed was due to the fact that I’d looked at overall save percentage, rather than even strength save percentage, which tends to be a better indicator of future success in goaltending.
With that in mind, I went back and pulled the situational shot data from the Event Summaries for games from the 2008-2009 season to the 2011-2012 season. It’s not a perfect data set, as it doesn’t indicate who was in net in a given game, and there are some empty net goals included, but for our purposes it should be good enough.
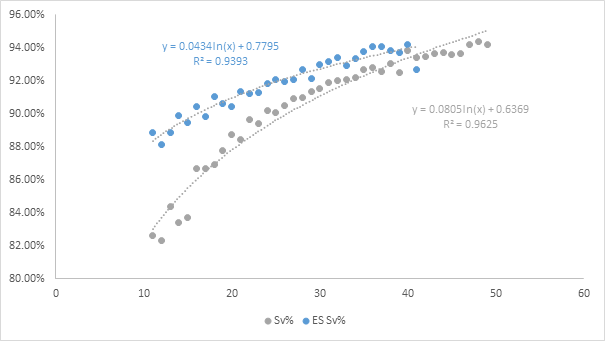
The graph above shows the aggregate save percentage grouped by the number of shots against (or even strength shots against) in a given game (where there was more than 1000 total shots against). As I’ve mentioned before, total Sv% tends to increase logarithmically as shots against increases, and we see a similar (albeit less pronounced) trend with ES Sv%. Based on the trendline above, jumping from 20 even strength shots per game to 25 produces an expected increase in even strength save percentage of 2%.
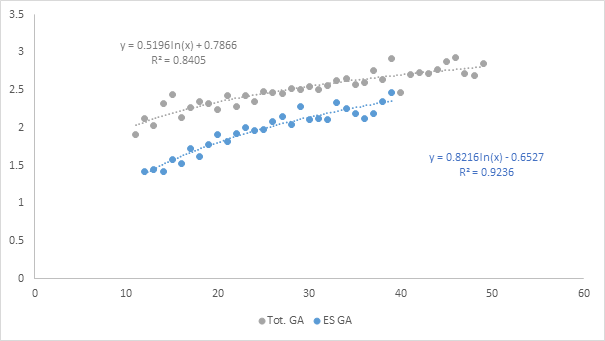
On a related note, if we look at expected even strength goals against, we also see a logarithmic trend, as we did with total shots against. Again, the ES data is just at the team level and not the goalie level, but it appears as if the trends that exist in the total shot data can also be seen in the event strength data.
I’m still evaluating to what degree this trend holds at the individual level for even strength shots. If we group total shots against into buckets of 5 and look at individual goaltender save percentages for each bucket (with a minimum of 10 GP), we do see that save percentage tends to increase as shots against goes up, although it’s not always absolutely true. I’ll try to put together a similar chart for ES Sv% to see if it appears to behave the same way as well.
| Goalie | 15-20 | 20-25 | 25-30 | 30-35 | 35-40 | 40-45 |
| ANDERSON, CRAIG | 89.31% | 90.72% | 92.40% | 92.91% | 93.96% | |
| AULD, ALEX | 88.36% | 89.70% | 90.48% | 92.15% | ||
| BACKSTROM, NIKLAS | 83.67% | 90.33% | 91.40% | 92.19% | 93.72% | 94.83% |
| BIRON, MARTIN | 91.67% | 89.99% | 92.09% | 92.30% | 92.55% | |
| BOBROVSKY, SERGEI | 89.62% | 90.75% | 93.65% | 93.69% | ||
| BOUCHER, BRIAN | 91.34% | 90.22% | 92.15% | 91.99% | ||
| BRODEUR, MARTIN | 87.66% | 90.90% | 91.34% | 92.67% | 93.09% | |
| BRYZGALOV, ILYA | 85.11% | 89.46% | 91.99% | 91.85% | 92.54% | 93.76% |
| BUDAJ, PETER | 87.63% | 87.83% | 90.32% | 91.23% | 91.88% | |
| CLEMMENSEN, SCOTT | 89.33% | 88.31% | 90.99% | 90.18% | 92.91% | 94.37% |
| CONKLIN, TY | 88.08% | 91.42% | 90.08% | 94.25% | ||
| CRAWFORD, COREY | 87.67% | 90.48% | 91.10% | 93.32% | 92.20% | |
| DUBNYK, DEVAN | 89.75% | 89.13% | 91.41% | 93.30% | 94.15% | |
| ELLIOTT, BRIAN | 86.75% | 90.18% | 91.18% | 91.83% | 93.04% | |
| ELLIS, DAN | 87.18% | 90.13% | 89.99% | 91.80% | 93.56% | 94.59% |
| EMERY, RAY | 88.03% | 91.91% | 89.78% | 91.61% | 91.08% | |
| FLEURY, MARC-ANDRE | 87.82% | 90.00% | 91.56% | 92.28% | 93.53% | |
| GARON, MATHIEU | 86.22% | 88.86% | 90.90% | 91.07% | 92.61% | |
| GIGUERE, JEAN-SEBASTIEN | 89.32% | 90.91% | 90.32% | 91.74% | 93.15% | |
| GUSTAVSSON, JONAS | 90.50% | 90.13% | 90.63% | 91.03% | ||
| HALAK, JAROSLAV | 88.07% | 90.63% | 91.06% | 92.63% | 92.41% | |
| HARDING, JOSH | 90.97% | 90.42% | 88.85% | 93.73% | ||
| HEDBERG, JOHAN | 87.36% | 89.18% | 89.57% | 92.07% | 91.67% | |
| HILLER, JONAS | 87.58% | 89.40% | 90.80% | 92.77% | 93.04% | 93.50% |
| HOWARD, JIMMY | 88.55% | 90.61% | 91.35% | 93.03% | 92.20% | |
| HUET, CRISTOBAL | 88.50% | 90.83% | 90.75% | 91.99% | ||
| KHABIBULIN, NIKOLAI | 86.83% | 87.50% | 90.99% | 90.76% | 93.00% | |
| KIPRUSOFF, MIIKKA | 86.62% | 88.26% | 91.06% | 91.66% | 93.21% | 94.30% |
| LABARBERA, JASON | 88.99% | 90.42% | 89.16% | 92.57% | 91.38% | |
| LECLAIRE, PASCAL | 89.55% | 90.32% | 91.92% | 90.55% | ||
| LEHTONEN, KARI | 89.47% | 90.80% | 91.31% | 92.90% | 93.21% | |
| LUNDQVIST, HENRIK | 86.68% | 90.18% | 92.57% | 92.59% | 93.55% | 95.47% |
| LUONGO, ROBERTO | 85.65% | 90.03% | 91.56% | 93.27% | 93.12% | 94.18% |
| MACDONALD, JOEY | 88.95% | 89.18% | 91.19% | 90.00% | ||
| MASON, CHRIS | 81.78% | 90.19% | 90.80% | 92.19% | 92.39% | |
| MASON, STEVE | 85.71% | 88.59% | 88.79% | 91.76% | 91.91% | 93.27% |
| MILLER, RYAN | 86.69% | 88.59% | 91.58% | 91.77% | 93.45% | 93.97% |
| NABOKOV, EVGENI | 86.44% | 89.24% | 90.72% | 93.05% | 93.42% | |
| NEUVIRTH, MICHAL | 90.78% | 90.31% | 91.87% | 92.36% | ||
| NIEMI, ANTTI | 89.42% | 91.21% | 91.98% | 92.64% | 92.13% | |
| NIITTYMAKI, ANTERO | 87.72% | 90.93% | 90.77% | 93.41% | ||
| OSGOOD, CHRIS | 86.06% | 90.07% | 89.05% | 92.07% | ||
| PAVELEC, ONDREJ | 85.64% | 91.39% | 91.79% | 91.00% | 92.43% | |
| PRICE, CAREY | 89.06% | 88.43% | 91.04% | 92.12% | 92.73% | 93.18% |
| QUICK, JONATHAN | 88.01% | 90.36% | 91.77% | 92.13% | 92.91% | |
| RASK, TUUKKA | 91.61% | 91.77% | 92.46% | 94.01% | ||
| RAYCROFT, ANDREW | 88.70% | 87.00% | 90.24% | 92.89% | ||
| REIMER, JAMES | 90.75% | 92.39% | 92.59% | 92.36% | ||
| RINNE, PEKKA | 90.20% | 89.47% | 90.69% | 93.47% | 93.73% | 95.27% |
| ROLOSON, DWAYNE | 87.07% | 90.15% | 90.92% | 92.92% | 92.59% | |
| SCHNEIDER, CORY | 92.59% | 91.21% | 93.60% | 93.54% | ||
| SMITH, MIKE | 86.67% | 88.68% | 90.98% | 92.26% | 92.21% | 95.53% |
| THEODORE, JOSE | 83.46% | 89.27% | 91.66% | 91.31% | 91.45% | 93.60% |
| THOMAS, TIM | 86.28% | 89.03% | 92.60% | 93.18% | 93.42% | 95.18% |
| TOSKALA, VESA | 87.63% | 89.26% | 91.53% | 91.54% | ||
| TURCO, MARTY | 86.28% | 88.00% | 90.88% | 91.79% | 92.16% | 93.13% |
| VARLAMOV, SEMYON | 87.73% | 90.46% | 92.47% | 92.72% | ||
| VOKOUN, TOMAS | 87.45% | 89.75% | 90.98% | 92.22% | 93.66% | 93.77% |
| WARD, CAM | 87.46% | 88.58% | 90.43% | 91.34% | 93.63% | 94.49% |
I’m not trying to make the argument that goalies who face more shots against will necessarily have a higher save percentage, but rather that in smaller sample sizes an individual goalie’s save percentage could be skewed by the number of shots he faces. Over the long run this should even itself out for most goalies, but it is something to be wary of when using save percentage to evaluate goaltenders.

[…] Matt Cane at Puck-Plus-Plus […]