
We’re now three days into free agency and with most of the marquee names on the market already signed on for the coming year and beyond, teams and fans alike are starting to look over their rosters trying to figure out whether they’re sitting in a better position than they were on June 30th. With some teams the improvement is fairly obvious: after finishing 8th in the West last year the Dallas Stars have added Jason Spezza and Ales Hemsky and looked poised to take a run at the Blues and Blackhawks for Central Division supremacy. The Anaheim Ducks also made a big splash, bringing in Ryan Kesler from the Canucks while only sacrificing Nick Bonino and Lucas Sbisa. Having added a big name to take some of the pressure off of Ryan Getlaf, should we expect a similar bump to elevate the Ducks to President’s Trophy champions next year?
This type of situation comes up frequently not just in the NHL but across professional sports: fringe team adds a few key pieces and turns into championship contenders, while a team that finished the previous year on the edge of winning it all can’t turn their added potential into dominance. Ultimately, what this comes down to is that the value of a given player isn’t the same to each team: adding on additional goals (or allowing fewer goals, depending on which way you look at it), has different effects on a team’s record depending on how good they were before. Adding Brad Richards to the Blackhawks isn’t the same as adding Brad Richards to the Blue Jackets would be. To put it another way, the value of a marginal goal decreases as a team’s goal differential increases (and in a non-linear manner, as we’ll see later).
To illustrate this point, I put together a quick simulation to look at how the value of an extra goal varies based on team strength. I began by generating 82 games, picking a random number of goals for and against between 0 and 5. I assumed that we were only looking at regulation play, and so allowed the game to finish tied in this case (while this isn’t perfect, practically it shouldn’t make much difference). I totalled up the initial goal differential across the 82 games, and then chose one of the 82 games to randomly add a goal to. If the game had initially finished in a tie, or with our simulated team down by 1 goal, I added one point on to their overall point total. Then, I repeated this process 50,000,000 times and counted how many times a team got an extra point by adding an additional goal. If we take that number and divide it by the total number of times we added an extra goal, we can figure out the marginal value of an added goal for a team with a given goal differential.
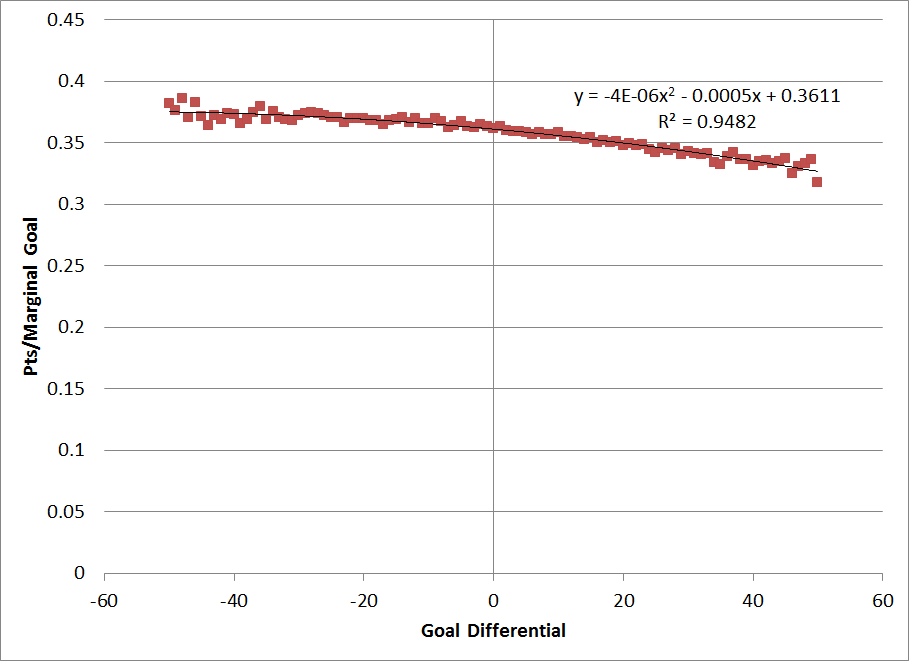
Pts. Per Marginal Goal
As we’d assume, what we see is that the number of additional points we expect a team to earn for adding an extra goal decreases as our imaginary team’s goal differential increases, and the relationship isn’t linear. A team that is sitting on a +20 goal differential gets less benefit from adding one additional goal than a team with a -20 goal differential. From a practical perspective, this means that it’s a lot easier for a bad team to improve than it is for a good team.
What’s interesting to note though is that the graph doesn’t actually peak at 0 as you might expect. While a team with just as many goals for and against might expect to each 0.36 additional points from adding one more goal, a team with a -50 goal differential will get about 0.37 additional points. On the other hand, a team with a +50 goal differential is only going to earn approximately 0.32 additional points from scoring once more over the course of a season. This might explain why teams are able to go from the bottom of the league to near the playoff cut-off so quickly while the teams that dominate are often a lot harder to knock of their perch.
Another way to look at this is by considering how many goals you need to add one extra win. While we commonly use a constant goals per win number when discussing player value in the analytics community (usually about 6), looking at the data above we know we shouldn’t expect the number of goals per win to be the same for each team. If we take the inverse of each number above and multiply it by 2, we can translate our marginal goal value into the number of goals needed to add one additional win (or 2 standings points in this case) for different team strengths.
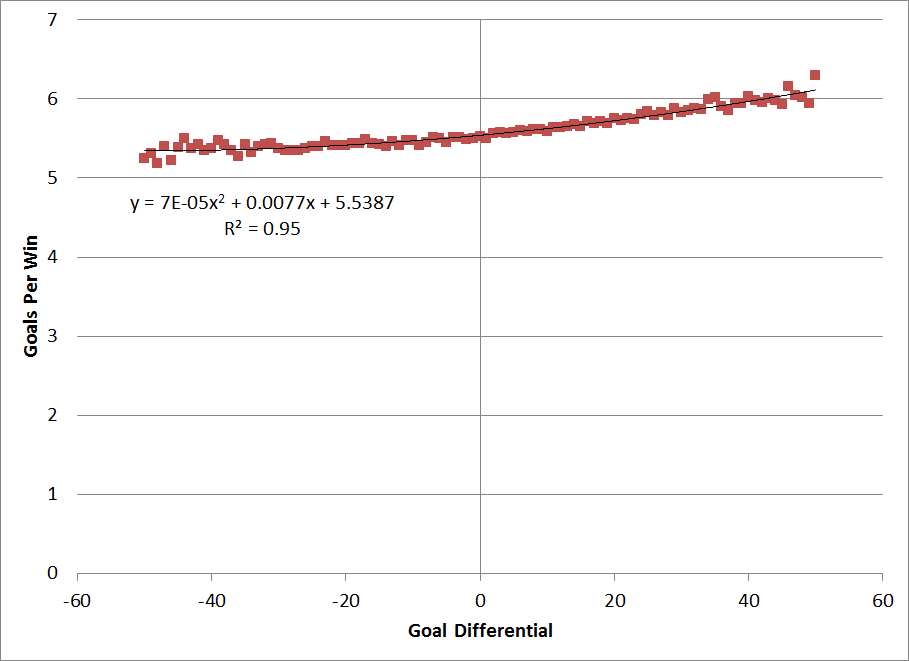
Goals Per Win
Looking at it this way makes things slightly more obvious: a team with a -50 goal differential needs to bring on 5.3 additional goals to increase their win total by 1, while a team with a positive 50 goal differential needs to add over 6 goals to achieve the same result.
One thing to keep in mind here is that the values in both graphs above will change depending on the goal scoring environment. While in our model we assumed that each team had an equal chance of scoring and allowing anywhere between 0 and 5 goals, in reality the probabilities are different and while the results should generally look the same, the fitted curves that we generate will be different.
Nevertheless, the implications for teams shopping the free agent market should be obvious: while it might make sense for a team struggling at the edge of the playoff picture to look for one or two big pieces to propel them forward, for a team at the top it’s a lot more difficult to improve their place in the standings by spending money. This is of course complicated by the fact that it’s harder to find pieces to replace on a good team: even if you can go out and add a top line player forward, the player whose minutes they’ll be taking is likely to have been a useful player already. All of which is to say that it’s not all that surprising that teams often fail to strike gold and establish dominance through free agency: it’s not that they’re not getting better, it’s just that the numbers are often stacked against them from the start.

Leave a comment