
The 2013-2014 season was a painful one for Ottawa Senators fans. After reaching the playoffs in both of the previous two seasons, many analysts predicted that the Sens were on the verge of breaking through into the league’s elite. Instead, the Sens struggled to string wins together, and finished the year 11th in the Eastern conference in spite of posting a 52.4% 5v5 Corsi percentage, a number that had them 7th in the league.
One major reason that the Sens failed to capitalize on their relatively strong possession numbers is that their Corsi advantage failed to translate into recording more shots than their opponents. Much of this had to do with the fact that the Sens blocked shots at a rate that was significantly lower than the rest of the league. While the league average block rate was 25.6% (total blocks/total Corsi attempts against), the Sens only got in the way of 20.5% of the shot attempts directed towards their net. And while some of this may be bad luck, we do know that blocked shots show a reasonably strong repeatability at the team level. Moreover, there’s ample evidence to suggest that this reluctance to block shots was an intentional decision on coach Paul Maclean’s part.
Now there’s definitely an argument to be made that attempting to block shots can be a risky proposition. You may end up screening the goalie or deflecting the puck on your own net, both of which increase the odds that your goalie isn’t going to stop it. Letting the goalie see the puck and staying out of the way is a mantra that’s oft repeated, in particular by a certain Saturday night first intermission hockey host. But there are obvious benefits to blocking a shot too: a successful shot block has a 0.00% chance of going in.
The question then is, how successful do we need to be when blocking shots to make up for the increased risk of a screened or deflected shot. If we consider only two possible outcomes, a successful block that prevents a Fenwick attempt, or a failed attempt that results in either a miss (we’re not worried) or a shot on goal with an increased probability of going in, then we can calculate the rate that we need to be successful at in order to make the attempt worthwhile.
So what do we need to know to figure out what this breakeven rate is? First, we need two stats that are relatively easy to calculate: 1) the league average shooting percentage on non-rebounds, which we’ll call lgSh%; and 2) the league average percentage of Fenwick attempts that hit the net (P(SF | FF) = 1 – lgMS%).
We also need to know the rate at which letting the shot go through will result in a rebound, and the rate at which this rebound ends up in the back of the net (we’ll ignore the rate at which a rebound generates another rebound which generates another rebound, etc.). Let’s refer to the rate at which a save results in a rebound as P(Reb) and the shooting percentage on rebounds as RebSh%.
Next, we need to know the rate at which a successful blocked shot results in a goal anyways. This is essentially like a blocked shot rebound, think of a puck bouncing of a defender’s shinpad directly to a wide open winger on the other side of the net, and we’ll denote it by P(G | BS). This we can also calculate easily as well using the NHL’s standard shot data.
The last item we need is the shooting percentage on failed blocks, or FBSh% (I promise never to reuse these terrible acronyms after this article). This is a bit trickier since we can’t pull this from any of the data we currently have available (paging, SportVu). What we can do though is estimate the breakeven point as a function of the FBSh%, and thus calculate the breakeven rate based on whatever our individual estimates are. We’d expect the FBSh% to be higher than the regular lgSh% but how much higher it is in real life we can’t say.
With these items we can now figure out the rate at which we need to be successful in blocking goals to make up for the increased risk of a failed block or a successful block that results in a goal anyways.
Our equation for the break even blocked shot rate, BEBS% is:
BEBS% * P(G | BS) + (1-BEBS%) * FBSh% = lgSh% * P(SF | FF) + (1-lgSh%) * P(Reb) * RebSh%
BEBS% * (P(G | BS) – FBSh%) = lgSh% * P(SF | FF) + (1-lgSh%) * P(Reb) * RebSh% – FBSh%
BEBS% = (lgSh% * P(SF | FF) + (1-lgSh%) * P(Reb) * RebSh% – FBSh%) / (P(G | BS) – FBSh%)
When we sub in our known parameters (lgSh% = 9.54%, P(SF | FF) = 72%, P(G | BS) = 0.54%, P(Reb) = 5.4%, RebSh% = 23.7%), this simplifies to:
BEBS% = (9.54% * 72% + (1 – 9.54%) * 5.43% * 23.7% – FBSh%) / (0.54% – FBSh%)
We can then plot the breakeven blocked shot success rate as a function of the shooting percentage on failed blocks to get a sense of how good we need to be at blocking shots given a certain risk level.
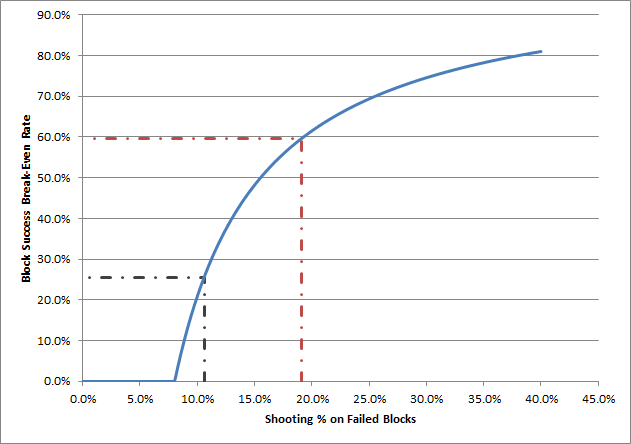
Break-Even Blocked Shot Success Rate as a function of Failed Block Shooting Percentage
In the chart above, the blue line represents the breakeven blocked shot success rate. What that means is that if our actual success rate is above the line, we should be trying to block the shot, while if our actual success rate is below the line, we’re better off letting the shot go through with full visibility and no risk of a deflection.
Obviously, if players shoot worse on a failed block than on a clean shot we should try to block every shot we can, which is why the breakeven rate is 0 for most of the range below the league average rate. You’ll also probably notice that the breakeven rate becomes non-zero below the league average rate-this is due to the adjustment for shots that miss the net (after all if we let a shot go through without attempting to block it there’s no guarantee it’ll hit the net).
I’ve added dotted lines to illustrate two points that I think are interesting. The first dotted line, the black line, represents the lower bound for our blocked shot rate. We can estimate the lower bound by setting average league-wide block success rate equal to the average league-wide block rate (blocks/Corsi attempts), which is 25.6%. This represents the “worst-case” in a sense, as it assumes that teams attempt to block every shot attempt thrown towards their net (which we know isn’t true). If we did actually attempt to block all shots, the shooting percentage on blocked shots would need to be 10.6% or higher to make shot blocking a bad proposition for us (this is of course an impossible hypothetical given that in this case the Shooting % on failed blocks would be equal to the league shooting percentage, but we can just ignore that for the sake of our argument).
The other dotted line, coloured in red, represents the point at which failed blocks go in at twice the normal rate (19.1%). At this level, which is quite a high shooting percentage, we only need to be successful in blocking a shot 59.6% of the time, or roughly 6 in 10 times. While I don’t have data on how frequently shot blocks succeed, 59.6% strikes me as an achievable rate for most NHL caliber players. Remember, we’re looking at the success rate when they do attempt to block it, so we have to assume that most NHLers exercise proper judgement and don’t slide halfway across the rink to block a shot. A shooting percentage of 19.1% is actually closer to the shooting percentage on rebounds last year (23.6%) than it is to the league average, which also seems off to me. If we assume that the actual shooting % on failed blocks is halfway between the league average shooting rate on non-rebounds, and the rebound shooting percentage, we only need to be successful 53.6% of the time to make a block attempt worthwhile. Again, I don’t have the data, but this seems like a reasonable trade-off to me, and it certainly isn’t compelling evidence to avoid shot blocking in general.
While it’s hard to know what the true shooting percentage is on a failed block, it seems reasonable to infer that the cost of allowing a shot on goal is almost certainly greater and that you’d have to be a a pretty bad shot blocker to make it worthwhile to not attempt a block. It’s important to note that while we looked at the odds that a blocked shot results in a goal immediately following the block, we didn’t take into account that by attempting a shot block the odds of the shooter missing the net may increase, which would decrease the breakeven success rate and provide further proof that letting opponents shoot away isn’t an optimal strategy.
The Sens had many defensive problems last year, but their inability or unwillingness to block shots almost certainly added to their woes. If they’d merely blocked shots at a league average rate they’d have allowed about 10.6 fewer goals, which would have translated into approximately 3.5 more points in the standings. For a team that finished only 5 points out of a playoff spot (and didn’t have their first round pick to fall back on) that’s an especially painful reality to deal with, and one that will hopefully be remedied in the upcoming year.

Leave a comment