
Over my last few posts I’ve been looking into the idea of game level goaltending performances and adjusting goalie evaluation metrics to account for the number of shots against a goalie faces. One of the issues I have with Save Percentage as a method of evaluating goaltenders is that it has the potential to overstate the value of goaltenders who tend to face a lot of shots, or understate the value of a performance when a goalie faces few shots.
To give an example, let’s look at 10 hypothetical games for 2 (obviously hypothetical) goalies, which I’ve set up in the table below. Over the 10 games, each goalie faced the same number of shots and let in the same number of goals (i.e. identical save percentages) but did so in different ways. Goalie A was consistent throughout all the games, while Goalie B performed very well in 3 games, decently enough in four, and very poorly in 3 other games.
|
Goalie A |
Goalie B |
||||
| Shots | Saves | Game Sv% | Shots | Saves | Game Sv% |
| 30 | 28 | 93.3% | 60 | 59 | 98.3% |
| 30 | 28 | 93.3% | 60 | 59 | 98.3% |
| 30 | 28 | 93.3% | 40 | 39 | 97.5% |
| 30 | 28 | 93.3% | 20 | 18 | 90.0% |
| 30 | 28 | 93.3% | 20 | 18 | 90.0% |
| 30 | 28 | 93.3% | 20 | 18 | 90.0% |
| 30 | 28 | 93.3% | 20 | 18 | 90.0% |
| 30 | 28 | 93.3% | 20 | 17 | 85.0% |
| 30 | 28 | 93.3% | 20 | 17 | 85.0% |
| 30 | 28 | 93.3% | 20 | 17 | 85.0% |
I think most people would agree that they’d rather have Goalie A over Goalie B, and while this is an extreme example, I think it highlights a flaw in Save Percentage as a metric and why more granular game based analysis can be necessary. The three very good games put up by Goalie B shouldn’t cancel out the 3 very bad games.
I’m hesitant to bring up goals against average as a “solution” to this problem, but bear with me for a second. Preventing goals is a goalie’s job, so GAA seems like it should be a natural measure of a goalie’s ability. But GAA has several flaws that really make it a bad metric, primarily that it doesn’t take into account the number of shots against. A goalie who faces 50 shots and lets in 3 goals is given just as much credit as a goalie who faces 20 shots and lets in 3 goals. Clearly if we could adjust GAA to incorporate the number of shots allowed GAA would be a more useful metric. The question then is how we should properly adjust GAA to evaluate a goalie’s performance in a given game.
The chart below shows the average goals allowed plotted against the number of shots against for all games since 2007. What we see intuitively makes sense: as the number of shots faced increases so does the number of goals, but the trend is more logarithmic than linear. If save percentage increases with shots against, we wouldn’t expect goals allowed to double just because shots against doubled.
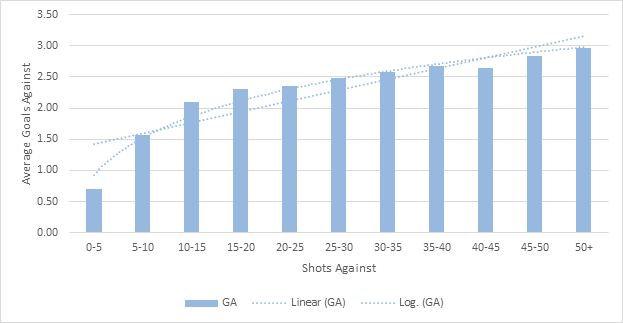
Average GA Per Game vs. Shots Against
With this in mind, we can create a model to evaluate how goalies performed on a game by game basis vs. the average goaltender facing the same number of shots. Taking all goaltending performances since 2007, we can look at how many goals we would expect an average goalie to give up, given the amount of shots against. Then, if we look at how many goals a given goalie gave up in each game and compare it to the expected goals against set by our model, we can come up with a shot adjusted goals against metric that provides an estimate of how many additional goals a goalie prevented (or allowed) over the course of a season. I’ll define two new metrics Goals Against Minus (GA-) and Goals Against Average Minus (GAA-) as:
GA- = ∑ GA – E(GA)
GAA- = (∑ GA – E(GA))/N
where GA is the goals allowed in given game, E(GA) is the Expected Goals Against given by the model, and N is the number of games played (ideally this would be the number of minutes played divided by 60, but I haven’t gotten around to setting that up yet).
This new metric has a few nice properties that adjust for what I perceive to be some of the problems with Save Percentage or Goals Against Average as metrics. First, for a constant goals against, a goalie who faces more shots against is rewarded more than a goalie who faces fewer shots. Second, for a constant save percentage, goalies who allow fewer goals against are rewarded more than goalies who allow more goals. And finally, it measures a goalie’s performance on a game-by-game basis, rather than overemphasizing certain games based on the number of shots faced.
The tables below show the top 10 and bottom 10 goalie performances in GAA- for all years since 2007 (for goalies who played a minimum of 33% of the season).
|
Top 10 Seasons by GAA- (2007-Present) |
|||
| Season | Player | GAA- | GA- |
| 20112012 | ELLIOTT, BRIAN | -0.85 | -32.15 |
| 20122013 | ANDERSON, CRAIG | -0.80 | -19.14 |
| 20102011 | THOMAS, TIM | -0.59 | -33.44 |
| 20112012 | SCHNEIDER, CORY | -0.57 | -18.79 |
| 20092010 | RASK, TUUKKA | -0.53 | -24.06 |
| 20122013 | EMERY, RAY | -0.53 | -11.05 |
| 20122013 | BOBROVSKY, SERGEI | -0.51 | -19.27 |
| 20112012 | LUNDQVIST, HENRIK | -0.48 | -29.80 |
| 20112012 | QUICK, JONATHAN | -0.48 | -32.37 |
| 20122013 | CRAWFORD, COREY | -0.48 | -14.26 |
I think this list really highlights how amazing Brian Elliott’s year last year was. While it does have a bit of a small sample size warning (he only played in 38 of the Blues’ games last year after all), it’s kind of crazy to see how far ahead of the rest of the list he was (Craig Anderson in an even smaller season notwithstanding). He essentially prevented just as many goals as Tim Thomas did in 2010-2011 while playing in 19 less games. Some of it is surely the system, but that number is still outstanding, though it should be noted that Elliott only slightly managed to avoid the Worst 10 Seasons list for his 2010-2011 atrocity (0.59 GAA-).
You’ll notice that the list contains a lot of names from this past season, I suspect that this is due to the small sample size and that some of those netminders (again, sorry Craig Anderson) likely would have come back down to earth over the course of a full year. It’s also interesting (although not altogether unsurprising) to see both of Chicago’s goalies from this year in the top 10. While the strength of their offense has gotten most of the attention, the goaltending definitely played a major part in their domination this year.
|
Worst 10 Seasons by GAA- (2007-Present) |
|||
| Season | Player | GAA- | GA- |
| 20122013 | KIPRUSOFF, MIIKKA | 0.80 | 19.24 |
| 20102011 | KHABIBULIN, NIKOLAI | 0.78 | 36.47 |
| 20112012 | ROLOSON, DWAYNE | 0.76 | 30.34 |
| 20082009 | HEDBERG, JOHAN | 0.75 | 24.63 |
| 20122013 | CLEMMENSEN, SCOTT | 0.69 | 12.42 |
| 20082009 | TOSKALA, VESA | 0.67 | 34.78 |
| 20082009 | MACDONALD, JOEY | 0.66 | 32.58 |
| 20122013 | PETERS, JUSTIN | 0.66 | 11.96 |
| 20092010 | DESLAURIERS, JEFF | 0.64 | 28.03 |
| 20092010 | TOSKALA, VESA | 0.63 | 20.20 |
On the other end of the spectrum, I know I’ve said it before but the Leafs were really lucky to avoid trading for 2012-2013 Miikka Kiprusoff. Kipper essentially let in an extra goal in 4 of every 5 games this year, which is probably as good a sign as any that you should retire.
That being said, I don’t think any Leafs fans will be happy to see Vesa Toskala’s name appearing twice on this list (although I doubt that many of them are surprised). And it would surely be rubbing salt in their wounds to point out Tuukka Rask’s name in the 5th spot of the top seasons list, so I won’t go that far. Nor will I point out that Rask is the leader by this metric over the past 6 years, since there’s more than enough data there to warrant another post.

[…] term “goalies are voodoo” is a common one in hockey analytics, and evidence for that idea is plentiful. However, Brad McPherson examined how to make drafting […]