
In Part I of our review of zone starts, we looked at the how the traditional definition of zone starts varied from what most people would consider a “true” zone start, and found that when we applied the true zone start definition to our data, the spread between players in zone start percentages decreased significantly. One key reason for the difference between methods is the inclusion of on-the-fly starts, which tend to make up around 60% of a players total shifts, and which drastically decrease the impact of each defensive/offensive/neutral faceoff. Another driver is the fact that often a player’s zone start percentage is impacted by their own performance: bad players end up with more defensive zone faceoffs due to their inability to drive possession, which incorrectly inflates their defensive zone start percentages. This also helps to create a false link between zone start percentages and possession numbers, leading people to incorrectly infer that tough zone starts are a key driver behind a player’s results.
While it’s useful to know that the true difference in zone starts between players is generally minimal, that doesn’t necessarily mean that we can just ignore them completely. To make a judgement about the overall impact that zone starts have we first need to figure out what the impact of a single zone start is on possession. To do that, we can simply look at all the 5v5 shifts taken since 2008 in aggregate, and calculate the overall Corsi For Percentage broken down by starting location.
| Zone Start | CF% |
| Def. Zone | 37.7% |
| Neu. Zone | 47.7% |
| Off. Zone | 59.8% |
| On-The-Fly | 50.9% |
Here we see that the individual zone start effect is actually quite large, as a player who started each of his shifts in the defensive zone would be expected to post a meagre 37.7% CF% (a number so low that only 7 players since 2005-2006 have posted full seasons that poor). Similarly, an average player who entered the ice only for offensive zone faceoffs would likely see his CF% come in somewhere in the 60% range, which would put him in elite company as one of the best possession drivers in the league. These, of course, are unrealistic hypotheticals, but they do illustrate that on a small scale the effect of zone starts can actually be rather large.
Also interesting to note is that shifts beginning On-The-Fly actually post a CF% slightly above 50%. This may reflect the fact that changes tend to occur as the puck is moving towards the offensive zone, creating a natural advantage for those joining the play at that point. Similarly, the fact that a Neutral Zone Start is expected to end in sub-50% possession may seem odd, but may be structural in nature as well. A neutral zone start beginning with a faceoff win may go something like this: faceoff win, attack against a full 5-man defensive unit (likely to decrease the odds of a controlled entry or a decent chance), opposition gains control and counterattacks with a fresh, on-the-fly unit. Alternatively, a neutral zone start that begins with a loss could follow the same pattern with the unit leaving the ice after defending their opponent’s attack and not getting the opportunity to attack themselves. In either case it’s not hard to see how starting a shift in the neutral zone could actually be a net negative from a possession point of view: even when shift starts well with a faceoff win, the resulting attack is more difficult than in most other offensive situations.
In order to turn our aggregate expected percentages into an individual level adjustment, we first need to calculate the weight each shot attempt should receive based on where the player’s shift started (similar to how we adjusted for score/venue effects in the past). Each number in the table below is used as a multiplier based on the zone that a particular shift started in. So a shot attempt for following a defensive zone start is worth roughly 25% more than one from a shift that started On-The-Fly, while a shot attempt against during a shift that began in the offensive zone is 20% worse than an On-The-Fly attempt against.
| Zone Start | Corsi For Adjustment | Corsi Against Adjustment |
| Def. Zone | 1.25 | 0.75 |
| Neu. Zone | 1.05 | 0.95 |
| Off. Zone | 0.80 | 1.20 |
| On-The-Fly | 0.98 | 1.02 |
While each individual adjustment factor seems to be quite large when compared to the On-The-Fly weights, after we apply these factors to each player’s seasonal results from the past 5 years we see that the effect of the adjustment is small for most of the league: 80% of the players saw their numbers move up or down by less than 0.5%, and only 79 of 3275 qualifying players showed a delta either way of more than 1%. All of this makes sense given that we found in Part I that the spread in true zone starts was much less than we’d previously estimated, and that On-The-Fly starts (which see almost no adjustment) tend to make up the bulk of most player’s shifts.
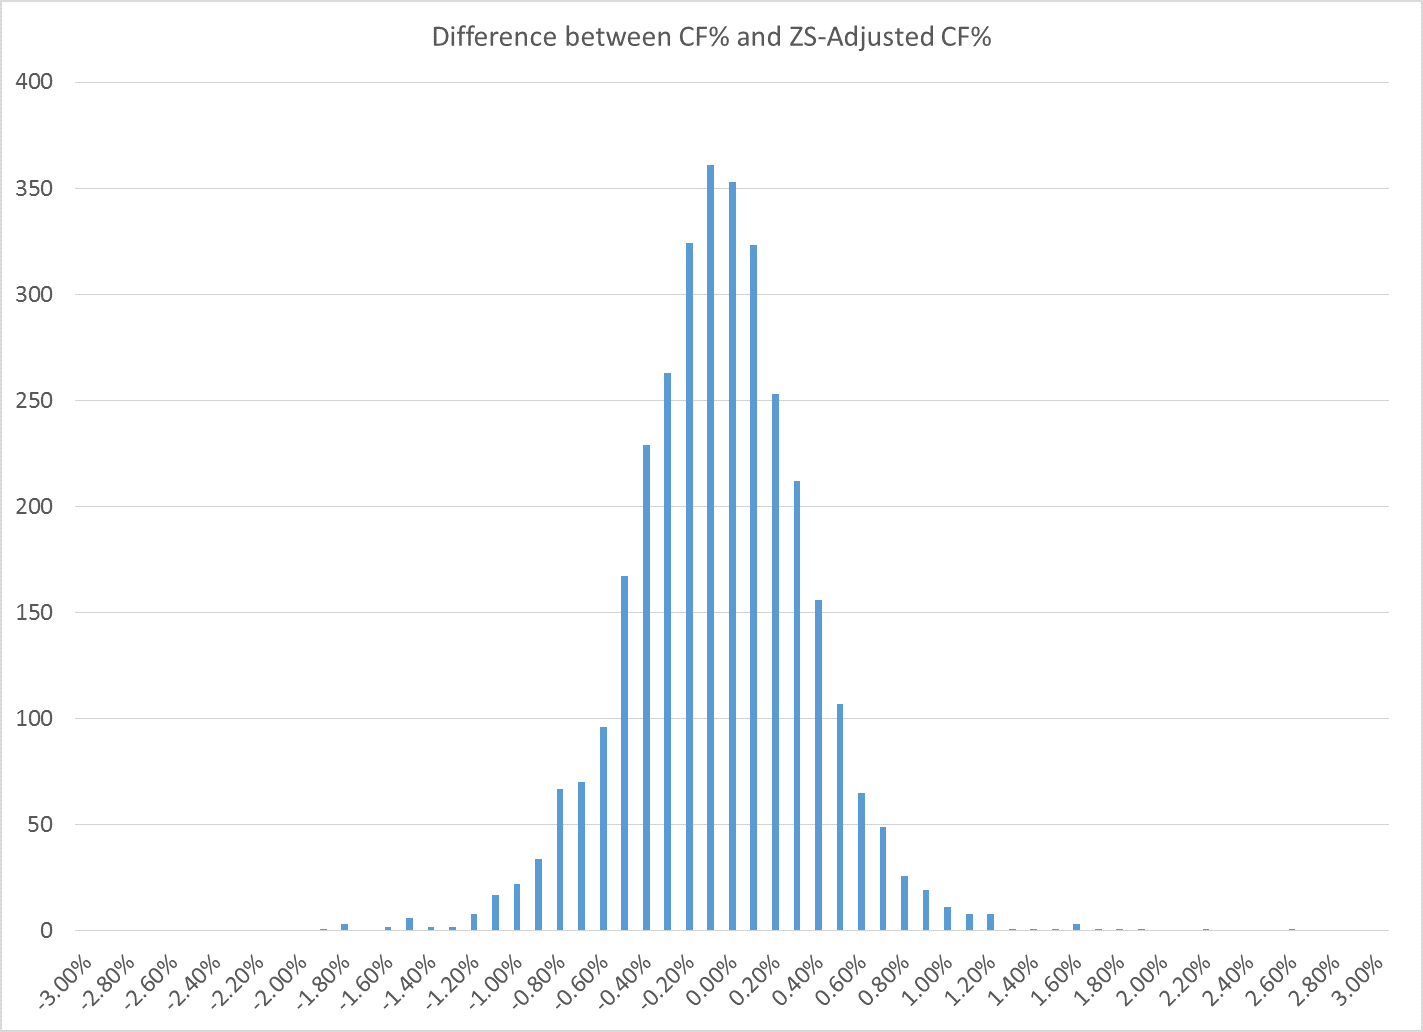
Distribution of difference between CF% and Zone Start Adjusted CF%
The largest upwards move over the last 5 years was Boyd Gordon’s 2013-2014 season, where his Zone Start Adjusted Corsi For Percentage was 2.6% higher than his raw Corsi For Percentage. Manny Malholtra was the only other player to see his CF% shift up by more than 2%, as his 2011-2012 numbers moved from a dreadful 39.8% Raw CF% up to a better-but-still-awful 42.0% after accounting for his deployment. Unsurprisingly, the players who most suffered from our adjustment were the Canucks first liners under Alain Vigneault. Between 2010-2011 and 2012-2013, Henrik Sedin, Daniel Sedin, and Alex Burrows saw 9 of the 16 largest decreases in of all player seasons in our sample.
One potential issue with our adjustment is the lack of what I’ll call symmetry in the factors. Consider the following example: Line A starts a shift on the fly, takes the puck down the ice and forces a stoppage by the opposing goaltender. Line A then stays on for the resulting faceoff against a new defensive unit, Line B. Line A wins the faceoff, cycles the puck for 30 seconds, and takes a shot on goal that is again frozen. Both lines leave the ice.
The problem with applying our approach to this hypothetical is that the one shot on goal is worth different things to each team. For Line A, that shot for has a weight of 0.98, since they started his shift on the fly. On the other hand, for each player on Line B, the weight of the attempt drops down to 0.75 given that they started the shift in their defensive zone. Somehow we’ve managed to create a world in which the adjusted Corsi for of Team A is not equal to the adjusted Corsi against of Team B.
The mismatch is odd to consider, but may be the best option when you consider our alternatives. One method would be to look at pairings of matchups when calculating our expected results (i.e. CF% for line with OZS vs. line with OTF), but this is both analytically difficult to compute (what do you do if one team has multiple start types, for example a defensive pairing that came on at a faceoff and a forward line that started on-the-fly) and requires us to go back to using results broken down by each faceoff.
An alternative method would be to break down play into the game states that Tyler Dellow had previously suggested (i.e. play following a Defensive Zone Faceoff Win, Loss, etc.), and to look at results after faceoffs independently from open-play results. While this achieves the symmetry that we desire, it does take us away from the idea that the effects of each zone start should be counted only once. We can still fall into the trap of bad players ending up in the “negative play cycles” that we discussed in the first article, where their expectation is falsely lowered by the fact that they’re not great players to begin with.
One interesting point that came up after I published part I was made by Garik16, who noted that removing non-zone start faceoffs may not be appropriate given that each faceoff still represents a coaching decision, even if that decision is to leave the line out there*. He suggested that a good model would be one that counted all faceoffs, but decreased the weight for subsequent faceoffs on a shift to penalize players who ended up stuck in their own end because of their poor play. While this wouldn’t fully address the symmetry issue, it may better reflect the usage decisions that coaches are making.
With that being said, it also adds a lot of complexity to a subject that may not actually require it. After all, even with our simplistic but blunt approach here, we see that very few players require significant adjustments to their numbers due to their zone starts. While it’s true that more accurate numbers are always better, it’s certainly becoming clearer that outside of a handful of players the effect of zone starts on possession aren’t as great as we may have thought, and may actually be negligible for a large portion of the league.
*As an aside, there doesn’t seem to be many players whose shift lengths differ greatly between offensive and defensive zone starts, indicating that partial shift results don’t frequently lead to shifts being cut short or extended.

[…] could be because GMs are starting to value guys who “start” more in the Defensive Zone. There is some really excellent work being done on whether zone starts actually affect possesion the … (Click that link, it’s very interesting – thank you @ineffectivemath for bringing it […]
[…] I didn’t include Zone Starts in these graphs, partially because of this article challenging their usefulness on an aggregate level. (The larger reason is because it looked gross, and vanity couldn’t allow me to put out ugly […]
[…] and it also did not account for the strength of a player’s opponents as there has been a significant amount of research suggesting that both of those components might not be relevant in helping […]
[…] you tend to start your shifts also matters a little bit, but adjustment should be […]
[…] zone starts and quality of competition likely don’t color the possession numbers as much as one might […]
[…] for offensive or defensive purposes, the reality is that for most players’ zone starts have a relatively small effect on a player’s performance. And yet, many hockey writers still frequently qualify a player’s performance based on […]
[…] for offensive or defensive purposes, the reality is that for most players’ zone starts have a relatively small effect on a player’s performance. And yet, many hockey writers still frequently qualify a player’s performance based on […]
[…] of zone starts on a player performance over an entire season is largely overstated (see here, here, here, and here) and I’m primarily interested in highlighting the explanation as to why. […]
[…] Player, Pineapple Shift Starts and Ends, Part 2 How much do zone starts matter? (part 2, part 1 linked in […]
[…] I usually don’t include zone starts because Matt Cane’s excellent post 1 and post 2 on zone starts made everyone think differently about them and to stop over valuing […]
[…] include zone starts because Matt Cane’s excellent post 1 and post 2 on zone starts made everyone think differently about them and to stop over valuing them. Since […]
[…] with the toughest zone starts of his career. It has been debated as to how much zone starts matter (not as much as you may think). The majority of shift starts begin on the fly (approx. 60%) with few players having meaningful […]
[…] a conversation on role is important here. But research shows defensive zone starts don’t impact possession very much. I’m open to the idea that the analytics community doesn’t properly account for quality […]
[…] of a chance of being forced to play defense. Well, yes and no. In theory, that’s true, but when you look at the data in aggregate, zone starts don’t matter as much as you’d think. This is mostly because the vast majority of a player’s starts come “on the fly” where […]
[…] Just like with Score/Venue adjustment, there are a couple different ways to go about this. One is to look at how likely a Corsi event is to occur after each shift start, including on-the-fly ones. […]