
Travis Yost, TSNs newest hockey analytics writer, recently posted a piece outlining his most overrated and underrated players from a fancy stats point of view (related note, Travis’ piece on Nathan Mackinnon is a must read, provided they actually fix the link on the new site). His lists contained a lot of names that will be familiar to those who keep up to date with the analytics world: Benoit Pouliot, fancy stat darling of the 2014 free agent class, and Marc-Edouard Vlasic both make appearances in his group deserving of more respect, while Andrew Macdonald and eternal stats whipping boy Jack Johnson are pointed out as having more eye test value than actual value on the ice.
One player who Travis called out as being overrated, Kings goaltender Jonathan Quick, caught my attention in particular though. While Travis isn’t the only analyst who has accused Quick of getting too much media praise (and his critique about Quick’s 5v5 save percentage is certainly a valid point), I’ve always felt that Quick doesn’t tend to get a fair shake from the stats community given that his shots against numbers have been so far from the norm in recent years. As I’ve written about in the past, save percentage tends to increase as shots against go up, and Quick is a goalie who has faced an unusually low number of shots over the past few years. If we look at the 38 goalies who have played at least 3000 total minutes over the past 3 years, only 2 (Brian Elliott and Martin Brodeur) have faced fewer even-strength shots on a per 20 minute basis than Quick. Part of this is certainly due to the fact that he’s played behind LA’s puck possession machine for the past few seasons, but when we’re presented with data like this it does beg the question of whether his shots against data is accurate (or more precisely, whether there’s any bias in the data recorded by the LA scorer at home).
To look into this, I started by pulling 5v5 home and road shot data from stats.hockeyanalysis.com for each goalie who played at least 1500 minutes at and away from home over the past 3 years. I then compared each goalie’s shots against rate at home to their shots against rate on the road to look for teams who may be under or overcounting shots against at home. Lastly, I conveniently summarized all of this data in the chart below.
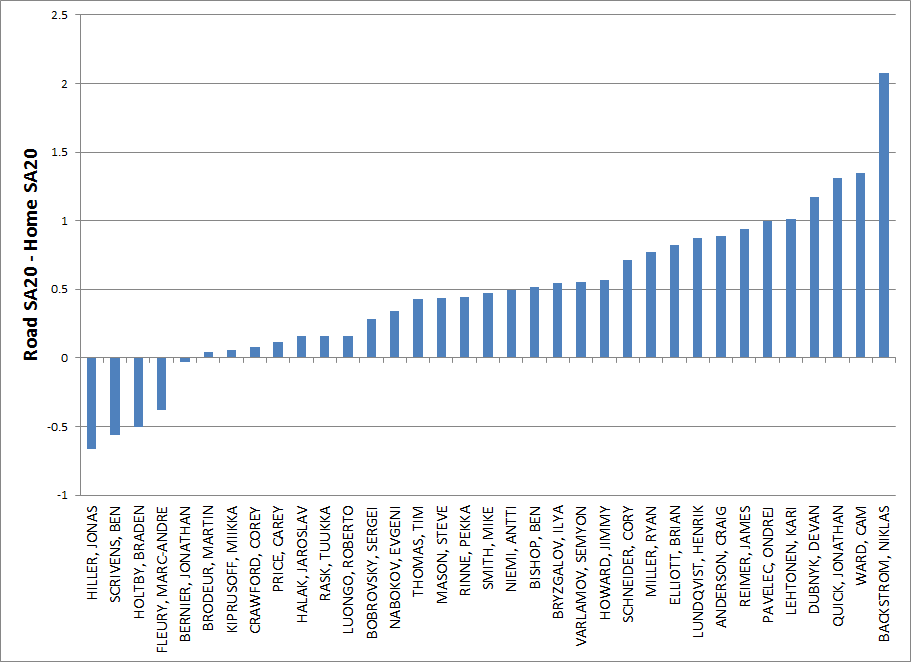
2011-2014 Road SA20 – Home SA20
As we’d expect, most goalies do see a bump in shots against on the road (within our dataset, this bump averages around 0.48 SA20, or roughly 1.4-1.5 shots per game). We can also see that for several goalies the difference appears to be non-negligible, and is much greater than or less than the mean. In particular, for netminders such as Quick, Niklas Backstrom and Cam Ward the increase in SA20 translates to more than 3 additional even-strength shots per game, which, when we consider that 50% of the games are played at home, could have a significant effect on a goalie’s save percentage.
The question then is how can we adjust our home numbers to take into account the scorer bias that we see? One way to do it is to simply assume that the road data contains enough signal that we can assume they faced the same shots against rate at home (after adjusting for the expected Home/Road differences). In other words we can calculate an adjusted home shots against rate by removing the home ice advantage factor from the roads shots against rate.
Adjusted Home SA20 = Road SA20 – 0.48
We can then multiply our Adjusted Home SA20 number for each goalie by the number of home minutes they played, to calculate an Adjusted Home Shots Against.
Adjusted Home SA = Adjusted Home SA20 * Home 5v5 TOI / 20
Then we simply take the actual number of goals allowed at both home and on the road (after all, it’s impossible to undercount goals against), and divide it by our total adjusted shots against to figure out an adjusted save percentage.
Adjusted Sv% = 1 – (Home GA + Road GA)/(Adjusted Home SA + Road SA)
This approach isn’t perfect, but it does make intuitive sense: we’d expect some home-ice advantage in the rate of shots against, but over a long enough time period, we don’t expect one team or another to have significantly more or less home ice advantage than the rest of the league. It stands to reason then, that if we look at enough data (and I’d argue that 3 seasons is probably sufficient after splitting the data by home/road games), that any additional home ice advantage we see is likely scorer bias. So how does Jonathan Quick look using our new measure?
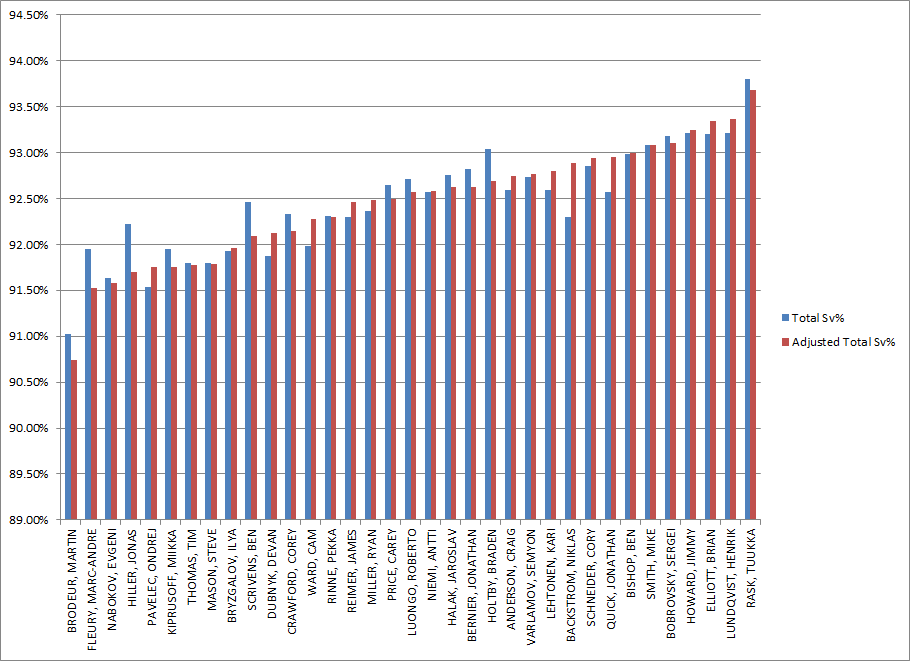
Scorer Adjusted Save Percentage (2011-2014)
After we’ve re-adjusted our data, Quick looks a lot better in comparison to the rest of the league, going from an unadjusted 5v5 save percentage of 92.57% to an adjusted save % of 92.95% (or from 17th in our sample to 8th in our sample). We also see (expected) jumps for Niklas Backstrom (23rd to 10th) and Kari Lehtonen (16th to 11th), while players with higher Home SA than Road SA tend to drop: Jonathan Bernier goes from 10th down to 15th, while Roberto Luongo falls from 13th to 18th. We can also take some comfort in the fact that our new metric hasn’t completely thrown off the well accepted fact that Henrik Lundqvist and Tuukka Rask have been the best goalies over the past few years.
The one other thing that we can look into is how well home and road save percentages predict each other. Ideally, if save percentage is in fact indicative of a puck-stopping ability possessed by goalies, there should be a reasonably high correlation between the save percentage a goalie records at home, and what he’s able to put up on the road. In reality though, the correlation isn’t that strong-within our dataset the correlation between Unadjusted Home Sv% and Road Sv% was just 0.11. On the other hand, when we adjust Home Sv% the correlation with Road Sv% rises to 0.28. What this is telling us is that more of the “skill” likely persists when we rebaseline the number of shots against a goalie faces at home. The correlation still isn’t great with our adjusted numbers (there’s likely some form of home ice advantage in save percentage as well), but it’s definitely better than what the raw data indicates.
Now this article isn’t meant to say that Travis’ analysis was lacking in any way, nor was it meant to be a big pitch for a new way to evaluate goalies. What I’m hoping to highlight is that goaltending ability is really difficult to measure, and that biases at the rink level can have a particularly pronounced impact on how we look at netminders. For a goalie like Jonathan Quick scorer bias could be leading us to underestimate his ability by about 0.38%, and he doesn’t even have the largest delta in our dataset. None of this, of course, has any bearing on Quick being a “clutch” goalie (which is obviously nonsense), but it does lend some credence to the argument that he has been one of the better goaltenders in the league over the past few year, and that he appears to be (at least in this analysis) an above average goalie in today’s NHL.

[…] debate over whether Quick is an elite goalie or just a merely good one playing in a great system has been roaring for years. But one way or another, this is his team… assuming he’s […]