
Score effects – they’re real, and they’re spectacular. And while the idea and impact of score effects are generally understood by most in the hockey analytics community, they can often be a difficult subject to introduce to newcomers to the field. A solid knowledge of score effects is critical to understanding why teams that outshoot their opponents in a given game tend to lose more often than not, or why a player or team’s unadjusted statistics may be misleading you.
Furthermore, while many people have hypothesized about what causes score effects, there’s currently little documented analysis examining the actual drivers of score effects. So consider this article, and its coming sequel, as first steps at drilling deeper into the factors that lead us to observe score effects. Hopefully these pieces will serve as both a reference point to provide a basic understanding of score effects, and as evidence that helps justify any adjustments we do make when devising new statistics.
What are score effects?
Score effects generally refer to two changes that happen in a hockey game depending on the current score. When a team is up by 1 or 2, our expectation of how they’ll perform (and consequently what stats we’ll record) is different than when they’re down 1 or 2. These changes often have a non-trivial impact on the stats teams and players accumulate in any given game or season, and consequently can change our impression of them fairly significantly.
The first change, which is generally more widely discussed, is that teams that are trailing tend to take a greater percentage of the shot attempts, while teams that are leading (obviously) take a lower percentage of the shot attempts.

Corsi For Percentage by Score State
This is the factor that lead to the development of Score Adjusted Corsi and Fenwick, first popularized by Eric Tulsky, and more recently updated by Micah Blake McCurdy. Score Adjusted Metrics have been shown to better predict future results than non-Score Adjusted Metrics, highlighting the impact that score effects can have on our understanding of a team’s underlying talent.
The second change, which is referenced far less often, is that teams that are leading tend to score on a higher proportion of their shots (i.e., they post a higher shooting percentage) than teams that are trailing. The obvious corollary to this is that teams that are leading also see their save percentage rise, giving them a percentage advantage on both offense and defense. And while we’ve known for a while that these changes happen, there’s been less research on why the percentages change when the score changes, and if there’s any information in these changes that we can use to better understand the performance of a team. It’s the drivers of these percentage changes that we’ll look into in this article, to see if we can figure out what’s really behind the shifts we see.
Wait, let’s back up a step first – do teams in the lead really score on more of their shots and allow fewer of their opponents’ shots in?
Yes, as unbelievable as it may sound, teams become better shooters and goaltenders when they’re in the lead compared to when they’re trailing.

Shooting Percentage by Score State

Save Percentage by Score State
There are 2 things to note here: first, when games are tied teams play better defensively, and fewer shots go in than when one team is leading. This is true for both offense and defense, and doesn’t necessarily have profound implications for our analyses, but is nonetheless interesting to note.
Second, goalies and shooters for teams who are leading get a significant bump when they’re up a goal or two: shooters who are up by 1 tend to score on 0.6% more of their shots than shooters who are down by 1, and shooters who are up by 2 nearly hit a 9.5% shooting percentage, almost 2% higher than they shoot when the game is tied. Goalies see the same trend: their save percentage when up is 0.5%-1.5% higher when leading than it is when they’re behind.
So why do teams shoot better when they’re leading? Is it because the teams with better shooters are generally leading more often?
Actually, no. To test this idea we can bucket each team by their shooting percentage in tied games and see if the general trend holds. The tied shooting percentage should give us a reasonable estimation of a team’s true shooting talent, so if we still see score effects after we’ve bucketed these teams it’s reasonable to conclude that it’s not an issue of better shooting teams playing with a lead more frequently.
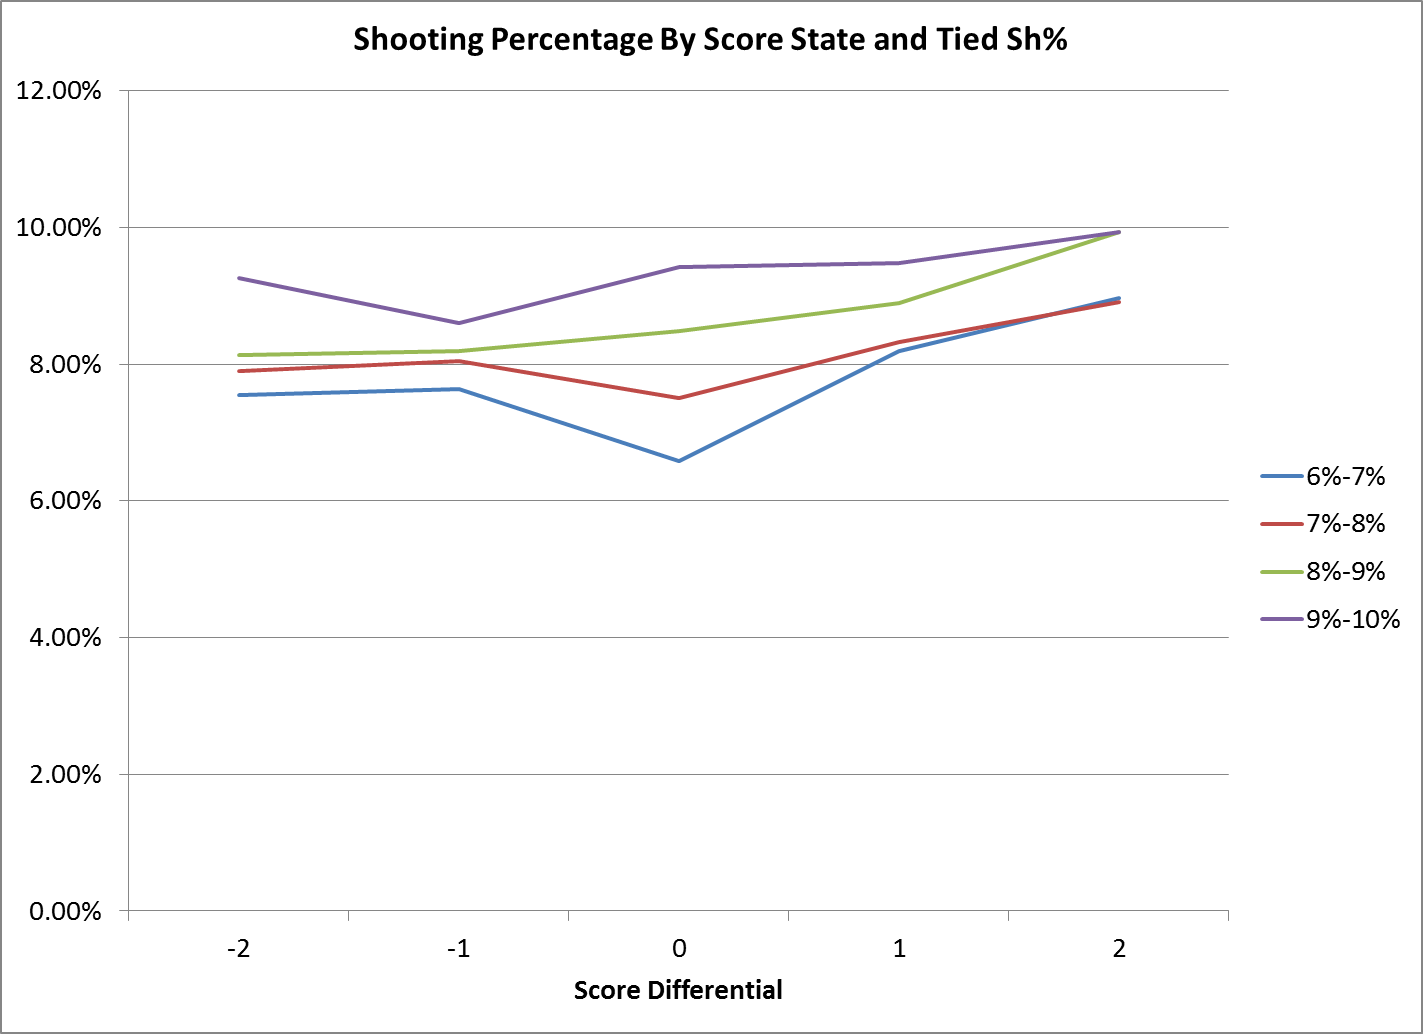
Shooting Percentage by Score State and Tied Sh%
And when we look at the data, that’s exactly what we see – at each level of “natural” shooting talent, we see the same trend, with the shooting percentage when leading landing higher than the shooting percentage when trailing. There’s clearly more to it than just talent differences, as the effect tends to persist across different types of teams.
Ok, what about on defense? Maybe the teams that have better overall goaltending are in the lead more often?
Once again, the answer is no. If we do the same analysis we just did, but this time we group by save percentage, we still see score effects in each group. Even for the teams whose goalies posted a sub-0.910 save percentage when tied, they still received better goaltending when in the lead than when behind. Once again, we see that the effect persists even after we take into account any differences in underlying ability.

Save Percentage by Score State and Tied Sv%
Is it where teams are shooting from? Are good teams just getting more shots from high danger areas?
This seems to be partially the case – when teams are down or tied, the distribution of their shots in generally the same, with the % of shots taken from the high danger zone unchanged between the -2, -1 and tied score states. There is some shift to taking more low danger shots and fewer medium danger shots when losing, but it’s not a significant move.
| % of Shots From Danger Zone | |||
| Score Differential | Low | Medium | High |
| -2 | 45.3% | 27.1% | 27.6% |
| -1 | 45.0% | 27.4% | 27.6% |
| 0 | 44.9% | 27.6% | 27.6% |
| 1 | 42.9% | 28.7% | 28.5% |
| 2 | 41.8% | 28.6% | 29.6% |
We see the real differences when teams are ahead, as those clubs take a larger portion of their shots from the higher danger zone (29.6% when up 2 vs. 27.6% when tied) and a lower amount from the low danger zone (41.8% when up 2 vs 44.9% when tied). Given that high danger shots are (obviously) more dangerous, can we conclude that this shift alone is enough to explain the changes in shooting and save percentage that we’ve noted above?
To answer that question, we need to look at whether score effects exist within each danger zone; in other words we need to know whether a player who takes a shot from the slot while he’s ahead 2 is more likely to score than a player who takes a shot from the same spot in a tie game.

Danger Zone Shooting Percentage by Score State
And as it turns out, teams do actually shoot better in each of the three danger zones when they’re leading (and similarly, they shoot worse when they’re behind regardless of shot location). So while the shift towards more high danger shots when leading might explain some of the increase in shooting percentage, it’s clear that there’s more to the story than just that. It may be that teams that are leading are taking more of their high percentage shots on odd man rushes, or that defenders are more frequently out of position as they pursue more aggressively in an attempt to regain possession – in any case, teams are able to convert more frequently no matter where they are on the ice if they’re ahead.
This is critical to know as we move towards the development of expected goal models, as it indicates that the score still has a major impact on the likelihood that a shot goes in. Knowing the shot location is clearly important, but adding in the score state gives us more information that can further refine our assessments, and help us form a better understanding of a team or player’s talents.
That’s a lot to take in. Can you summarize it all for me?
Sure, basically what we’ve found is:
- Teams post higher shooting percentages when they’re ahead than when they’re behind. But they also see the lowest shooting percentage in tie games.
- Consequently, teams post higher save percentages when they’re ahead than when they’re behind. When they’re tied, they record the highest save percentages of any score state.
- The increase in shooting percentage when leading happens to teams regardless of how much underlying shooting talent they have.
- The increase in save percentage when leading happens to teams regardless of how much underlying goaltending talent they have.
- Teams tend to take more of their shots from high danger zones when they’re ahead. Teams tend to take more of their shots from low danger zones when they’re behind.
- Score effects happen within danger zones as well – even after we’ve split up the shots by danger zone, we still see the same patterns that we do in the overall dataset. In other words, the shift in where shots are taken from is not enough to explain why teams shoot better when they’re leading.
Wait, what about the whole Corsi Percentage thing?
Haven’t you had enough yet? Not to worry, we’ll dig deeper into the changes in shot attempts in Part 2, which (hopefully) will be up soon.
Data
All data used in this article was taken from War On Ice. Data is for 5v5 situations only, and covers all games from the 2005-2006 season to the end of the 2013-2014 season, excluding playoffs.

[…] • Looking at Score Effects. What are they and what drives them? [Puck Plus] […]
[…] • Looking at Score Effects. What are they and what drives them? [Puck Plus] […]
Matt, very cool read and an important concept to recognize how the context of the score impacts the way teams play.
I think all of the possible explanations you examined for teams playing better both offensively and defensively when they have the lead make sense. You graphs were also excellent and very clear and easy to use. However, I’m thinking there may b: 1) a simpler explanation that just relates to the idea of percentages or 2) other metrics to be proxies for offensive and defensive performance. Would love to see your thoughts.
So for the first thought. If a team has the lead, and is taking fewer shot attempts (as indicated by the Corsi Score Effects Data), maybe it’s not that they’re really shooting better or taking more chances in the danger zone (despite the 2% increase from a tie to a 2 goal lead, which doesn’t seem like a statistically significant increase, I’d have to look at the raw data to see). Instead, if they do happen to score, they’re not taking as many shots or shot attempts and therefore what appears to be better “skill” is essentially just a change in ratios/rules of probability. That is, if goals is your numerator, and shots on goal is your denominator (SH%), it makes sense that you’d have a higher shooting percentage. This same explanation would also apply for the defensive side of things, if we’re looking at save percentage. Because the other team is shooting less when they have the lead, if the goalie of the team who is behind lets a goal in, it contributes to a bigger change in SV%.
As for my second thought, I’ll admit I haven’t fully work it out, but I had some ideas to throw out there. According to my understanding of “Danger Zones” from War-on-Ice, these are just where a shot attempt comes from, but they do not account for the play that developed, the type of shot or scoring chance. You have probably seen the shot quality project stuff from Chris Boyle at Sportsnet and The Royal Road stuff from Steve Valiquette of MSG. I like how they break down quality scoring chances with the idea of green, yellow, and red shots. For example, just because a shot is from a medium danger area, doesn’t it mean it’s not a high quality shot. Cross ice passes over the royal road and shot from the “medium” area would be considered a high quality scoring chance by others. I’m not sure if your categories would get too small if you were to further divide up the types of chances beyond the 3 different danger zones, but I think that would be something interesting to investigate. As for looking more explicitly at the defensive side of things, I’d be curious to see what types of specific defensive plays may change with score leads, such as stick checks, hits, shot blocks, neutral zone and defensive zone dumps and outlet passes. Not sure how this will translate specifically to goal scoring, but it would provide a different look at how teams play different according to different scores.
You may have already considered alot of this, but I was not totally sure and was just curious to see what you think and to discuss further. Thanks man, and keep up the great work. Cheers!
I’m also wondering if all the data you look at as for 5 on 5 only, and if looking at different strength situations, 4 on 4, 5 on 3, 5 on 4, 4 on 3 would add any other information to help explain this. Also, just realized this is just part 1, and I bet you’ve considered alot of these different ideas and situations already and may just be waiting to write about them in separate pieces, so sorry if I’m just repeating things you’ve already thought about.
[…] component of the ranking is still only 33%, with 20% being given to iHSC/60, and 13% to iSC/60. There is now some good evidence that iHSC/60 actually goes down when Tied or Losing, so I feel this is still extremely important to include when considering who is more […]
[…] shooting percentage while giving up more shots against and posting a higher save percentage. Matt Cane wrote a good article about about score effects which I recommend you read if you are not familiar with the concept. Score effects is a well […]